

SUMMARY
In the absence of low-level endoplasmic reticulum-to-mitochondrial Ca2+ transfer, ATP levels fall and AMPK-dependent, mTOR-independent autophagy is induced as an essential survival mechanism in many cell types. Here we demonstrate that tumorigenic cancer cell lines, transformed primary human fibroblasts and tumors in vivo respond similarly, but autophagy is insufficient for survival, and cancer cells die while their normal counterparts are spared. Cancer cell death is due to compromised bioenergetics that can be rescued with metabolic substrates or nucleotides, and caused by necrosis associated with mitotic catastrophe during their proliferation. Our findings reveal an unexpected dependency on constitutive Ca2+ transfer to mitochondria for viability of tumorigenic cells and suggest that mitochondrial Ca2+ addiction is a feature of cancer cells.
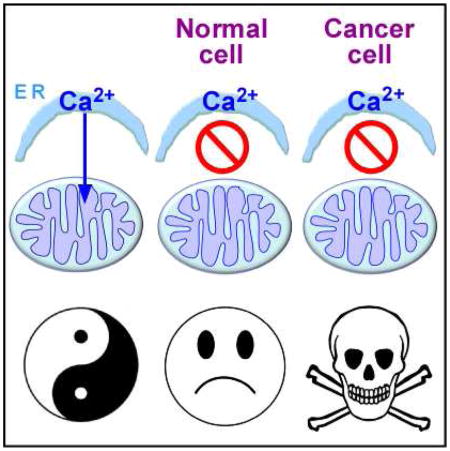
Graphical abstract
INTRODUCTION
Inositol 1,4,5-trisphosphate receptors (InsP3Rs) are a ubiquitous family of Ca2+ release channels present primarily in the endoplasmic reticulum (ER) (Foskett et al., 2007). Ca2+ release through the InsP3R regulates numerous cell functions including transcription, proliferation, secretion and motility, among others (Cardenas et al., 2005; Foskett et al., 2007). InsP3R-mediated Ca2+ signals also regulate cell metabolism, primarily by supplying released Ca2+ to mitochondria where it stimulates production of reducing equivalents by pyruvate dehydrogenase (PDH) and two Ca2+ dependent dehydrogenases in the tricarboxylic acid (TCA) cycle, alpha-ketoglutarate dehydrogenase (α-KGDH) and isocitrate dehydrogenase (IDH) (McCormack and Denton, 1979), as well as activities of respiratory chain components to promote oxidative phosphorylation (OXPHOS) and ATP production (Murphy et al., 1990; Territo et al., 2000). Low-level constitutive InsP3R-mediated Ca2+ release is essential for maintaining basal levels of OXPHOS and ATP production in a wide variety of cell types (Cardenas et al., 2010). In the absence of constitutive ER-to-mitochondrial Ca2+-transfer, ATP levels fall and AMPK-dependent, mTOR-independent autophagy is induced (Cardenas et al., 2010; Mallilankaraman et al., 2012a; Mallilankaraman et al., 2012b), as an essential survival mechanism (Cardenas et al., 2010). In all cell types examined, inhibition of constitutive mitochondrial Ca2+ uptake induced a bioenergetic crisis that resulted in a reprogramming of metabolism reminiscent of that induced by nutrient starvation despite nutrient availability and enhanced nutrient uptake.
A hallmark feature of cancer cells is a re-programming of their metabolism even when nutrients are available (Boroughs and DeBerardinis, 2015; Jones and Thompson, 2009; Jose et al., 2011). All major tumor suppressors and oncogenes have connections with metabolic pathways (Deberardinis et al., 2008; Koppenol et al., 2011; Levine and Puzio-Kuter, 2010; Vander Heiden et al., 2009). Warburg suggested that cancer originates from irreversible injury in mitochondria followed by a compensatory increase of glycolysis (Warburg, 1956), but increasing evidence indicates that mitochondrial function is essential for cancer cells (Koppennol et al., 2011). A continuous supply of metabolic intermediates from the TCA cycle fuels lipid, nucleic acid and protein biosynthesis and provides redox power essential for cancer cell proliferation (Boroughs and DeBerardinis, 2015; Deberardinis et al., 2008). Many tumor cells require OXPHOS to maintain growth (Birsoy et al., 2014; Caro et al., 2012) and for the majority of their ATP production (Jose et al., 2011). Mutations in OXPHOS genes are tumorigenic (Bayley and Devilee, 2010) and mitochondrial inhibitors have antitumor activity (Cheng et al., 2012; Momose et al., 2010; Zhang et al., 2014).
Accordingly, here we asked what role constitutive mitochondrial Ca2+ uptake, important in normal cell bioenergetics, plays in cancer cell metabolism and viability. Using tumorigenic breast and prostate cancer cell lines and genetically transformed isogenic primary human fibroblasts, we found that interruption of constitutive ER-to-mitochondrial Ca2+ transfer elicited effects similar to those observed in normal cells, including diminished OXPHOS, AMPK activation and induction of autophagy. Whereas autophagy was sufficient for survival of normal cells, it was insufficient in cancer cells, which responded strikingly with massive death while their normal counterparts were spared. Furthermore, inhibition of InsP3R activity strongly suppressed melanoma tumor growth in mice. Addition of metabolic substrates or nucleotides rescued the lethal effect of inhibiting mitochondrial Ca2+ uptake, suggesting that cell death was induced by compromised bioenergetics. Cell death was caused by necrosis associated with mitotic catastrophe at daughter cell separation during ongoing proliferation of the cancer cells. Our findings reveal a fundamental and unexpected dependency InsP3R-mediated Ca2+ transfer to mitochondria for viability of cancer cells.
Results
Inhibition of InsP3R Activity Creates a Bioenergetic Crisis in Both Tumorigenic and Non-tumorigenic Cell Lines
We examined the effects InsP3R inhibition on metabolic responses of human breast and prostate cancer-derived tumorigenic cell lines. As controls, we examined non-tumorigenic lines derived from normal tissues. XeB (5 μM, 1h), a specific InsP3R inhibitor (Jaimovich et al., 2005), reduced basal and maximal oxygen consumption rates (OCR) (Figure 1A), enhanced AMPK phosphorylation (P-AMPK) (Figure 1B) and induced autophagic flux in both non-tumorigenic and tumorigenic breast (Figure 1C and Figure S1A–B) and prostate (Figure S2A and B) cell lines. The effects of XeB on bioenergetic parameters were dose dependent, with 5 μM the minimum concentration required to strongly induce autophagy and significantly reduce basal and maximal OCR in both MCF10A and MCF7 cells (Figure S1C–F). Similar responses to InsP3R inhibition, including decreased OCR, increased P-AMPK and induction of autophagy were observed in mouse melanoma B16F10 cells (Figure S2F–H) demonstrating that this is a non species-specific general phenomenon. Thus, XeB generates similar bioenergetic crises in tumorigenic and non-tumorigenic cell lines. XeB inhibited constitutive and spontaneous Ca2+ transients in both MCF10A and MCF7 cells (Figure 1D, Figure S1G and Supplemental Video 1 (MCF7) and Supplemental Video 2 (MCF10A)). Furthermore, simultaneous genetic knock-down (KD) of types 1 and 3 InsP3R (~50–70% efficiency; Figure S1H), the main isoforms expressed in these cells (Figure S1I–K) created a similar bioenergetic crisis in normal and tumorigenic cells (Figure 1E and F).
Figure 1. Inhibition of InsP3R Activity Reduces Oxygen Consumption and Activates AMPK-dependent Autophagy.

(A) Basal and maximal oxygen consumption rate (OCR) of non-tumorigenic and tumorigenic breast cell lines incubated with 5 μM XeB for 1h. N=3, mean ± S.E., *p<0.05, **p<0.01 (t-test).
(B) Representative Western blots of phosphorylated (P-AMPK) and total AMPK in non-tumorigenic and tumorigenic breast cell lines incubated with 5 μM XeB for 1h. Bar graph: P-AMPK/AMPK expressed as average fold increase over basal levels (control cells). N=5, mean ± S.E., **p<0.01, ***p<0.001 (t-test).
(C) Representative Westerns blots of autophagy marker LC3 or tubulin as loading control in non-tumorigenic and tumorigenic breast cell lines treated with 5 μM XeB (1h) and quantification of LC3-II/tubulin expressed as fold increase over basal levels (control cells). N=5, mean ± S.E., **p< 0.01. ***p<0.001 (t-test).
(D) Representative fluorescence recordings of Ca2+ release events in unstimulated MCF7 and MCF10A cells treated or not with 5 μM XeB. See also Supplemental Videos 1 and 2.
(E) Representative Western blots of AMPK in breast lines transiently transfected with a siRNA against both types 1 and type 3 InsP3R (KD) or non-target scrambled (S) siRNA for 24h. Bar graph: P-AMPK/AMPK expressed as average fold increase over basal levels (NT cells). N=3, mean ± S.E, *p<0.05, **p<0.01 (t test).
(F) Representative Western blots of LC3 or tubulin in breast cells transiently transfected with a siRNA against types 1 and 3 InsP3R (KD) or a non-target (S) siRNA for 24h and quantification of LC3-II/tubulin expressed as average fold increase over basal levels (NT cells). N=3, mean ± S.E, ***p<0.001 (t-test). See also Figure S1.
Inhibition of InsP3R Activity Is Toxic Specifically for Tumorigenic Cells
Breast cells were treated with XeB for 24 h and cell viability assessed by flow cytometry. 2.5 μM XeB had little effect, except for tumorigenic HS578T cells in which death was enhanced by 8 ± 1% (Figure 2A). In contrast, 5 μM XeB induced substantial death by 43 ± 4% and 53 ± 2% in tumorigenic MCF7 and T47D cell lines, respectively, and over 22 ± 1% in HS578T cells. In contrast, non-tumorigenic MCF10A cells showed only limited sensitivity (5 ± 0.4% cell death). At 10 μM, XeB killed 63 ± 7% and 64 ± 5% of MCF7 and T47D cells, respectively, and 42 ± 6 % of HS578T cells, whereas MCF10A cells had only modest sensitivity (24 ± 1%) (Figure 2A). Similar XeB-mediated killing was observed in human cancer-derived prostate cell lines PC3 and DU145, whereas the non-tumorigenic PNT2 prostate line was little affected (Figure S2C). In agreement with results from flow cytometry, XeB caused striking LDH release in all tumorigenic breast lines compared with MCF10A cells (Figure 2B), as well as in mouse melanoma B16F10 cells (Figure S2I). As assessed by both flow cytometry and LDH release (Figure 2C and D), tumorigenic lines started dying as early as 6 h of exposure 5 μM XeB, while the non-tumorigenic cells remained insensitive. The observed differences in XeB sensitivity could not be accounted for intrinsic differences in proliferation rates between cell lines in untreated conditions (Figure S1L and Figure S2E). Tumorigenic breast (Figure 2E) and prostate (Figure S1D) cells exposed to XeB (5 μM for 24 h) displayed striking morphological changes, including rounding up and shrinkage, whereas similarly treated non-tumorigenic cells maintained normal morphology.
Figure 2. Inhibition of InsP3R Causes Death of Tumorigenic Breast Cell Lines.

(A) Non-tumorigenic and tumorigenic human breast cell lines were treated with XeB for 24h and cell death determined by TOTO-3 incorporation by flow cytometry. N=3, mean ± S.E, *** p<0.001, NS: not significant (one-way analysis of variance followed by Dunnett’s multiple comparison post-test).
(B) Breast cell lines were treated with 5 μM XeB for 24h and cell death determined by LDH release. N=3, mean ± S.E, *p<0.05, ***p<0.001 (t-test).
(C) Time course of cell death determined by TOTO-3 incorporation by flow cytometry in human breast cell lines treated with 5 μM XeB. N=3, mean ± S.E, * p<0.05, *** p<0.001 (t-test).
(D) Time course of cell death determined by LDH release in breast cell lines treated with 5 μM XeB. N=3, mean ± S.E, *p<0.05, ***p<0.001 (t-test).
(E) DIC images of breast cell lines derived from non-tumorigenic (MCF10A) or tumorigenic (MCF7, T47D, HS578T) human tissue treated with 5 μM XeB for 24h. Bar: 10 μm. N = 3.
(F) Non-tumorigenic and tumorigenic breast cell lines were treated with 2 μM of the PLC inhibitor U73122 or its inactive analog U73343 for 12h and cell death determined by LDH release. N=3, mean ± S.E., ***p<0.001, NS: not significant (t -test).
(G) Cell death (LDH release) in human breast cell lines transiently transfected with a siRNA against type 1 and type 3 InsP3R (KD) or a scrambled non-target (S) siRNA for 24h. N=3, mean ± S.E., ***p<0.001, NS: non significant (t-test). See also Figure S1.
These results suggest that tumor cell survival is dependent upon InsP3R signaling. In agreement, inhibition of phospholipase C (PLC), the enzyme responsible for the generation of the InsP3R ligand InsP3, with U73122 (2 μM), but not the inactive analog U73343, caused striking LDH release in all tumorigenic breast cell lines, with substantially less effects in the non-tumorigenic line (Figure 2F). Similarly, simultaneous genetic KD of types 1 and 3 InsP3R caused comparable LDH release as XeB and U73122 in MCF7 and T47D cells, while non-tumorigenic MCF10A cells showed only a small increase (Figure 2G). Thus, tumorigenic cell lines appear to have an essential dependence on InsP3R-mediated Ca2+ signaling for survival, unlike normal cells.
Inhibition of InsP3R Activity Reduces the Proliferative Potential of Cancer Cell Lines
Colony formation is a hallmark of cancer cells that reflects their ability to proliferate indefinitely (Munshi et al., 2005). XeB (5 μM, 24h) diminished colony formation by tumorigenic breast MCF7 (Figure 3A) and T47D cells and prostate PC3 cells (Figure S3A and S3B). In normal cells, the bioenergetic crisis caused by inhibition of InsP3R activity could be overcome by providing pyruvate as a mitochondrial substrate, presumably by mass action to drive flux through the system (Cardenas et al., 2010). Methyl-pyruvate (5 μM, 24 h) rescued the XeB-induced MCF7 colony formation defect (Figure 3B). Pyruvate has antioxidant properties (Andrae et al., 1985). However, XeB did not enhance ROS production (Figure S3C) and N-acetylcysteine (NAC) (5 mM, 24 h) did not rescue colony formation (Figure 3B), nor prevent XeB-induced AMPK activation (Figure S3D), autophagy (Figure S3E) or MCF7 cell death (Figure S3F). These results suggest that cancer cell killing and reduction of colony formation by inhibition of InsP3R activity is a consequence of a bioenergetic crisis that can be rescued by a mitochondrial substrate but not by an antioxidant.
Figure 3. Inhibition of InsP3R Signaling Impairs Colony Formation in the MCF7 Tumorigenic Breast Cell Line.

(A) Representative plates of MCF7 cells treated with 5 μM XeB or vehicle (top) and quantitative analysis of colony numbers (bottom). N=3, mean ± S.E, ***p<0.001 (t-test).
(B) Representative plates of MCF7 cells treated with 5 μM XeB, 5 mM methyl-pyruvate, 5 μM XeB plus 5 mM methyl-pyruvate or 5 μM XeB plus 5 mM n-acetylcysteine (NAC) (top) and quantitative analysis of colony numbers (bottom). N=3, mean ± S.E., ***p<0.001, **p<0.001, NS: not significant (t-test). See also Figure S2.
XeB Induces Cell Death in Transformed But Not Isogenic Control Human Fibroblasts
Although the cell lines are well-validated and broadly used models, the fact that the control lines are also transformed complicates the results. We therefore turned to an isogenic primary human fibroblast model. Primary human fibroblasts were transformed by incorporation of oncogenic HRasG12V while bypassing retinoblastoma (Rb)-mediated G1 cell cycle restraint by enforced expression of cyclin-dependent kinase-4 (Cdk4) (Ridky et al., 2010). This model (HrasG12V-CDK4) has classic cancer features, including invasive properties. HrasG12V-CDK4 fibroblasts showed elevated glucose consumption (Figure S3G) and lactate release (Figure S3H), consistent with acquisition of a Warburg-type metabolism. Nevertheless, control and transformed cells had comparable OCR, suggesting similar OXPHOS (Figure 4A). Furthermore, OCR was reduced by XeB to a similar extent in HrasG12V-CDK4 and isogenic control cells (Figure 4A), and a bioenergetic crisis ensued, as evidenced by increased P-AMPK and induction of autophagy (Figure 4B and 4C). These results suggest that mitochondria remain important for maintenance of cell bioenergetics in these primary transformed cells.
Figure 4. Pharmacological and Genetic Inhibition of InsP3R Causes Death of Primary HRasG12V-Cdk4 Transformed Human Fibroblasts.

(A) Upper: representative traces of OCR in normal (black) or transformed (red) fibroblasts treated (●,▼) or not (■, ▲) with 5 μM XeB for 1h. a: injection of 1 μM oligomycin; b: 300 nM FCCP; c: 100 nM rotenone. Bottom, summary of basal and maximal OCR in fibroblasts treated or not with 5 μM XeB for 1h. N=3, mean ± S.E., ***p< 0.001.
(B) Representative Western blots of AMPK in normal (N) and transformed (T) fibroblasts treated with 5 μM XeB (1h). Bar graph: P-AMPK/AMPK expressed as average fold increase over basal levels (control cells). N=6, mean ± S.E., ***p<0.001 (t-test).
(C) Representative Western blots of LC3 and tubulin in normal (N) and transformed (T) fibroblasts treated with 5 μM XeB for 1h. Bar graph: LC3-II/tubulin expressed as average fold increase over basal levels (control cells). N=6, mean ± S.E., ***p<0.001 (t-test).
(D) Determination of cell death by LDH release in normal and transformed fibroblasts treated with 2.5 or 5 μM XeB (24h). N=3, mean ± S.E., ***p<0.001, NS: not significant (t-test).
(E) Representative Western blots AMPK in normal (N) and transformed (T) fibroblasts transiently transfected with a siRNA against type 1 and type 3 InsP3R for 24h or siRNA against MCU for 72h. Bar graph: P-AMPK/AMPK expressed as the average fold increase over basal levels (NT cells). N=3, mean ± S.E., ***p<0.001 (t-test).
(F) Representative Western blots of LC3 and tubulin in normal (N) and transformed (T) fibroblasts transiently transfected with a siRNA against types 1 and 3 InsP3R for 24h or siRNA against MCU for 72h, or scrambled sRNAs (S); LC3-II/tubulin expressed as average fold increase over basal levels (S cells). N=3, mean ± S.E., ***p<0.001 (t-test).
(G) Determination of cell death by LDH release in normal and transformed fibroblasts transiently transfected with a siRNA against types 1 and 3 InsP3R for 24h or siRNA against MCU for 72h. N=3, mean ± S.E., *p<0.05, **p<0.01, ***p<0.001 (t-test).
(H) Determination of cell death by LDH release in normal and transformed fibroblasts treated simultaneously with 5 μM XeB and either 5 mM methyl-pyruvate (Pyr) or 5 mM dimethyl alpha-ketoglutarate (Keto) for 24h. N=3, mean ± S.E., *p<0.05, **p<0.01, ***p<0.001, NS: non significant (t-test). See also Figure S4.
As in the cancer cell lines, XeB induced profound morphological changes and reduced the number of HrasG12V-CDK4 cells per field, whereas isogenic controls behaved similarly to vehicle-treated cells (Figure S3I). LDH release was enhanced 6-fold in HrasG12V-CDK4 cells compared with isogenic controls (Figure 4D). The sensitivity of HrasG12V-CDK4 cells compared with isogenic cells could not be accounted for by differences in their normal rates of proliferation (Figure S3J). Simultaneous KD of types 1 and 3 InsP3R, the main isoforms in these cells (Figure S4A–D,) enhanced P-AMPK and autophagy in both HrasG12V-CDK4 and isogenic control fibroblasts (Figure 4E and 4F), but it caused significant death specifically in the HrasG12V-CDK4 cells (Figure 4G). Thus, in primary human cells, as in breast and prostate cell lines, inhibition of InsP3R activity is strongly toxic specifically for cancer cells.
Killing of Cancer Cells by Inhibition of InsP3R Activity is Mediated by Altered Mitochondrial Function
In normal cells, inhibition of mitochondrial Ca2+ uptake phenocopies effects of InsP3R inhibition on cell bioenergetics, suggesting that the primary role of InsP3R activity in preserving normal cellular bioenergetics is to provide Ca2+ to mitochondria (Mallilankaraman et al., 2012a). The similar bioenergetic responses to inhibition of InsP3R activity of tumor cell lines and HrasG12V-CDK4 cells suggested that cancer cells may have a similar dependence on constitutive mitochondrial Ca2+ uptake. To test this, we knocked down in HrasG12V-CDK4 and isogenic control cells the expression of MCU, the pore forming subunit of the mitochondrial uniporter Ca2+ channel, the major Ca2+ uptake pathway in mitochondria (Foskett and Philipson, 2015). MCU expression was similar in human normal versus transformed fibroblasts or between the MCF10A and MCF7 cells (Figure S4E and 4F). MCU knockdown (Figure S4E) increased P-AMPK and induced autophagy (Figure 4E and 4F), as in normal cells (Mallilankaraman et al., 2012a; Mallilankaraman et al., 2012b). Importantly, MCU KD enhanced killing preferentially of the HrasG12V-CDK4 transformed cells (Figure 4G). In contrast, overexpression of MCU was unable to protect MCF7 cells from death induced by InsP3R inhibition with XeB (Figure S4G and S4H). These results suggest that InsP3R-mediated Ca2+ release and its transfer to mitochondria through MCU is essential to maintain cancer cell viability.
The TCA cycle is regulated by product inhibition, substrate availability and cofactors including Ca2+. PDH, ICD and α-KGDH activities are all critically regulated by mitochondrial matrix Ca2+ (Glancy and Balaban, 2012). Inhibition of InsP3R-mediated Ca2+ release reduces PDH activity, resulting in decreased OCR and ATP production (Cardenas et al., 2010). Cancer cells rely on mitochondria for production TCA intermediates needed for high growth and proliferation (Boroughs and DeBerardinis, 2015). We speculated that inhibition of mitochondrial function by absence of sufficient matrix Ca2+ cannot be compensated for specifically in cancer cells because of this dependence on the TCA cycle. Addition of dimethyl-α-ketoglutarate or methyl-pyruvate, two substrates that energize mitochondria (Cardenas et al., 2010; Wise and Thompson, 2010) to XeB treated (5 μM, 24 h) fibroblasts strongly reduced cell death (Figure 4H). Protection was unrelated to antioxidant properties of the substrates since NAC (5 mM) was without effect on XeB-induced P-AMPK (Figure S4I and 4K), autophagy (Figure S4J and 4L) or killing (Figure S4M).
Although enhanced P-AMPK indicates that inhibition of InsP3R-mediated Ca2+ transfer to mitochondria lowers cellular ATP (Cardenas et al., 2010), glycolysis is believed to provide sufficient ATP for cancer cell functions (Deberardinis et al., 2008). However, as highly proliferative cells, cancer cells rely on the TCA cycle for production of metabolic intermediates for generation of fatty acids and nucleotides. At least three mitochondrial pathways are involved in pyrimidine and purine nucleotides synthesis, and the rate-limiting step in de novo synthesis of pyrimidines occurs in mitochondria and is linked to respiratory chain activity (Desler et al., 2010). To determine if mitochondrial hypo-function in response to InsP3R inhibition compromises nucleotide metabolism that may contribute to cancer cell death, HrasG12V-CDK4 fibroblasts were treated with 5 μM XeB for 24 h in media supplemented with nucleosides. Notably, nucleoside supplementation was strongly protective of XeB-treated HrasG12V-CDK4 cells (Figure 5A) despite enhanced P-AMPK phosphorylation and autophagy activation (Figure 5B – 5E). Thus, with nucleoside supplementation, cancer cells behave as normal cells, surviving in the face of an unfavorable bioenergetic state.
Figure 5. Nucleoside Rescue of Cancer Cell Killing and Cell Cycle Defects by Inhibition of InsP3R Activity.

(A) Normal and transformed fibroblasts were treated with 5 μM XeB in absence or presence of nucleosides (NUC) for 24h and cell death determined by LDH release. N=3, mean ± S.E., **p<0.01 (t-test).
(B) Representative Western blots of AMPK in normal fibroblasts treated with 5 μM XeB for 1h in presence or absence of NUC. Bar graph: P-AMPK/AMPK expressed as average fold increase over basal levels (control cells). N=3, mean ± S.E., ***p<0.001, NS: not significant (t-test).
(C) As in (B), using transformed fibroblasts. N=3, mean ± S.E., ***p<0.001, NS: not significant (t-test).
(D) Representative Western blots of LC3 and tubulin in normal fibroblasts treated with 5 μM XeB for 1h in presence or absence of NUC. Bar graph: LC3-II/tubulin expressed as average fold increase over basal levels (control cells). N=3, mean ± S.E., ***p<0.001, NS: not significant (t-test).
(E) As in (D), using transformed fibroblasts. N=3, mean ± S.E., ***p<0.001 (t- test).
(F) BrdU incorporation in normal fibroblasts treated with 5 μM XeB for 12h. Top: BrdU immunofluorescence. Bottom: BrdU labeling expressed as percent of control. N=3, mean ± S.E., ***p<0.001 (t-test).
(G) As in (F), using transformed fibroblasts. N=3, mean ± S.E., *p<0.05 (t-test).
(H) Cell cycle profile determined by flow cytometry in MCF10A cells treated or not with 5 μM XeB for 24h, showing percent of cells in each phase. N=3. **p<0.001, NS: not significant.
(I) Cell cycle profile in MCF7 cells treated or not with 5 μM XeB for 24h, showing percentage of cells in each phase. N=3. *p<0.05, NS: not significant.
(J) As in (I), using HeLa cells. N=3. NS: not significant.
(K) Cell death determined by propidium iodide incorporation by flow cytometry of MCF7 cells treated or not with 5 μM XeB for 24h after a 48h treatment with 400 μM hydroxyurea (HU). **p<0.001 (t-test).
(L) DIC images of HeLa cells loaded with 8 nM TMRE. XeB (5 μM) added at time 0h0′; images collected at indicated times. Arrow shows dividing cell. Bar: 10 μm. See also Supplemental Video 3.
Nucleosides contribute to purine and pyrimidine generation necessary for DNA synthesis. In normal fibroblasts, XeB (5 μM, 10 h) reduced bromodeoxyuridine (BrdU) incorporation by >50% (Figure 5F), suggesting that the unfavorable bioenergetic state in the absence of Ca2+ transfer to mitochondria slowed cell proliferation, as expected. In marked contrast, XeB had minimal effects on BrdU incorporation into HrasG12V-CDK4 cells (Figure 5G). These results suggest that normal cells restrain entry into S-phase when conditions are unsuitable, but transformed cells do not recognize this checkpoint. Because of the enforced expression of Cdk4 in HrasG12V-CDK4 cells, it remained unclear whether other cancer cells would progress similarly into mitosis during a XeB-induced compromised bioenergetic state. XeB (5 μM, 24 h) increased the population of MCF10A cells in G1 that correlated with a decrease proceeding through S-phase (Figure 5H), as observed in normal human primary fibroblasts. In contrast, MCF7 cells showed no increase of the G1 population and only a slight decrease in cells in S-phase (Figure 5I). This suggests that MCF7 cells, like HrasG12V-CDK4 cells but unlike normal cells, proceed through the cell cycle despite their compromised bioenergetic state. Similar behavior was observed in HeLa cells, a common cervical tumor cell line (Figure 5J).
HeLa cells were optically imaged to observe progression through the cell cycle. Remarkably, XeB-treated cells entered mitosis but then collapsed catastrophically and died during daughter cell separation (n = 30 mitoses) (Figure 5L and Supplemental Video 3), a phenotype never observed in vehicle-treated cells (n = 50 mitoses). This suggests that in cells with InsP3R activity inhibited or mitochondrial Ca2+ uptake otherwise blocked, cancer cells progress through the cell cycle despite their bioenergetic crisis, in contrast to normal cells that stop in G1, and their progression into mitosis appears to be a step that results in cell death. To probe this further, MCF7 cells were incubated with 400 μM hydroxyurea (HU) to arrest them in S phase of the cell cycle (Figure S5A), and then treated with 5 μM XeB for 24 h. As shown in Figure 5K, prevention of cell cycle progression strongly decreased cell death induced by XeB.
Cell Death Induced by Inhibition of InsP3R Ca2+ Signaling is Mainly Necrotic
Our results reveal that inhibition of InsP3R-mediated Ca2+ transfer to mitochondria causes death specifically in tumorigenic cells, but how they die is unknown. Autophagy inhibition with 3-methyladenine (3MA) (Figure S5B and S5C) did not prevent cell death in XeB-treated MCF7 and MCF10A cells (Figure 6A) and normal and HrasG12V-CDK4 fibroblasts (Figure 6B), suggesting that autophagy is not driving cell death. Although 3MA tended to increase cell death in XeB-treated MCF10A cells and normal fibroblasts, suggesting that autophagy plays a cell survival role, as previously suggested (Cardenas et al., 2010), knockdown of ATG7 (Figure S5D and 5E) did not influence the extent of cell death (Figure S5F). Inhibition of apoptosis with the pan-caspase inhibitor Z-VAD-FMK did not protect tumorigenic cells from XeB-induced death (Figure 6A and 6B). Furthermore, western blot and immunofluorescence analyses of activated cleaved caspase 3 in human normal and HrasG12V-CDK4 fibroblasts (Figure S5G) and in tumor samples (Figure S5H) similarly suggested that apoptosis is not a major feature associated with cell killing. Flow cytometry analyses using FITC-AnnexinV and propidium iodide (PI) labeling further confirmed the presence of only a small apoptotic cell population after XeB treatment (Figure S5I). Inhibition of necroptosis with necrostatin also did not prevent XeB-induced cell death (Figure 6A and 6B). The transcription factor HMGB1 is normally localized in the nucleus but is released into the cytoplasm during early stages of necrosis (Scaffidi et al., 2002). Most (>50%) MCF7 cells exposed to 5 μM XeB for 24 h lost nuclear labeling, while untreated cells and treated MCF10A cells overwhelmingly maintained nuclear HMGB1 label (Figure 6C and 6D). Together with the imaging data, these results suggest that in response to inhibition of Ca2+ transfer to mitochondria, cancer cells die by necrosis, at approximately the time of daughter cell separation in mitosis.
Figure 6. Inhibition of InsP3R Activity Kills Cancer Cells by Necrosis but Not by Autophagy, Apoptosis or Necroptosis.

(A) Non-tumorigenic (MCF10A) and tumorigenic (MCF7) breast cell lines were treated with 5 μM XeB for 24h in presence or absence of the apoptosis inhibitor Z-VAD-FMK (20 μM), autophagy inhibitor 3-MA (10 mM) or necroptosis inhibitor nec-1 (20 μM) and cell death determined by LDH release. N=3, mean ± S.E., NS: not significant (t-test).
(B) As in (A) for normal and transformed primary human fibroblasts. N=3, mean ± S.E., NS: not significant (t-test).
(C) HMGB1 immunofluorescence in MCF7 and MCF10A cells treated with 5 μM XeB or vehicle for 24h. Note that most nuclear label is absent in treated MCF7 cells. Bar: 10 μm.
(D) Quantification of loss of nuclear HMGB1 expressed as percent increase over control. N=3, mean ± S.E., ***p<0.001 (t-test).
Inhibition of InsP3R Activity Impairs Tumor Growth in Nude Mice
To evaluate whether InsP3R inhibition affected tumor growth in vivo, subcutaneous tumors were generated using B16F10 melanoma cells. As described earlier, treatment of B16F10 cells in vitro with 5 μM XeB induced AMPK phosphorylation and activated autophagy (Figure S2F and S2G). OCR was inhibited (Figure S2H) and LDH release was increased in a dose-dependent manner by a 24 h exposure to XeB (Figure S2I). Thus, this cell line is appropriate to examine in vivo. B16F10 cells were injected subcutaneously into ventral flanks of 5–6 wk old nu/nu mice. When tumors were palpable, usually by day 5 post-injection, one tumoral flank was injected with 100 μl of a solution of 100 μM XeB and the other with vehicle (PBS + ethanol). One day later, mice were euthanized and tumors were extracted and weighed (Figure S6A, treatment 1). XeB reduced tumor size by nearly 60% compared with untreated tumors (Figure 7A). In a different paradigm, one tumoral flank was treated every other day for a week with 100 μl of a solution of 100 μM XeB (Figure S6A, treatment 2). XeB reduced tumor size by ~70% compared with untreated tumors (Figure 7B). Markers of bioenergetic stress normally observed after InsP3R inhibition, including enhanced AMPK phosphorylation and autophagy, were observed in the XeB-injected tumor sections (Figure S6B and S6C). The vast majority of XeB-treated tumor cells lost HMGB1 nuclear localization, whereas control tumor cells had HMGB1 largely in the nucleus (Figure 7C). Ki67, a marker of cell proliferation, labeled nuclei equivalently in both XeB- and vehicle-treated tumors (Figure 7D), consistent with the idea that tumor cells remain committed to enter the cell cycle even when in a state of compromised bioenergetics caused by inhibition of InsP3R activity.
Figure 7. Inhibition of InsP3R Retards Tumor Growth In Vivo.

Tumors were generated by subcutaneous injection of murine melanoma-derived B16F10 cells into nude mice.
(A) Tumor weight in mice with tumors injected with 100 μl of a 100 μM XeB solution 1d before euthanization. N=9, mean ± S.E., *p<0.05 (t-test).
(B) Tumor weight in mice with tumors injected with 100 μl of a 100 μM XeB solution or vehicle every other day for 6d before euthanization. N=9, mean ± S.E., *p<0.05 (t-test).
(C) HMGB1 immunofluorescence in tumors injected or not with 100 μl of a 100 μM XeB solution 1d before euthanization. Control tumor shows strong nuclear labeling (arrows) while in XeB-treated tumor the nuclei appear empty (arrows) with remaining labeling cytosolic or extracellular. N = 3. Bar: 100 μm.
(D) Ki67 immunofluorescence in tumors injected or not with 100 μl of a 100 μM XeB solution 1d before euthanization. Left: panoramic view of control and XeB-treated tumors. Bar: 100 μm. Right: detail of control and XeB-treated tumors. Bar: 10 μm. N = 3. See also Figure S6.
DISCUSSION
The main result of the present study is the demonstration of a unique requirement of tumorigenic cancer cells for constitutive ER-to-mitochondria Ca2+ transfer for their survival. In the absence of this transfer, either as a consequence of blocking InsP3R-mediated Ca2+ release or blocking mitochondrial Ca2+ uptake, all tumor cells examined experienced a bioenergetic crisis similar to normal cells, but activation of autophagy, which enabled normal cells to survive, was insufficient, and the tumor cells died by necrosis as they proceeded through mitosis. Specific cancer cell killing was observed in human tumorigenic cell lines derived from breast, prostate, cervix (HeLa), as well as, in data not shown, bone (143B), colon (SW480 and Colo320), kidney (RCCC), skin (WM3918, A231 and WM239a, B16F10) and brain (T98G) cancers. In addition, the same effect was observed in isogenic primary human fibroblasts transformed by expression of oncogenic Ras and enforced expression of Cdk4, a relevant combination found in spontaneous human cancers (Ridky et al., 2010). Furthermore, inhibition of InsP3R activity had strong anti-tumor efficacy in vivo.
Increased InsP3R expression and/or activity has been associated with cancer cell proliferation, growth, survival and migration (Davis et al., 2013; Kang et al., 2010; Messai et al., 2014; Shibao et al., 2010; Szatkowski et al., 2010). Furthermore, MCU is highly expressed in ER-negative and basal-like breast cancers (Sorlie et al., 2006). Our results suggest that the fatal fate of cancer cells after InsP3R inhibition is a result of mitochondrial dysfunction, but it is independent of apoptotic mechanisms but rather appears linked to metabolic defects. Constitutive InsP3R-mediated Ca2+ release is essential to support activity of PDH, a key enzyme the controls flux of carbon into the TCA cycle, through Ca2+ activated PDH phosphatase activity. Consequently, diminished TCA production of NADH leads to lower rates of OXPHOS and ATP levels decline (Cardenas et al., 2010). It is now recognized that most cancer cells rely on mitochondrial metabolism and use a significant fraction of glucose-derived pyruvate for ATP generation and for anaplerotic reactions to replenish TCA cycle precursors for macromolecular biosynthesis (Ahn and Metallo, 2015; Jose et al., 2011; Koppenol et al., 2011; Moreno-Sanchez et al., 2007; Porporato et al., 2014). OXPHOS is important for ATP production in many cancers (see (Vander Heiden, 2013)). Pancreatic cancer (Viale et al., 2014) and leukaemic (Lagadinou et al., 2013; Nakada et al., 2010; Shi et al., 2012; Skrtic et al., 2011; Yang et al., 2011) stem cells, diffuse large B cell tumors (Caro et al., 2012) and primary glioblastoma sphere cultures (Janiszewska et al., 2012) rely on OXPHOS for survival. Primary human glioblastomas oxidize glucose via PDH and the TCA cycle during aggressive tumor growth (Marin-Valencia et al., 2012). Inhibition of complex 1 inhibits respiration and human cancer cell growth (Wheaton et al., 2014). The TCA cycle is also critically important in cancer cells for generation of biochemical intermediates to sustain high rates of proliferation (Deberardinis et al., 2008). Most cancer cells derive lipogenic acetyl-CoA from pyruvate through Ca2+-dependent PDH (Hatzivassiliou et al., 2005; Metallo et al., 2012), and activation of PDH can promote cancer cell senescence (Kaplon et al., 2013). Some cancers have defective OXPHOS but nevertheless rely on the TCA cycle (Mullen et al., 2014; Mullen et al., 2012). Even in cancer cells with mutations in the TCA cycle, turnover of TCA cycle intermediates is maintained (Mullen et al., 2012). Most cancer cells use PDH as well as glutamine to fuel the TCA cycle (DeBerardinis et al., 2007), where it enters and then cycles through α-KGDH as the first step (Mullen et al., 2014). Importantly, α-KGDH activity is strongly Ca2+ dependent (Armstrong et al., 2014), with apparent affinity similar to that of PDH phosphatase, suggesting that it may also be reduced by interruption of ER-to-mitochondria Ca2+ transfer. Reductive carboxylation of α-KG is observed in many cancer cells with impaired OXPHOS where it maintains levels of biosynthetic intermediates. Notably, reductive carboxylation of α-KG requires its oxidation by Ca2+-dependent α-KGDH (Mullen et al., 2014). Furthermore, reduction of α-KG to isocitrate is mediated by ICD, the other Ca2+ dependent enzyme in the TCA cycle. It is of interest that nucleotide supplementation prevented cancer cell death. α-ketoglutarate is a precursor for glutamine and aspartate necessary for pyrimidine synthesis that requires mitochondrial dihydrooroate, which in turns requires flux through the electron transport chain (Grassian et al., 2014; Mullen et al., 2014). Together, these data suggest that cancer cells, by virtue of their reliance on OXPHOS and the TCA cycle for their viability, have a fundamental reliance on ER-to-mitochondria Ca2+ transfer via activation of Ca2+ dependent dehydrogenases that fuel key steps in the TCA cycle and OXPHOS.
Normal cells also rely on OXPHOS and the TCA cycle but unlike the cancer cells examined, interruption of constitutive ER-to-mitochondria Ca2+ transfer had little effect on their viability, in agreement with previous observations (Cardenas et al., 2010). Normal cells activate autophagy as a pro-survival mechanism under these conditions. The tumor cells also activated autophagy, and its inhibition tended to accelerate their cell death. What then distinguishes tumorigenic cells from non-tumorigenic cells that leads to mitochondrial Ca2+ addiction specifically in cancer cells? Inhibition of mitochondrial Ca2+ uptake in non-tumorigenic cells slowed proliferation, whereas it didn’t in the tumor cell lines. InsP3-mediated Ca2+ signaling is important in cell cycle progression (Ciapa et al., 1994; Han et al., 1992; Miller et al., 1993; Resende et al., 2010). Conversely, its inhibition activates AMPK (Cardenas et al., 2010) and present study) which can phosphorylate and activate p53 to induce p21waf1/cip1-mediated cell cycle arrest (Jones et al., 2005). In contrast, proliferation of the tumor cells examined here was not slowed by inhibition of InsP3-mediated Ca2+ signaling. MCF7 and HeLa cells have mutations in Cdk9 and Cdkn2 (http://lincs.hms.harvard.edu/) that may enable them to by-pass Ca2+ regulated checkpoints. The human fibroblasts we used were transformed by introducing a constitutively active Cdk4 that phosphorylates Rb independent of Ca2+ signaling. Whereas several of the cancer cell lines have mutated p53 that could explain lack of cell cycle arrest in response to AMPK activation by InsP3R inhibition, we examined a broad collection of cell lines with normal and mutated p53 (http://p53.free.fr/index.html) and they all displayed uninhibited cell cycle progression. Indeed, MCF7 and HeLa cells and transformed human fibroblasts that were used for most of our studies express wild-type p53. Although AMPK can suppress the mTOR pathway which plays a role in coordinating cell growth and the cell cycle (Cuyas et al., 2014), AMPK activation induced by InsP3R inhibition does not affect mTOR activity (Cardenas et al., 2010). Thus, it remains unclear why proliferation was not reduced in tumorigenic cells in response to inhibition of InsP3R activity. Importantly, progression into mitosis resulted in catastrophic cell death during cytokinesis of all the tumor cells examined. Necrosis as the mechanism of cell death was confirmed by biochemical and histological markers in the cell lines, primary cells and solid tumors. In contrast, neither apoptosis, autophagy nor necroptosis appeared to play significant roles. The mechanisms that lead to mitotic catastrophic cell death (Vitale et al., 2011) around the time of cytokinesis remain to be determined. Interactions of the cyclin-dependent kinase substrate CP110 with Ca2+ binding proteins calmodulin or centrin is essential for correct cytokinesis. Whereas presence of a CP110 mutant unable to bind CaM induces cytokinesis failure and multinucleated cells (Tsang et al., 2006), it is possible that cytokinesis failure in the face of a bioenergetic crisis results instead in necrotic mitotic catastrophe. The failure of the tumorigenic cells to slow cell proliferation despite the fact that they were in an energetically-compromised state appears to be the major mechanism that distinguishes them from non-tumorigenic cells and accounts for their susceptibility to cell killing.
In conclusion, using a variety of different tumorigenic cell lines and isogenic primary transformed human fibroblasts, we have demonstrated that constitutive transfer of InsP3R-mediated Ca2+ transfer to mitochondria is essential to maintain the viability of cancer cells. In the absence of this signal, normal cells restrict their entry into the cell cycle, whereas cancer cells bypass the Ca2+ checkpoints and undergo a catastrophic necrotic collapse during cytokinesis. Our results reveal a unique mitochondrial addiction to Ca2+ and a susceptibility of cancer cells that may have therapeutic implications.
EXPERIMENTAL PROCEDURES
Reagents
Antibodies
From Cell Signaling Technology: Phospho-α1-AMPK (Thr172), α1-AMPK, LC3B, HMBG1, ATG7, caspase 3. From BD Laboratories: β-tubulin, InsP3R3. From Sigma: MCU. InsP3R1 antibody: Dr. R.W. Neumar (University of Michigan, USA). Secondary antibodies conjugated with peroxidase from Amersham (Piscataway, NJ).
Chemicals
3-methyladenine, methyl-pyruvate, dimethyl 2-oxoglutarate, FCCP, oligomycin, rotenone and Hanks’ balanced salt solution were purchased from Sigma. Z-VAD-FMK and necrostatin-1 were from TOCRIS Biosciences. U73122 and U73343 were from Calbiochem. TOTO-3, DAPI, cleaved caspase 3 conjugated with FITC and secondary antibodies conjugated with Alexa 488 were from Molecular Probes. Xestospongin B was extracted and purified from the marine sponge Xestospongia exigua as described (Cardenas et al., 2005).
Cell Culture and Transfection
Details regarding cell culture and transfection are available in Supplementary Information.
Western Blotting and Treatments
Details of Western blotting and cell treatments are available in Supplementary Information.
Microscopy
Details of microscopy are available in Supplementary Information.
Oxygen Consumption
Oxygen consumption rate (OCR) was measured at 37°C using an XF24 extracellular analyzer (Seahorse Bioscience). Details provided in Supplementary Information.
Clonogenic Assay
Colony formation was assayed as described (Franken et al., 2006), with details provided in Supplementary Information.
Cell Cycle Analysis
Details provided in Supplementary Information.
Cell Death
Cell death was determined by LDH activity release by a colorimetric assay according to the manufacturer’s instructions (Roche) and by Propidium Iodide (PI, final concentration 2.5 μg/ml) exclusion by flow cytometry (FACS Canto, BD Biosciences, San Jose, CA, USA).
Mouse Tumor Generation and Histochemistry
All in vivo experiments were conducted with approval of the Institutional Animal Care and Use Committee. Murine melanoma derived B16F10 cells (1 × 10⁵ cells) were subcutaneously injected into flanks of immunodeficient mice and after 1 wk visible tumors were observed. Tumors of one flank were injected with 100 μl of a 100 μM XeB solution and those on the contralateral side were left untreated or injected 1% EtOH in PBS. Mice were euthanized after 1 d or 6 d treatment with XeB and tumors extracted, weighed and processed for immunohistochemistry.
Lactate Measurements
Cell lactate was measured colorometrically (Abcam) according to the manufacturer’s instructions.
Glucose Uptake
Fibroblasts were washed with Krebs-BSA buffer, pre-incubated or not with cytochalasin B (10 min) and incubated for 10 min at 37°C with 10 mM 3H-2-deoxyglucose. The reaction was stopped by placing it on ice, the samples were spun, decanted, lysed in 1% triton x-100 and cell 3H quantified.
Analysis and Statistics
All data summarized as mean ± SEM; significance of differences was assessed using unpaired t-tests. Differences were accepted as significant at the 95% level (p < 0.05).
Supplementary Material
Highlights.
Low-level endoplasmic reticulum-to-mitochondria Ca2+ flux maintains ATP levels in cells
Absence of basal mitochondrial Ca2+ uptake induces autophagy
Autophagy protects normal cells but is insufficient for survival of cancer cells
Cancer cells fundamentally require basal mitochondrial Ca2+ uptake for survival
Acknowledgments
We thank Dr. Chi Van Dang for helpful discussions and comments. This work was supported by an NIH grants R37GM56328 (JKF), R01CA163566 (TWR), R01CA133154 (JAD) and P30NS047243 (AL), FONDECYT # 1120443 (CC), FONDAP # 15150012 (CC) and FONDECYT postdoctoral fellowship # 3140458 (FJ).
Footnotes
Supplementary information includes experimental procedures and six figures, and can be found online at
AUTHOR CONTRIBUTIONS
C.C. and J.K.F. developed the hypotheses, designed experiments and wrote the manuscript. C.C., M.M., A.M, A.L, F.J., F.U., G.B and N.S contributed to experimental design and data collection. J.M. provided the purified Xestospongin B. A.D. provided cell lines and guidance in nude mice experimental design. T.W.R. provide normal and transformed primary human fibroblasts.
Publisher's Disclaimer: This is a PDF file of an unedited manuscript that has been accepted for publication. As a service to our customers we are providing this early version of the manuscript. The manuscript will undergo copyediting, typesetting, and review of the resulting proof before it is published in its final citable form. Please note that during the production process errors may be discovered which could affect the content, and all legal disclaimers that apply to the journal pertain.
References
- Ahn CS, Metallo CM. Mitochondria as biosynthetic factories for cancer proliferation. Cancer Metab. 2015;3:1. doi: 10.1186/s40170-015-0128-2. [DOI] [PMC free article] [PubMed] [Google Scholar]
- Andrae U, Singh J, Ziegler-Skylakakis K. Pyruvate and related alpha-ketoacids protect mammalian cells in culture against hydrogen peroxide-induced cytotoxicity. Toxicol Lett. 1985;28:93–98. doi: 10.1016/0378-4274(85)90015-3. [DOI] [PubMed] [Google Scholar]
- Armstrong CT, Anderson JL, Denton RM. Studies on the regulation of the human E1 subunit of the 2-oxoglutarate dehydrogenase complex, including the identification of a novel calcium-binding site. Biochem J. 2014;459:369–381. doi: 10.1042/BJ20131664. [DOI] [PubMed] [Google Scholar]
- Bayley JP, Devilee P. Warburg tumours and the mechanisms of mitochondrial tumour suppressor genes. Barking up the right tree? Curr Opin Genet Dev. 2010;20:324–329. doi: 10.1016/j.gde.2010.02.008. [DOI] [PubMed] [Google Scholar]
- Birsoy K, Possemato R, Lorbeer FK, Bayraktar EC, Thiru P, Yucel B, Wang T, Chen WW, Clish CB, Sabatini DM. Metabolic determinants of cancer cell sensitivity to glucose limitation and biguanides. Nature. 2014;508:108–112. doi: 10.1038/nature13110. [DOI] [PMC free article] [PubMed] [Google Scholar]
- Boroughs LK, DeBerardinis RJ. Metabolic pathways promoting cancer cell survival and growth. Nat Cell Biol. 2015;17:351–359. doi: 10.1038/ncb3124. [DOI] [PMC free article] [PubMed] [Google Scholar]
- Cardenas C, Liberona JL, Molgo J, Colasante C, Mignery GA, Jaimovich E. Nuclear inositol 1,4,5-trisphosphate receptors regulate local Ca2+ transients and modulate cAMP response element binding protein phosphorylation. J Cell Sci. 2005;118:3131–3140. doi: 10.1242/jcs.02446. [DOI] [PubMed] [Google Scholar]
- Cardenas C, Miller RA, Smith I, Bui T, Molgo J, Muller M, Vais H, Cheung KH, Yang J, Parker I, et al. Essential regulation of cell bioenergetics by constitutive InsP3 receptor Ca2+ transfer to mitochondria. Cell. 2010;142:270–283. doi: 10.1016/j.cell.2010.06.007. [DOI] [PMC free article] [PubMed] [Google Scholar]
- Caro P, Kishan AU, Norberg E, Stanley IA, Chapuy B, Ficarro SB, Polak K, Tondera D, Gounarides J, Yin H, et al. Metabolic signatures uncover distinct targets in molecular subsets of diffuse large B cell lymphoma. Cancer Cell. 2012;22:547–560. doi: 10.1016/j.ccr.2012.08.014. [DOI] [PMC free article] [PubMed] [Google Scholar]
- Cheng G, Zielonka J, Dranka BP, McAllister D, Mackinnon AC, Jr, Joseph J, Kalyanaraman B. Mitochondria-targeted drugs synergize with 2-deoxyglucose to trigger breast cancer cell death. Cancer Res. 2012;72:2634–2644. doi: 10.1158/0008-5472.CAN-11-3928. [DOI] [PMC free article] [PubMed] [Google Scholar]
- Ciapa B, Pesando D, Wilding M, Whitaker M. Cell-cycle calcium transients driven by cyclic changes in inositol trisphosphate levels. Nature. 1994;368:875–878. doi: 10.1038/368875a0. [DOI] [PubMed] [Google Scholar]
- Cuyas E, Corominas-Faja B, Joven J, Menendez JA. Cell cycle regulation by the nutrient-sensing mammalian target of rapamycin (mTOR) pathway. Methods Mol Biol. 2014;1170:113–144. doi: 10.1007/978-1-4939-0888-2_7. [DOI] [PubMed] [Google Scholar]
- Davis FM, Parsonage MT, Cabot PJ, Parat MO, Thompson EW, Roberts-Thomson SJ, Monteith GR. Assessment of gene expression of intracellular calcium channels, pumps and exchangers with epidermal growth factor-induced epithelial-mesenchymal transition in a breast cancer cell line. Cancer Cell Int. 2013;13:76. doi: 10.1186/1475-2867-13-76. [DOI] [PMC free article] [PubMed] [Google Scholar]
- DeBerardinis RJ, Mancuso A, Daikhin E, Nissim I, Yudkoff M, Wehrli S, Thompson CB. Beyond aerobic glycolysis: transformed cells can engage in glutamine metabolism that exceeds the requirement for protein and nucleotide synthesis. Proc Natl Acad Sci U S A. 2007;104:19345–19350. doi: 10.1073/pnas.0709747104. [DOI] [PMC free article] [PubMed] [Google Scholar]
- Deberardinis RJ, Sayed N, Ditsworth D, Thompson CB. Brick by brick: metabolism and tumor cell growth. Curr Opin Genet Dev. 2008;18:54–61. doi: 10.1016/j.gde.2008.02.003. [DOI] [PMC free article] [PubMed] [Google Scholar]
- Desler C, Lykke A, Rasmussen LJ. The effect of mitochondrial dysfunction on cytosolic nucleotide metabolism. J Nucleic Acids. 2010;2010 doi: 10.4061/2010/701518. [DOI] [PMC free article] [PubMed] [Google Scholar]
- Foskett JK, Philipson B. The mitochondrial Ca2+ uniporter complex. Journal of molecular and cellular cardiology. 2015;78:3–8. doi: 10.1016/j.yjmcc.2014.11.015. [DOI] [PMC free article] [PubMed] [Google Scholar]
- Foskett JK, White C, Cheung KH, Mak DO. Inositol trisphosphate receptor Ca2+ release channels. Physiol Rev. 2007;87:593–658. doi: 10.1152/physrev.00035.2006. [DOI] [PMC free article] [PubMed] [Google Scholar]
- Franken NA, Rodermond HM, Stap J, Haveman J, van Bree C. Clonogenic assay of cells in vitro. Nat Protoc. 2006;1:2315–2319. doi: 10.1038/nprot.2006.339. [DOI] [PubMed] [Google Scholar]
- Glancy B, Balaban RS. Role of mitochondrial Ca2+ in the regulation of cellular energetics. Biochemistry. 2012;51:2959–2973. doi: 10.1021/bi2018909. [DOI] [PMC free article] [PubMed] [Google Scholar]
- Grassian AR, Parker SJ, Davidson SM, Divakaruni AS, Green CR, Zhang X, Slocum KL, Pu M, Lin F, Vickers C, et al. IDH1 mutations alter citric acid cycle metabolism and increase dependence on oxidative mitochondrial metabolism. Cancer Res. 2014;74:3317–3331. doi: 10.1158/0008-5472.CAN-14-0772-T. [DOI] [PMC free article] [PubMed] [Google Scholar]
- Han JK, Fukami K, Nuccitelli R. Reducing inositol lipid hydrolysis, Ins(1,4,5)P3 receptor availability, or Ca2+ gradients lengthens the duration of the cell cycle in Xenopus laevis blastomeres. J Cell Biol. 1992;116:147–156. doi: 10.1083/jcb.116.1.147. [DOI] [PMC free article] [PubMed] [Google Scholar]
- Hatzivassiliou G, Zhao F, Bauer DE, Andreadis C, Shaw AN, Dhanak D, Hingorani SR, Tuveson DA, Thompson CB. ATP citrate lyase inhibition can suppress tumor cell growth. Cancer Cell. 2005;8:311–321. doi: 10.1016/j.ccr.2005.09.008. [DOI] [PubMed] [Google Scholar]
- Jaimovich E, Mattei C, Liberona JL, Cardenas C, Estrada M, Barbier J, Debitus C, Laurent D, Molgo J. Xestospongin B, a competitive inhibitor of IP3-mediated Ca2+ signalling in cultured rat myotubes, isolated myonuclei, and neuroblastoma (NG108-15) cells. FEBS Lett. 2005;579:2051–2057. doi: 10.1016/j.febslet.2005.02.053. [DOI] [PubMed] [Google Scholar]
- Janiszewska M, Suva ML, Riggi N, Houtkooper RH, Auwerx J, Clement-Schatlo V, Radovanovic I, Rheinbay E, Provero P, Stamenkovic I. Imp2 controls oxidative phosphorylation and is crucial for preserving glioblastoma cancer stem cells. Genes Dev. 2012;26:1926–1944. doi: 10.1101/gad.188292.112. [DOI] [PMC free article] [PubMed] [Google Scholar]
- Jones RG, Plas DR, Kubek S, Buzzai M, Mu J, Xu Y, Birnbaum MJ, Thompson CB. AMP-activated protein kinase induces a p53-dependent metabolic checkpoint. Mol Cell. 2005;18:283–293. doi: 10.1016/j.molcel.2005.03.027. [DOI] [PubMed] [Google Scholar]
- Jones RG, Thompson CB. Tumor suppressors and cell metabolism: a recipe for cancer growth. Genes Dev. 2009;23:537–548. doi: 10.1101/gad.1756509. [DOI] [PMC free article] [PubMed] [Google Scholar]
- Jose C, Bellance N, Rossignol R. Choosing between glycolysis and oxidative phosphorylation: a tumor’s dilemma? Biochim Biophys Acta. 2011;1807:552–561. doi: 10.1016/j.bbabio.2010.10.012. [DOI] [PubMed] [Google Scholar]
- Kang SS, Han KS, Ku BM, Lee YK, Hong J, Shin HY, Almonte AG, Woo DH, Brat DJ, Hwang EM, et al. Caffeine-mediated inhibition of calcium release channel inositol 1,4,5-trisphosphate receptor subtype 3 blocks glioblastoma invasion and extends survival. Cancer Res. 2010;70:1173–1183. doi: 10.1158/0008-5472.CAN-09-2886. [DOI] [PMC free article] [PubMed] [Google Scholar]
- Kaplon J, Zheng L, Meissl K, Chaneton B, Selivanov VA, Mackay G, van der Burg SH, Verdegaal EM, Cascante M, Shlomi T, et al. A key role for mitochondrial gatekeeper pyruvate dehydrogenase in oncogene-induced senescence. Nature. 2013;498:109–112. doi: 10.1038/nature12154. [DOI] [PubMed] [Google Scholar]
- Koppenol WH, Bounds PL, Dang CV. Otto Warburg’s contributions to current concepts of cancer metabolism. Nat Rev Cancer. 2011;11:325–337. doi: 10.1038/nrc3038. [DOI] [PubMed] [Google Scholar]
- Lagadinou ED, Sach A, Callahan K, Rossi RM, Neering SJ, Minhajuddin M, Ashton JM, Pei S, Grose V, O’Dwyer KM, et al. BCL-2 inhibition targets oxidative phosphorylation and selectively eradicates quiescent human leukemia stem cells. Cell Stem Cell. 2013;12:329–341. doi: 10.1016/j.stem.2012.12.013. [DOI] [PMC free article] [PubMed] [Google Scholar]
- Levine AJ, Puzio-Kuter AM. The control of the metabolic switch in cancers by oncogenes and tumor suppressor genes. Science. 2010;330:1340–1344. doi: 10.1126/science.1193494. [DOI] [PubMed] [Google Scholar]
- Mallilankaraman K, Cardenas C, Doonan PJ, Chandramoorthy HC, Irrinki KM, Golenar T, Csordas G, Madireddi P, Yang J, Muller M, et al. MCUR1 is an essential component of mitochondrial Ca2+ uptake that regulates cellular metabolism. Nat Cell Biol. 2012a;14:1336–1343. doi: 10.1038/ncb2622. [DOI] [PMC free article] [PubMed] [Google Scholar]
- Mallilankaraman K, Doonan P, Cardenas C, Chandramoorthy HC, Muller M, Miller R, Hoffman NE, Gandhirajan RK, Molgo J, Birnbaum MJ, et al. MICU1 is an essential gatekeeper for MCU-mediated mitochondrial Ca2+ uptake that regulates cell survival. Cell. 2012b;151:630–644. doi: 10.1016/j.cell.2012.10.011. [DOI] [PMC free article] [PubMed] [Google Scholar]
- Marin-Valencia I, Yang C, Mashimo T, Cho S, Baek H, Yang XL, Rajagopalan KN, Maddie M, Vemireddy V, Zhao Z, et al. Analysis of tumor metabolism reveals mitochondrial glucose oxidation in genetically diverse human glioblastomas in the mouse brain in vivo. Cell Metab. 2012;15:827–837. doi: 10.1016/j.cmet.2012.05.001. [DOI] [PMC free article] [PubMed] [Google Scholar]
- McCormack JG, Denton RM. The effects of calcium ions and adenine nucleotides on the activity of pig heart 2-oxoglutarate dehydrogenase complex. Biochem J. 1979;180:533–544. doi: 10.1042/bj1800533. [DOI] [PMC free article] [PubMed] [Google Scholar]
- Messai Y, Noman MZ, Hasmim M, Janji B, Tittarelli A, Boutet M, Baud V, Viry E, Billot K, Nanbakhsh A, et al. ITPR1 protects renal cancer cells against natural killer cells by inducing autophagy. Cancer Res. 2014;74:6820–6832. doi: 10.1158/0008-5472.CAN-14-0303. [DOI] [PubMed] [Google Scholar]
- Metallo CM, Gameiro PA, Bell EL, Mattaini KR, Yang J, Hiller K, Jewell CM, Johnson ZR, Irvine DJ, Guarente L, et al. Reductive glutamine metabolism by IDH1 mediates lipogenesis under hypoxia. Nature. 2012;481:380–384. doi: 10.1038/nature10602. [DOI] [PMC free article] [PubMed] [Google Scholar]
- Miller AL, Fluck RA, McLaughlin JA, Jaffe LF. Calcium buffer injections inhibit cytokinesis in Xenopus eggs. J Cell Sci. 1993;106(Pt 2):523–534. doi: 10.1242/jcs.106.2.523. [DOI] [PubMed] [Google Scholar]
- Momose I, Ohba S, Tatsuda D, Kawada M, Masuda T, Tsujiuchi G, Yamori T, Esumi H, Ikeda D. Mitochondrial inhibitors show preferential cytotoxicity to human pancreatic cancer PANC-1 cells under glucose-deprived conditions. Biochem Biophys Res Commun. 2010;392:460–466. doi: 10.1016/j.bbrc.2010.01.050. [DOI] [PubMed] [Google Scholar]
- Moreno-Sanchez R, Rodriguez-Enriquez S, Marin-Hernandez A, Saavedra E. Energy metabolism in tumor cells. FEBS J. 2007;274:1393–1418. doi: 10.1111/j.1742-4658.2007.05686.x. [DOI] [PubMed] [Google Scholar]
- Mullen AR, Hu Z, Shi X, Jiang L, Boroughs LK, Kovacs Z, Boriack R, Rakheja D, Sullivan LB, Linehan WM, et al. Oxidation of alpha-ketoglutarate is required for reductive carboxylation in cancer cells with mitochondrial defects. Cell Rep. 2014;7:1679–1690. doi: 10.1016/j.celrep.2014.04.037. [DOI] [PMC free article] [PubMed] [Google Scholar]
- Mullen AR, Wheaton WW, Jin ES, Chen PH, Sullivan LB, Cheng T, Yang Y, Linehan WM, Chandel NS, DeBerardinis RJ. Reductive carboxylation supports growth in tumour cells with defective mitochondria. Nature. 2012;481:385–388. doi: 10.1038/nature10642. [DOI] [PMC free article] [PubMed] [Google Scholar]
- Munshi A, Hobbs M, Meyn RE. Clonogenic cell survival assay. Methods Mol Med. 2005;110:21–28. doi: 10.1385/1-59259-869-2:021. [DOI] [PubMed] [Google Scholar]
- Murphy AN, Kelleher JK, Fiskum G. Submicromolar Ca2+ regulates phosphorylating respiration by normal rat liver and AS-30D hepatoma mitochondria by different mechanisms. J Biol Chem. 1990;265:10527–10534. [PubMed] [Google Scholar]
- Nakada D, Saunders TL, Morrison SJ. Lkb1 regulates cell cycle and energy metabolism in haematopoietic stem cells. Nature. 2010;468:653–658. doi: 10.1038/nature09571. [DOI] [PMC free article] [PubMed] [Google Scholar]
- Porporato PE, Payen VL, Perez-Escuredo J, De Saedeleer CJ, Danhier P, Copetti T, Dhup S, Tardy M, Vazeille T, Bouzin C, et al. A mitochondrial switch promotes tumor metastasis. Cell Rep. 2014;8:754–766. doi: 10.1016/j.celrep.2014.06.043. [DOI] [PubMed] [Google Scholar]
- Resende RR, Adhikari A, da Costa JL, Lorencon E, Ladeira MS, Guatimosim S, Kihara AH, Ladeira LO. Influence of spontaneous calcium events on cell-cycle progression in embryonal carcinoma and adult stem cells. Biochim Biophys Acta. 2010;1803:246–260. doi: 10.1016/j.bbamcr.2009.11.008. [DOI] [PubMed] [Google Scholar]
- Ridky TW, Chow JM, Wong DJ, Khavari PA. Invasive three-dimensional organotypic neoplasia from multiple normal human epithelia. Nat Med. 2010;16:1450–1455. doi: 10.1038/nm.2265. [DOI] [PMC free article] [PubMed] [Google Scholar]
- Scaffidi P, Misteli T, Bianchi ME. Release of chromatin protein HMGB1 by necrotic cells triggers inflammation. Nature. 2002;418:191–195. doi: 10.1038/nature00858. [DOI] [PubMed] [Google Scholar]
- Shi Y, Dierckx A, Wanrooij PH, Wanrooij S, Larsson NG, Wilhelmsson LM, Falkenberg M, Gustafsson CM. Mammalian transcription factor A is a core component of the mitochondrial transcription machinery. Proc Natl Acad Sci U S A. 2012;109:16510–16515. doi: 10.1073/pnas.1119738109. [DOI] [PMC free article] [PubMed] [Google Scholar]
- Shibao K, Fiedler MJ, Nagata J, Minagawa N, Hirata K, Nakayama Y, Iwakiri Y, Nathanson MH, Yamaguchi K. The type III inositol 1,4,5-trisphosphate receptor is associated with aggressiveness of colorectal carcinoma. Cell Calcium. 2010;48:315–323. doi: 10.1016/j.ceca.2010.09.005. [DOI] [PMC free article] [PubMed] [Google Scholar]
- Skrtic M, Sriskanthadevan S, Jhas B, Gebbia M, Wang X, Wang Z, Hurren R, Jitkova Y, Gronda M, Maclean N, et al. Inhibition of mitochondrial translation as a therapeutic strategy for human acute myeloid leukemia. Cancer Cell. 2011;20:674–688. doi: 10.1016/j.ccr.2011.10.015. [DOI] [PMC free article] [PubMed] [Google Scholar]
- Sorlie T, Wang Y, Xiao C, Johnsen H, Naume B, Samaha RR, Borresen-Dale AL. Distinct molecular mechanisms underlying clinically relevant subtypes of breast cancer: gene expression analyses across three different platforms. BMC Genomics. 2006;7:127. doi: 10.1186/1471-2164-7-127. [DOI] [PMC free article] [PubMed] [Google Scholar]
- Szatkowski C, Parys JB, Ouadid-Ahidouch H, Matifat F. Inositol 1,4,5-trisphosphate-induced Ca2+ signalling is involved in estradiol-induced breast cancer epithelial cell growth. Mol Cancer. 2010;9:156. doi: 10.1186/1476-4598-9-156. [DOI] [PMC free article] [PubMed] [Google Scholar]
- Territo PR, Mootha VK, French SA, Balaban RS. Ca2+ activation of heart mitochondrial oxidative phosphorylation: role of the F(0)/F(1)-ATPase. Am J Physiol Cell Physiol. 2000;278:C423–435. doi: 10.1152/ajpcell.2000.278.2.C423. [DOI] [PubMed] [Google Scholar]
- Tsang WY, Spektor A, Luciano DJ, Indjeian VB, Chen Z, Salisbury JL, Sanchez I, Dynlacht BD. CP110 cooperates with two calcium-binding proteins to regulate cytokinesis and genome stability. Mol Biol Cell. 2006;17:3423–3434. doi: 10.1091/mbc.E06-04-0371. [DOI] [PMC free article] [PubMed] [Google Scholar]
- Vander Heiden MG. Exploiting tumor metabolism: challenges for clinical translation. J Clin Invest. 2013;123:3648–3651. doi: 10.1172/JCI72391. [DOI] [PMC free article] [PubMed] [Google Scholar]
- Vander Heiden MG, Cantley LC, Thompson CB. Understanding the Warburg effect: the metabolic requirements of cell proliferation. Science. 2009;324:1029–1033. doi: 10.1126/science.1160809. [DOI] [PMC free article] [PubMed] [Google Scholar]
- Viale A, Pettazzoni P, Lyssiotis CA, Ying H, Sanchez N, Marchesini M, Carugo A, Green T, Seth S, Giuliani V, et al. Oncogene ablation-resistant pancreatic cancer cells depend on mitochondrial function. Nature. 2014 doi: 10.1038/nature13611. [DOI] [PMC free article] [PubMed] [Google Scholar]
- Vitale I, Galluzzi L, Castedo M, Kroemer G. Mitotic catastrophe: a mechanism for avoiding genomic instability. Nat Rev Mol Cell Biol. 2011;12:385–392. doi: 10.1038/nrm3115. [DOI] [PubMed] [Google Scholar]
- Warburg O. On the origin of cancer cells. Science. 1956;123:309–314. doi: 10.1126/science.123.3191.309. [DOI] [PubMed] [Google Scholar]
- Wheaton WW, Weinberg SE, Hamanaka RB, Soberanes S, Sullivan LB, Anso E, Glasauer A, Dufour E, Mutlu GM, Budigner GS, et al. Metformin inhibits mitochondrial complex I of cancer cells to reduce tumorigenesis. Elife. 2014;3:e02242. doi: 10.7554/eLife.02242. [DOI] [PMC free article] [PubMed] [Google Scholar]
- Wise DR, Thompson CB. Glutamine addiction: a new therapeutic target in cancer. Trends Biochem Sci. 2010;35:427–433. doi: 10.1016/j.tibs.2010.05.003. [DOI] [PMC free article] [PubMed] [Google Scholar]
- Yang S, Wang X, Contino G, Liesa M, Sahin E, Ying H, Bause A, Li Y, Stommel JM, Dell’antonio G, et al. Pancreatic cancers require autophagy for tumor growth. Genes Dev. 2011;25:717–729. doi: 10.1101/gad.2016111. [DOI] [PMC free article] [PubMed] [Google Scholar]
- Zhang X, Fryknas M, Hernlund E, Fayad W, De Milito A, Olofsson MH, Gogvadze V, Dang L, Pahlman S, Schughart LA, et al. Induction of mitochondrial dysfunction as a strategy for targeting tumour cells in metabolically compromised microenvironments. Nat Commun. 2014;5:3295. doi: 10.1038/ncomms4295. [DOI] [PMC free article] [PubMed] [Google Scholar]
Associated Data
This section collects any data citations, data availability statements, or supplementary materials included in this article.