

Abstract
Purpose
This study investigates the influence of water compartmentation and heterogeneous relaxation properties on quantitative magnetization transfer (qMT) imaging in tissues, and in particular whether a two-pool model is sufficient to describe qMT data in brain tumors.
Methods
Computer simulations and in vivo experiments with a series of qMT measurements before and after injection of Gd-DTPA were performed. Both off-resonance pulsed saturation (pulsed) and on-resonance selective inversion recovery (SIR) qMT methods were used, and all data were fit with a two-pool model only.
Results
Simulations indicate that a two-pool fitting of four-pool data gives accurate measures of PSR (pool size ratio of macromolecular vs free water protons) when there is fast transcytolemmal exchange and slow R1 recovery. The fitted in vivo PSR of both pulsed and SIR qMT methods showed no dependence on R1 variations caused by different concentrations of Gd-DTPA during wash-out, while the fitted kex (MT exchange rate) changed significantly with R1.
Conclusion
A two-pool model provides reproducible estimates of PSR in brain tumors independent of relaxation properties in the presence of relatively fast transcytolemmal exchange, while estimates of kex are biased by relaxation variations. In addition, estimates of PSR in brain tumors using the pulsed and SIR qMT methods agree well.
Keywords: qMT, PSR, SIR, transcytolemmal water exchange, Gd-DTPA, tumor
Introduction
Magnetization transfer in tissues (1) originates from the cross-relaxation between macromolecular and free water protons, via dipolar interactions and/or chemical exchange. The semi-quantitative metric, magnetization transfer ratio (MTR), has been adopted to indirectly image variations in macromolecular proton pool sizes, which often correlate with variations in tissue composition in pathophysiological conditions. MTR imaging has been successfully applied to characterize neurological disorders (2), neuromuscular diseases (3), and cancer (4–8). However, MTR is also sensitive to hardware choices (e.g. magnetic field strength) and pulse sequence parameters (e.g. RF irradiation power, frequency offset), and hence its specificity and sensitivity to specific pathophysiological changes are reduced. Moreover, MTR as a single metric is inherently sensitive to multiple tissue properties simultaneously, such as tissue relaxation rate, MT exchange rates, and the size of macromolecular proton pool. Therefore, variations in measured MTR may originate from various sources including multiple tissue properties and acquisition approaches, which increase difficulty to interpret MTR data. To increase the specificity to individual tissue properties and reduce the influence of hardware settings, quantitative magnetization transfer (qMT) imaging methods have been developed to quantify the intrinsic proton relaxation rates, MT exchange rate, and the pool size ratio (PSR) of macromolecular protons to free water protons. Several qMT methods using different models, analyses and acquisitions have been proposed, such as continuous-wave (CW) saturation (9), pulsed saturation (10), selective inversion recovery (SIR) (11), stimulated-echo-based (12), and steady-state free precession based (13) methods. Among these, the pulsed saturation (pulsed MT) method has been the most widely adopted. The pulsed method applies saturation pulses with varying frequency offsets and saturation powers systematically. A variety of quantitative analyses have been proposed to describe the pulsed qMT data, including those developed by Sled and Pike (10), Ramani et al. (14), Yarnykh (15), and Portnoy and Stanisz (16). The SIR qMT method (11) applies an on-resonance inversion pulse to invert the magnetization of the free-water pool, and the resulting transient longitudinal magnetization is measured and fit to a bi-exponential function. Unlike the pulsed saturation method, SIR is based on the transient response of the sample, and hence provides a fundamentally different way of probing effects of multiple compartments on two-pool qMT fittings. A number of variants of the SIR approach have also been developed and applied in small animal (17–19) and human in vivo imaging (20,21) at different field strengths.
Most qMT methods assume a simple two-pool model that consists of a macromolecular proton pool and a free water proton pool (9). However, this is an oversimplification because real biological tissues may contain multiple distinct water and macromolecular (solid) pools. For example, white matter (WM) has been reported as a system consisting of multiple water/solid components, including myelin water, intra-/extra-axonal water, myelin solids (macromolecular protons), and non-myelin solids (22–24). Different diseases may alter different water/solid components in different ways, and hence the simplified two-pool model may not characterize pathophysiological variations adequately. For example, demyelination can cause decreases of macromolecular proton pools, while inflammation can cause increases of free water proton pools. Although both of these two different pathological changes cause decreases of PSR values, the underlying mechanisms are very different. In order to improve the accuracy of model fits, more complex four-pool models have been developed (22–25). However, these models also include assumptions and more importantly, acquiring and fitting data are time-consuming, which limits their practical implementation.
In addition to applications in neurodegenerative diseases, MT imaging, especially MTR, has been used extensively for imaging cancer, e.g. brain (5), prostate (6), pancreas (7), and breast cancer (8). There has also been increasing interest in applying qMT imaging to characterize solid tumors (15,19,26,27) to overcome the intrinsic limitations (discussed above) of MTR. Again, these qMT studies used a two-pool model to simplify data analyses and speed up acquisitions for practical in vivo use. However, given the fact that tumors contain multiple water compartments, e.g. intra- and extra-cellular spaces, with heterogeneous relaxation properties, the validity of fitting qMT data of tumors using such a two-pool model has not been fully investigated. Moreover, anti-cancer treatments may alter the water compartmentation (28) and selectively change intra- or extracellular macromolecular contents (28–30) which are anticipated to cause relaxation property variations within tumors, which may confound the interpretation of derived qMT parameters in complex ways. Therefore, it is plausible to investigate the influence of multiple water compartments and heterogeneous relaxation properties on qMT measurements in tumors. Note that, different from normal neural tissues, tumor cells have been reported to have a relatively high transcytolemmal water exchange rate, which may simplify the requirements for accurate qMT modelling. For example, the apparent transcytolemmal exchange rate has been reported up to 2.9 ± 0.8 s−1 in human solid brain tumors, much larger than those in human white matter (range from 0.8 ± 0.08 s−1 in the internal capsule to 1.6 ± 0.11 s−1 in frontal white matter) (31). Moreover, if apoptosis occurs after effective anti-cancer treatments, the transcytolemmal water exchange rate in tumors can increase further to 6.8 ± 3.9 s−1 (32), four times that of normal white matter. For comparison, the longitudinal relaxation rate, R1, has been reported as 0.63 ± 0.03 s−1 in rat white matter and 0.47 ± 0.07 s−1 in rat brain tumor at 9.4T (19), much smaller than the transcytolemmal exchange rate in tumors. If the freely diffusing water molecules in different water compartments (intra- and extracellular spaces) are well mixed during qMT measurements in tumors, a two-pool model would be sufficient to describe qMT data. This would significantly simplify data analysis and make accurate qMT imaging feasible for practical studies.
In the current study, the influence of water compartmentation and relaxation on qMT measurements in tumors was investigated via comprehensive numerical simulations and in vivo experiments using two widely used qMT approaches, i.e. pulsed (off-resonance) and SIR (on-resonance) methods. Without any assumption of the distribution of macromolecules in tumors, numerical simulations based on two-, three-, and four-pool tissue models with various transcytolemmal water exchange rates and proton relaxation rates were performed to predict the results of both pulsed and SIR acquisitions. After that, irrespective of the number of pools used in the simulations, the simple two-pool model was used to fit all simulated MT signals to investigate whether two-pool models are sufficient to describe qMT data in tumors. Subsequent in vivo experiments imaged rats bearing 9L brain tumors and implemented a series of repeated qMT measurements after Gd-DTPA (gadolinium-diethylenetriamine pentaacetic acid) injections to estimate qMT parameters in the presence of different relaxation rates in tumors. Because Gd-DTPA selectively alters the extracellular relaxation properties without altering transcytolemmal water exchange rate, PSR or kex (MT exchange rate between the free water and macromolecular pools based on a two-pool model), this manipulation provides an opportunity to investigate how much derived qMT parameters in tumors vary with relaxation changes. QMT parameters were fit with a two-pool model only and compared without and with different concentrations of Gd-DTPA. In addition, the qMT parameters obtained using pulsed and SIR methods were compared to see whether these two different qMT methods produce similar results.
Methods
Optimization of SIR acquisition for tumors
In a previous study (33), we used a Cramer-Rao lower bound criterion to minimize the scanning time for SIR data acquisitions, and found a minimum of five signal data points (each with one pair of inversion time ti and delay time td (18)) were appropriate for SIR data analysis. However, that optimization was based on an assumption that tissue T1 was in the range of 0.67 – 2 s (such as in normal white matter), whereas tumor T1 values at higher fields are usually significantly larger, e.g. up to 3 s in rodent brain tumors at 9.4T. (19). A sampling scheme of 20 pairs of ti and td was implemented previously for SIR qMT imaging in rodent brain tumors for better accuracy (19), but then the total scanning time was much longer (~ 14 min for 2-shot echo-planar-imaging (EPI) acquisitions). In the current study, we performed a similar optimization as reported in (33) to minimize the scanning time required for SIR qMT imaging in tumors with a broader range of R1 (0.33 – 2 s−1). To enhance the stability and precision of data fitting, seven signal data points were chosen and the corresponding optimized seven pairs of ti and td are shown in Table 1. The total scanning time for each SIR data acquisition was 63 s for single-shot EPI acquisitions.
Table 1.
Pulse sequence parameters used in both the simulations and the imaging acquisitions.
| Methods | Key parameters | Parameter values |
|---|---|---|
| Pulsed saturation | Pulse width | 14.6 ms |
| TR | 28 ms | |
| Irradiation flip angles | 220°, 820° | |
| RF offsets | 1– 100 ks−1, logarithmically spaced | |
| SIR | Inversion pulse | 1-ms 180° hard pulse |
| Pre-delay time (td) | 4.735, 4.729, 4.531, 1.080, 3.589, 3.454, 0.01 s | |
| Inversion recovery time (ti) | 0.004, 0.050, 0.078, 0.252, 0.319, 0.450, 1.331 s |
Numerical Simulations
All numerical simulations and data analyses in the following sections were performed using MATLAB (Mathworks, Natick, MA). Due to a lack of precise knowledge about the distribution of macromolecules in tumors that may interact with free water, the MT process in cancerous tissues was described using two-, three-, and four-pool models, respectively. For simplicity, only the most generalized four-pool model system is shown here. More details of numerical simulations of all model systems can be found in the Supporting Materials. We need to emphasize that, despite different number of pools used in the simulations, all simulated qMT signals were fit to a two-pool qMT model only to obtain qMT parameters. By such a means, the validity and sufficiency of the time-efficient two-pool qMT model to describe complex qMT signals in vivo was evaluated.
Four-pool MT model for tumors
The four-pool MT model includes intracellular free (mobile) water “A”, extracellular free (mobile) water “B”, intracellular macromolecular (immobile) protons “C”, and extracellular macromolecular (immobile) protons “D”, as illustrated in Figure 1. In addition to their intrinsic MR parameters M0i, R1i, R2i, (i = A, B, C, and D, respectively), there were exchange processes between these pools, with kAB noted as the transcytolemmal water exchange rate from the intracellular to the extracellular free water, kBA noted as the transcytolemmal water exchange rate in the inversed direction, i.e. from the extracellular to the intracellular free water, kCA noted as the MT exchange rate from the intracellular macromolecules to the intracellular free water, and kDB noted as the MT exchange rate from the extracellular macromolecules to the extracellular water. Note that previous reported transcytolemmal water change rates usually indicate kAB, and hence kAB was mainly investigated in the current work. For the exchanges between these pools, there are balanced relations i.e. M0A × kAB = M0B × kBA, M0A × kAC = M0C × kCA, and M0B × kBD = M0D × kDB. Our choices of intrinsic parameter values mainly followed previous studies (34). To mimic the relaxation property changes caused by the injection of Gd-DTPA, R1B was varied from 0.3 to 2.9 s−1, stepped by 0.2 s−1, and R2B = 20 + (R1B – 0.4) *10 s−1. The transcytolemmal water exchange rate kAB varied from 0 to 6 s−1. Two sets of simulations were performed based on the four-pool model system: (1) different intrinsic PSRs in intra- and extracellular components with parameters of M0A = 0.705, R1A = 0.4 s−1, R2A = 20 s−1, M0B = 0.24, M0C = 0.05 and M0D = 0.005; and (2) a homogenous distribution of PSRs of 0.0638 everywhere inside tumor with M0A = 0.705, M0B = 0.235, M0C = 0.045 and M0D = 0.015. Only the results of the first type of simulation are shown here, and the results of the second type are shown in the Supplementary Materials. All simulated results were shown with observed R1 of the whole system. Note that Gd-DTPA also introduces magnetic susceptibility gradients that cross cell membranes (35), which may alter intracellular R2A. The simulations suggest the influence of R2A on our qMT measurements is negligible (data not shown), so R2A was assumed constant in the simulations.
Figure 1.
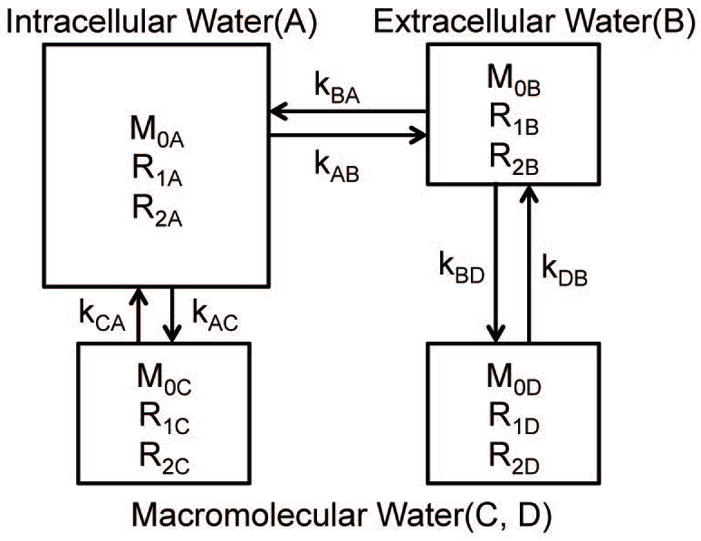
The scheme of the four-pool MT model used in the numerical simulations. It includes intracellular free (mobile) water “A”, extracellular water “B”, intracellular macromolecules (immobile) “C”, and extracellular macromolecules (immobile) “D” pools. The model parameters and spin exchange rates are labeled.
Numerical simulations of qMT signals
Numerical simulations were performed by solving modified Bloch equations (see Supporting Materials) with either off-resonance saturation pulses to simulate pulsed MT data or on-resonance inversion pulses to simulate SIR MT data. For the pulsed MT, Gaussian-shaped saturation pulses were used with pulse width = 14.6 ms and time of repetition (TR) = 28 ms. When the Mz0 of the intracellular free water component varied < 0.01% in two adjacent repetitions, the system was considered in a steady state. Spoiler gradients were simulated by setting the transverse magnetization to zero. The sampling scheme consisted of two irradiation powers with nominal flip angles of 220° and 820° and ten frequency offsets (34). The R1 values obtained using the SIR method were used to fit pulsed qMT parameters.
The SIR data were simulated by four steps according to the model described previously (33). Briefly, the initial transverse magnetization of all pools was first set to zero, simulating our recent method in which an additional saturation pulse train was applied to fully saturate the magnetization of all proton pools (19); a pre-delay (td) allowed the z magnetization to recover followed by an on-resonance 1-ms 180° inversion hard pulse to invert the water longitudinal magnetization; finally, an inversion recovery (ti) time allowed the system to recover before the integrated z magnetization was measured.
Irrespective of the number of pools used in the simulations, all simulated signals were fit using the two-pool model to evaluate whether two pools are sufficient to describe the qMT data. The simulated pulsed data were fit to the two-pool Ramani’s model (14). Also, a subset of the simulated SIR data (ti > 100ms) were fit as described in (33) to estimate qMT parameters and R1 the apparent relaxation rate of whole tissues. Note that such a R1 was also used in the pulsed MT data fitting. The true PSR values were calculated = (M0C +M0D)/(M0A + M0B). To mimic the injections of Gd-DTPA, 14 R1B’s were used evenly distributed from 0.3 to 2.9 s.
Animal preparation
All animal procedures were approved by the Institutional Animal Care and Use Committee at Vanderbilt University. 9L glioblastoma cells were injected into the right brains of six male Fischer 344 rats (250 – 300 grams). Imaging was performed after tumors grew to 30 – 40 mm3, about 14 – 18 days after the tumor cell injections. Details of the surgical procedures have been reported previously (19,36).
Animals were anesthetized with 3% isoflurane for induction and 2% during MRI scanning. The position of each rat head was secured using an MRI compatible cradle with bite and head bars. A warm-air feedback system was used to ensure rat rectal temperature was maintained at ~ 37 °C throughout the studies.
MRI experiments in vivo
All images were acquired on a 9.4T Agilent horizontal MRI scanner. A diagram of the experimental design is shown in Figure 2. In the baseline period, high-resolution anatomical images, B1, B0, R2, pulsed MT, R1 and SIR MT data were acquired. All MR parameters were acquired with a single axial slice crossing the center of the tumor with a slice thickness of 2 mm, field of view of 32 × 32 mm2 and matrix size of 64 × 64, yielding an isotropic in-plane resolution of 500 μm. B1 maps were obtained using a double-angle method, in which pre-pulses with flip angles of 33° and 66° were applied before a spin-echo (SE) EPI readout sequence (34). B0 maps were obtained using a spoiled gradient recalled echo (SPGR) sequence, with four echo times (TE) ranging from 3 to 9 ms, stepped by 2 ms. The acquisitions of R2, pulsed, and SIR were interleaved and repeated 11 times with a scanning time of 4 min for each repetition. R2 maps were obtained using single-shot spin-echo EPI acquisitions with two TEs of 30 and 80 ms. Pulsed MT data were acquired using a MT-weighted SPGR sequence using the same sampling scheme as the simulations, with TR/TE = 28/4 ms, MT pulse width = 14.6 ms and excitation flip angle 7°. Note that with such a small flip angle and correspondingly low saturation power, the potential bias in using Ramani’s model has been minimized (34). SIR MT data were acquired using a single-shot SE-EPI sequence with a pre-inversion pulse and a saturation pulse train with varying TR’s and a fixed TE = 30 ms as described in (19). The optimized 7-point sampling scheme (see Table 1) was used. After the acquisition of a baseline, a bolus of GD-DTPA (0.2 mmol kg−1) was intravenously delivered via a tail vein. During and after the injection of Gd-GTPA, a T1-weighted SPGR sequence (TR/TE = 100/2.1 ms) was performed to monitor R1 changes, as indicated in Figure 2. For each study, 11 serial acquisitions (10 after each Gd-DTPA injection) of T2, pulsed, and SIR MT data were obtained. Note that R1 values changed quickly during the acquisition of the 2nd (+135 ± 10.2%) and 3rd (+7.9 ± 7.6%) dynamic scans (See Figure 5), resulting in significant biased estimates of qMT parameters. Hence, the data of #2 and #3 dynamic scans were excluded from the following analyses.
Figure 2.

(a) The time course of spoiled-gradient echo (SPGR) signals of a tumor (red squares) and contralateral normal brain tissue (blue circles) from a representative rat. (b) Schematic diagram of the experimental protocol. The acquisitions of R2, SIR, and Pulsed-MT signals were interleaved and repeated 11 times. Between two repetitions, SPGR signals were acquired to monitor R1 various. The black arrows indicate the time when Gd-DTPA was injected.
Figure 5.

The longitudinal changes of R1, R2, PSR(pulsed), PSR(SIR), kex(pulsed), and kex(SIR) with different dynamic scans. The numbers in the figure legend represent different animals.
Experimental data analysis
All MR imaging data were processed on pixel-wise basis. The pulsed-MT data were fitted to Ramani’s model, with B1 maps for irradiation power correction, B0 maps for RF frequency offset correction. R2 values were calculated by fitting two echoes to an exponential decay. The observed R1 was obtained by fitting the SIR data to a mono-exponential function, as described in (33). A super-Lorentzian lineshape was adopted in pulsed MT data fitting (37). The SIR data were fit to the bi-exponential model (33) to determine qMT parameters. In the SIR data fitting, the effect of the inversion pulse on the macromolecular pool was set at 0.83, according to numerical simulations from our previous work (18). A Gaussian lineshape was adopted in simulating the inversion pulse effects in the SIR sequence, since the super-Lorentzian is not defined at zero offset. This change of lineshape is unlikely to cause significant effects, as the inversion pulse effects on the macromolecular pool have only a very weak dependence on lineshape (17). Both qMT models yielded five qMT parameters each, and the PSR values and kex values were of interest in the current study. Regions-of-interest (ROIs) were visually identified and manually defined for each rat. The mean and standard deviation (SD) of parameter values within each ROI were used for comparisons.
Statistical analysis
Most statistical analyses were performed using Matlab. For both pulsed and SIR qMT methods, the PSR and kex obtained from all dynamic scans (excluding #2 and #3) were compared to investigate if fitted qMT parameters varied with different relaxation rates using one-way ANOVA. Bland-Altman figures were used to evaluate the agreement between the estimates of PSR and kex obtained using pulsed and SIR methods. For the correlations of multiple MR parameters with R1, linear mixed-effects models with compound symmetry structure of the correlation were employed to account for animal-specific variations. This last analysis was performed with R statistical software version 3.0.2 (http://www.r-project.org/). For each model, histogram and scatter plot of residuals were visually inspected to assure the normality of each parameter and randomness of the error, respectively.
Results
Numerical Simulations
Simulated PSR and kex values as a function of R1 are shown in Figure 3. Four different values of kAB (transcytolemmal water exchange rate) spanned the range from 0 to 6 s−1. For the pulsed qMT method, PSR’s were all overestimated, while kex’s depended on the choices of kAB and R1. In the R1 range acquired in vivo (indicated as gray regions in Figure 3), the fitted PSR’s were < 1.40% higher than the true value of 6.38%. When R1 > 0.8 s−1, the fitted PSR’s were overestimated by at least a factor of two when kAB = 0 (no transcytolemmal water exchange). The fitted kex’s decreased monotonically with R1 for all kAB values. For the SIR method, the fitted PSR was less than 0.70% higher than the true value 6.38% in the in vivo R1 range, while the fitted kex deviated from the true kex values by a slight decrease of 1.3% with any choice of kAB in the in vivo R1 range. This indicates that the influence of transcytolemmal water exchange rate on SIR qMT measurements is minor in tumors at high fields in vivo. However, when R1 > 0.8 s−1, both PSR and kex change with kAB significantly. Note that the same range of R1B’s were used (0.3 to 2.9 s) in the simulations, while the corresponding R1 values were different for different kAB values.
Figure 3.

The simulated dependence of PSR (top) and kex (bottom) on tumor R1 using pulsed (left) and SIR (right) qMT methods based on a four-pool qMT model of tumors. Note that kAB is the transcytolemmal water exchange rate, and dashed lines in each figure represent the true values. The gray region represents the R1 range of 9L tumors measured in vivo without Gd-DTPA.
MRI experiments in vivo
Figure 4 shows parametric maps of R2, R1, PSR(SIR), and PSR(pulsed) obtained from the dynamic scans (excluding #2 and #3) from one representative rat. The ROI of the tumor is shown in the first PSR(SIR) map. As expected, after the injection of Gd-DTPA, R2 and R1 increased rapidly, and then decreased gradually during the washout. However, the values of both PSR(SIR) and PSR(pulsed) were found to be approximately similar across all of these scans, during which the relaxation rates in tumors were significantly different from time to time. Note that these parameters did not change with time in the normal tissue regions because of the absence of Gd-DTPA extravasation. Interestingly, kex(pulsed) was found changed between #1 and #4 in the normal tissue region of the representative rat shown in Figure 4, while such a variation was not found in the group analyses of all animals. A possible explanation is that the kex fitting was more prone to physiological noise.
Figure 4.

The parametric maps of R2, R1, PSR(SIR), kex(SIR), PSR(Pulsed) and kex(Pulsed) obtained from all dynamic scans (excluding #2 and #3) from one representative rat. The ROI of the tumor was shown in the first PSR(SIR) map.
The ROI data for R2, R1, PSR(SIR), kex(SIR), PSR(pulsed), and kex(pulsed) for all rat tumors are plotted in Figure 5. Before the Gd-DTPA injection, R2 values were 28.7 ± 1.8 s−1 across all rats and R1 values were 0.47 ± 0.03 s−1, which were consistent with previous reports of the same tumor type at this magnetic field strength 9.4T (36). After the injection of Gd-DTPA, R2 increased rapidly to 45 – 60 s−1, and then decreased gradually to ~ 35 s−1 at the last dynamic scan. Meanwhile, R1 values first increased up to 1.0 – 1.2 s−1, and then gradually decreased to ~ 0.75 s−1 for the last dynamic scan. For dynamic scans before and following contrast injection (#1 and #4–11), one-way ANOVA provided p = 0.99 and p = 0.69 for PSR(pulsed) and PSR(SIR), indicating there are no significant differences between different dynamic scans. This indicates that PSR values of tumors obtained using the two-pool model for both qMT acquisitions were constant even in the presence of real water compartmentation and with significant variations in relaxation rates. In other words, a two-pool qMT model may be sufficient for imaging PSR in tumors to provide a macromolecular metric that is distinct from the conventionally measured relaxation rates. Although kex(SIR) kept constant across all dynamic scans (p = 0.76), kex(pulsed) showed significant variations between different scans (p = 0.02), which means the estimates of kex(pulsed) were influenced by different relaxation rates. Note that a significant inter-subject variation (up to ~ 30%) was observed for all fitted qMT parameters at baseline, indicating heterogeneity among different tumors.
Figure 6 shows the correlations between R1 and R2, PSR(pulsed), PSR(SIR), kex(pulsed), and kex(SIR) for all dynamic scans except #2–3. A linear mixed-effects model was used to evaluate correlations. As expected, R2 showed a linear correlation with R1, as longitudinal and transverse relaxation rates both change in proportional to the concentration of Gd-DTPA. PSR(pulsed) and PSR(SIR) were not correlated with R1 (with p = 0.26 and 0.51, respectively), indicating that measurements of PSR were not influenced by the variations of relaxation caused by the injection of Gd-DTPA. kex(pulsed) showed a weak correlation with R1 (p = 0.05). By contrast, kex(SIR) did not correlate with R1 (p = 0.16). This independence of PSR(pulsed), PSR(SIR), and kex(SIR) from R1 and dependence of kex(pulsed) on R1 are in general agreement with the simulations in figure 3. However the dependence of kex(pulsed) on R1 goes in opposite directions in the experimental results and simulations, suggesting that our choice of 4 pool parameters may not fully match in vivo conditions.
Figure 6.

Correlations of MR parameters vs R1. The black lines represent linear fittings when there was a significant correlation, i.e. when p < 0.05. The numbers in the figure legend represent different animals.
Agreement of pulsed-qMT and SIR-qMT methods in tumors
Figure 7 shows Bland-Altman plots of PSR and kex obtained using pulsed and SIR qMT methods, respectively. Except for one outlier in the kex data, the PSR or kex values from two qMT approaches were in good agreement, i.e. within the range of ± 1.96 standard deviations. Note that the mean PSR difference of the two qMT methods was close to zero (0.03%), indicating that they are equivalent for measuring the macromolecular pool size ratio. However, kex(SIR) values were apparently higher than kex(pulsed) values, and the mean kex difference was −4.8 s−1, indicating that the influence of water relaxation on measurements of kex is different in pulsed and SIR qMT methods in tumors.
Figure 7.

The Bland-Altman plots of PSR (A) and kex (B) show the agreement of pulsed and SIR qMT methods in characterizing tumors.
Discussion
Practical qMT imaging is usually based on a two-pool model consisting of one free water pool and one macromolecular pool. However, real tissues contain multiple water compartments and macromolecular components, so more complex models may be needed to interpret qMT data obtained in vivo. Despite their theoretical shortcomings, the data acquisition and analyses of a two-pool model are time efficient and hence are attractive for practical applications. The present study investigated the actual behaviors of a two-pool model for estimating qMT parameters in tumors with heterogeneous relaxation properties. This is based on an assumption that the transcytolemmal water exchange rate is high enough in tumors so that water fractions are well mixed during qMT measurements. Computer simulations suggest that for the R1 range in vivo at high field (9.4T in this work), the two-pool model provides an accurate estimate of PSR even for varying transcytolemmal water exchange and relaxation rates. Our in vivo qMT measurements with Gd-DTPA injections confirmed that the fitted PSR’s did not change significantly before and after the injections of Gd-DTPA. These results suggest that a two-pool model is sufficient to estimate the PSR in tumors as intrinsic indicator of macromolecular content independent of relaxation rates, and hence there is no need to develop more complicated three- or four-pool model to estimate PSR in brain tumors. By contrast, kex (the MT exchange rate) depends on the transcytolemmal water exchange rate (shown in simulations) and R1 (shown in simulations and in vivo experiments), suggesting that kex obtained using a two-pool model is significantly affected by other tissue properties and may not reflect the intrinsic MT exchange rate in vivo. Under such circumstances, more complicated e.g. four-pool model may be necessary for better estimation of MT exchange rate.
A reliable imaging biomarker should have high specificity for a certain tissue property of interest with minimal influences from other tissue properties and acquisition approaches. Although more sophisticated data analysis models may provide more specific parameters, such as the four-pool qMT model deemed necessary in white matter, the acquisition time is a practical limiting factor. Hence, the scanning protocols and accuracy of estimating parameters are usually compromised. The current study shows that a robust PSR can still be estimated from a simplified two-pool model in tumors, which meets both the requirements of scanning feasibility, parameter accuracy (at least for rapid transcytolemmal exchange in brain tumors), and independence from changes in other (relaxation) parameters. Considering most qMT studies focus on PSR, this conclusion may have significant clinical relevance. By contrast, kex was found to be influenced by the variations of R1 and transcytolemmal water exchange rate, indicating that kex obtained using a two-pool model is not a reliable imaging metric to quantify MT exchange rate in tumors. Moreover, it has been reported that kex is more prone to noise (19), which results in a lower precision of kex in vivo.
Due to a lack of knowledge of the distribution and values of relaxation rates of macromolecules in tissues, our computer simulations assumed values based on previous simulations and in vivo results (19,34), but the chosen parameters may deviate from real values. To alleviate this bias, a broad range of R1 and transcytolemmal water exchange rate kAB were used to comprehensively investigate the influence of water compartmentation and heterogeneous relaxation on qMT imaging. The dependency of PSR and kex on R1 and kAB should be qualitatively correct, although the R1 range with which PSR values are constant in realistic cancerous tissues may be different. Nevertheless, the simulations and experiments in vivo in the current work showed consistent results. For example, the computer simulations showed that PSR was independent on R1 and kAB in the R1 range of 0.43 – 0.51 s−1 obtained in experiments in vivo. and kAB range of 0 to 6 s−1. Recall that the kAB of human solid brain tumors was reported up to 2.9 ± 0.8 s−1 and kAB in apoptotic cancer cells was reported further enhanced to 6.8 ± 3.9 s−1 (32)). Therefore, both R1 and kAB of the 9L brain tumors used in the current study met the requirements predicted by the simulations, which explains there was no significant dependence of PSR values on R1 in the experiments in vivo.
Although previous studies have suggested pulsed and SIR qMT methods provide similar PSR values in normal white matter tissues and rodent brain tumors, there has not been comprehensive studies to compare these two different qMT methods. Note that these two different qMT methods are based on different simplified assumptions so that each method will potentially be biased to different degrees from the effects of additional exchanging pools. However, interestingly, we have shown via in vivo experiments in the present study that, over a broad range of R1 values, these two qMT methods provide equivalent PSR values in tumors at relatively high magnetic fields strength, while the pulsed qMT method provides lower kex values compared with the SIR qMT method. This may be of interest for researchers practicing qMT imaging via different qMT methods. Note that the computer simulations suggested that, when R1 was much higher (corresponding to tissue R1 at lower field strengths), both methods significantly overestimate PSR, and the SIR method provides even higher values than that from the pulsed method.
The 9L gliosarcoma has been the most widely used experimental rat brain tumor model, and has been extensively used e.g. to investigate blood-brain and blood-tumor barriers, image brain tumors including MRI and PET, and assess therapeutic effects of radiation and chemo treatments (38). Specifically for qMT measurements, Figure 5 indicates the PSR of 9L tumors used in the current study was in the range of 4.5 – 6.2 %, which is very similar to the PSR range of 4 – 6% found in human gliomas (15). This indicates that the 9L gliosarcoma used in the current study is an appropriate tumor model to investigate qMT imaging in human brain tumors.
Conclusions
With the fast transcytolemmal water exchange rate and relatively low R1 values in tumors, a two-pool model is a good approximation to estimate the pool size ratio of macromolecular protons in tumors, while estimated MT exchange rates are significantly affected by the variations in water compartmentation and relaxation changes. These results may assist better interpretation of qMT data in tumors. In addition, pulsed and SIR qMT methods are equivalent for estimating PSR in tumors.
Supplementary Material
Figure S1. the two-pool qMT model that includes a free water pool (A) and a macromolecular pool (B).
Figure S2. The simulated PSR and kex vs R1 based on a two-pool model. The R1 values were determined by fitting the SIR data to mono-exponential model.
Figure S3. The scheme of a typical three-pool model system for numerical simulations. This model includes intracellular (“A”), extracellular (“B”), and macromolecular (“C”) water pools. The model parameters and spin exchange are labeled.
Figure S4 The simulated PSR and kex vs R1 based on a three-pool model. Note that kBA is the transcytolemmal water exchange rate and the black lines represent the expected values.
Figure S5 The simulated PSR and kex vs R1 based on a four-pool model. The PSR was assume homogeneous everywhere inside tumors. Note that kBA is the transcytolemmal water exchange rate and the black lines represent the expected values.
Acknowledgments
This study was funded by National Institutes of Health (NIH) K25CA168936, R01CA109106, R01CA173593, R01EB000214, P50CA128323, R01EB017767, R01CA184693 and R21EB017873. The authors thank Ms Zou Yue for assistance in animal surgeries.
References
- 1.Wolff SD, Balaban RS. Magnetization transfer contrast (MTC) and tissue water proton relaxation in vivo. Magn Reson Med. 1989;10:135–44. doi: 10.1002/mrm.1910100113. [DOI] [PubMed] [Google Scholar]
- 2.Filippi M, Rocca Ma. Magnetization transfer magnetic resonance imaging in the assessment of neurological diseases. J neuroimaging. 2004;14:303–13. doi: 10.1177/1051228404265708. [DOI] [PubMed] [Google Scholar]
- 3.Boss A, Martirosian P, Küper K, Fierlbeck G, Claussen CD, Schick F. Whole-body magnetization transfer contrast imaging. J Magn Reson imaging. 2006;24:1183–7. doi: 10.1002/jmri.20754. [DOI] [PubMed] [Google Scholar]
- 4.Niemi P, Kurki T, Lundbom N, Kormano M. Magnetization transfer contrast in Gd-DTPA-enhanced imaging of brain tumors. Invest Radiol. 1991;26 (Suppl 1):S248–9. doi: 10.1097/00004424-199111001-00084. discussion S253–4. [DOI] [PubMed] [Google Scholar]
- 5.Quesson B, Bouzier AK, Thiaudiere E, Delalande C, Merle M, Canioni P. Magnetization transfer fast imaging of implanted glioma in the rat brain at 4.7 T: interpretation using a binary spin-bath model. J Magn Reson imaging. 1997;7:1076–1083. doi: 10.1002/jmri.1880070621. [DOI] [PubMed] [Google Scholar]
- 6.Kumar V, Jagannathan NR, Kumar R, Thulkar S, Gupta SD, Hemal AK, Gupta NP. Evaluation of the role of magnetization transfer imaging in prostate: a preliminary study. Magn Reson Imaging. 2008;26:644–9. doi: 10.1016/j.mri.2008.01.030. [DOI] [PubMed] [Google Scholar]
- 7.Li W, Zhang Z, Nicolai J, Yang G-Y, Omary RA, Larson AC. Magnetization transfer MRI in pancreatic cancer xenograft models. Magn Reson Med. 2012;68:1291–7. doi: 10.1002/mrm.24127. [DOI] [PMC free article] [PubMed] [Google Scholar]
- 8.Abramson RG, Arlinghaus LR, Weis JA, Li X, Dula AN, Chekmenev EY, Smith SA, Miga MI, Abramson VG, Yankeelov TE. Current and emerging quantitative magnetic resonance imaging methods for assessing and predicting the response of breast cancer to neoadjuvant therapy. Breast Cancer (London) 2012;2012:139–154. doi: 10.2147/BCTT.S35882. [DOI] [PMC free article] [PubMed] [Google Scholar]
- 9.Henkelman RM, Huang X, Xiang QS, Stanisz GJ, Swanson SD, Bronskill MJ. Quantitative interpretation of magnetization transfer. Magn Reson Med. 1993;29:759–66. doi: 10.1002/mrm.1910290607. [DOI] [PubMed] [Google Scholar]
- 10.Sled JG, Pike GB. Quantitative interpretation of magnetization transfer in spoiled gradient echo MRI sequences. J Magn Reson. 2000;145:24–36. doi: 10.1006/jmre.2000.2059. [DOI] [PubMed] [Google Scholar]
- 11.Gochberg DF, Kennan RP, Gore JC. Quantitative studies of magnetization transfer by selective excitation and T1 recovery. Magn Reson Med. 1997;38:224–31. doi: 10.1002/mrm.1910380210. [DOI] [PubMed] [Google Scholar]
- 12.Soellinger M, Langkammer C, Seifert-Held T, Fazekas F, Ropele S. Fast bound pool fraction mapping using stimulated echoes. Magn Reson Med. 2011;66:717–24. doi: 10.1002/mrm.22846. [DOI] [PMC free article] [PubMed] [Google Scholar]
- 13.Gloor M, Scheffler K, Bieri O. Quantitative magnetization transfer imaging using balanced SSFP. Magn Reson Med. 2008;60:691–700. doi: 10.1002/mrm.21705. [DOI] [PubMed] [Google Scholar]
- 14.Ramani A, Dalton C, Miller DH, Tofts PS, Barker GJ. Precise estimate of fundamental in-vivo MT parameters in human brain in clinically feasible times. Magn Reson Imaging. 2002;20:721–731. doi: 10.1016/s0730-725x(02)00598-2. [DOI] [PubMed] [Google Scholar]
- 15.Yarnykh VL. Pulsed Z-spectroscopic imaging of cross-relaxation parameters in tissues for human MRI: theory and clinical applications. Magn Reson Med. 2002;47:929–939. doi: 10.1002/mrm.10120. [DOI] [PubMed] [Google Scholar]
- 16.Portnoy S, Stanisz GJ. Modeling pulsed magnetization transfer. Magn Reson Med. 2007;58:144–155. doi: 10.1002/mrm.21244. [DOI] [PubMed] [Google Scholar]
- 17.Gochberg DF, Gore JC. Quantitative imaging of magnetization transfer using an inversion recovery sequence. Magn Reson Med. 2003;49:501–505. doi: 10.1002/mrm.10386. [DOI] [PubMed] [Google Scholar]
- 18.Gochberg DF, Gore JC. Quantitative magnetization transfer imaging via selective inversion recovery with short repetition times. Magn Reson Med. 2007;57:437–441. doi: 10.1002/mrm.21143. [DOI] [PMC free article] [PubMed] [Google Scholar]
- 19.Xu J, Li K, Zu Z, Li X, Gochberg DF, Gore JC. Quantitative magnetization transfer imaging of rodent glioma using selective inversion recovery. NMR Biomed. 2014;27:253–260. doi: 10.1002/nbm.3058. [DOI] [PMC free article] [PubMed] [Google Scholar]
- 20.Dortch RD, Li K, Gochberg DF, Welch EB, Dula AN, Tamhane AA, Gore JC, Smith SA. Quantitative magnetization transfer imaging in human brain at 3 T via selective inversion recovery. Magn Reson Med. 2011;66:1346–1352. doi: 10.1002/mrm.22928. [DOI] [PMC free article] [PubMed] [Google Scholar]
- 21.Dortch RD, Moore J, Li K, Jankiewicz M, Gochberg DF, Hirtle JA, Gore JC, Smith SA. Quantitative magnetization transfer imaging of human brain at 7 T. Neuroimage. 2013;64:640–649. doi: 10.1016/j.neuroimage.2012.08.047. [DOI] [PMC free article] [PubMed] [Google Scholar]
- 22.Harrison R, Bronskill MJ, Henkelman RM. Magnetization transfer and T2 relaxation components in tissue. Magn Reson Med. 1995;33:490–6. doi: 10.1002/mrm.1910330406. [DOI] [PubMed] [Google Scholar]
- 23.Stanisz GJ, Kecojevic A, Bronskill MJ, Henkelman RM. Characterizing white matter with magnetization transfer and T(2) Magn Reson Med. 1999;42:1128–36. doi: 10.1002/(sici)1522-2594(199912)42:6<1128::aid-mrm18>3.0.co;2-9. [DOI] [PubMed] [Google Scholar]
- 24.Levesque IR, Pike GB. Characterizing healthy and diseased white matter using quantitative magnetization transfer and multicomponent T(2) relaxometry: A unified view via a four-pool model. Magn Reson Med. 2009;62:1487–96. doi: 10.1002/mrm.22131. [DOI] [PubMed] [Google Scholar]
- 25.Bjarnason TA, Vavasour IM, Chia CLL, MacKay AL. Characterization of the NMR behavior of white matter in bovine brain. Magn Reson Med. 2005;54:1072–81. doi: 10.1002/mrm.20680. [DOI] [PubMed] [Google Scholar]
- 26.Tozer DJ, Rees JH, Benton CE, Waldman AD, Jäger HR, Tofts PS, Jager HR. Quantitative magnetisation transfer imaging in glioma: preliminary results. NMR Biomed. 2011;24:492–498. doi: 10.1002/nbm.1614. [DOI] [PubMed] [Google Scholar]
- 27.Underhill HR, Rostomily RC, Mikheev AM, Yuan C, Yarnykh VL. Fast bound pool fraction imaging of the in vivo rat brain: association with myelin content and validation in the C6 glioma model. Neuroimage. 2011;54:2052–2065. doi: 10.1016/j.neuroimage.2010.10.065. [DOI] [PMC free article] [PubMed] [Google Scholar]
- 28.Xu J, Li K, Smith RA, Waterton JC, Zhao P, Chen H, Does MD, Manning HC, Gore JC. Characterizing tumor response to chemotherapy at various length scales using temporal diffusion spectroscopy. PLoS One. 2012;7:e41714. doi: 10.1371/journal.pone.0041714. [DOI] [PMC free article] [PubMed] [Google Scholar]
- 29.Colvin DC, Jourquin J, Xu J, Does MD, Estrada L, Gore JC. Effects of intracellular organelles on the apparent diffusion coefficient of water molecules in cultured human embryonic kidney cells. Magn Reson Med. 2011;65:796–801. doi: 10.1002/mrm.22666. [DOI] [PMC free article] [PubMed] [Google Scholar]
- 30.Xu J, Xie J, Jourquin J, Colvin DC, Does MD, Quaranta V, Gore JC. Influence of cell cycle phase on apparent diffusion coefficient in synchronized cells detected using temporal diffusion spectroscopy. Magn Reson Med. 2011;65:920–926. doi: 10.1002/mrm.22704. [DOI] [PMC free article] [PubMed] [Google Scholar]
- 31.Nilsson M, Lätt J, van Westen D, Brockstedt S, Lasič S, Ståhlberg F, Topgaard D. Noninvasive mapping of water diffusional exchange in the human brain using filter-exchange imaging. Magn Reson Med. 2013;69:1573–81. doi: 10.1002/mrm.24395. [DOI] [PubMed] [Google Scholar]
- 32.Bailey C, Giles A, Czarnota GJ, Stanisz GJ. Detection of apoptotic cell death in vitro in the presence of Gd-DTPA-BMA. Magn Reson Med. 2009;62:46–55. doi: 10.1002/mrm.21972. [DOI] [PubMed] [Google Scholar]
- 33.Li K, Zu Z, Xu J, Janve VA, Gore JC, Does MD, Gochberg DF. Optimized inversion recovery sequences for quantitative T1 and magnetization transfer imaging. Magn Reson Med. 2010;64:491–500. doi: 10.1002/mrm.22440. [DOI] [PMC free article] [PubMed] [Google Scholar]
- 34.Cercignani M, Barker GJ. A comparison between equations describing in vivo MT: the effects of noise and sequence parameters. J Magn Reson. 2008;191:171–83. doi: 10.1016/j.jmr.2007.12.012. [DOI] [PMC free article] [PubMed] [Google Scholar]
- 35.Quirk JD, Bretthorst GL, Duong TQ, Snyder AZ, Springer CS, Ackerman JJH, Neil JJ. Equilibrium water exchange between the intra- and extracellular spaces of mammalian brain. Magn Reson Med. 2003;50:493–9. doi: 10.1002/mrm.10565. [DOI] [PubMed] [Google Scholar]
- 36.Xu J, Zaiss M, Zu Z, Li H, Xie J, Gochberg DF, Bachert P, Gore JC. On the origins of chemical exchange saturation transfer (CEST) contrast in tumors at 9.4 T. NMR Biomed. 2014;27:406–416. doi: 10.1002/nbm.3075. [DOI] [PMC free article] [PubMed] [Google Scholar]
- 37.Morrison C, Mark Henkelman R. A Model for Magnetization Transfer in Tissues. Magn Reson Med. 1995;33:475–482. doi: 10.1002/mrm.1910330404. [DOI] [PubMed] [Google Scholar]
- 38.Barth RF, Kaur B. Rat brain tumor models in experimental neuro-oncology: the C6, 9L, T9, RG2, F98, BT4C, RT-2 and CNS-1 gliomas. J Neurooncol. 2009;94:299–312. doi: 10.1007/s11060-009-9875-7. [DOI] [PMC free article] [PubMed] [Google Scholar]
Associated Data
This section collects any data citations, data availability statements, or supplementary materials included in this article.
Supplementary Materials
Figure S1. the two-pool qMT model that includes a free water pool (A) and a macromolecular pool (B).
Figure S2. The simulated PSR and kex vs R1 based on a two-pool model. The R1 values were determined by fitting the SIR data to mono-exponential model.
Figure S3. The scheme of a typical three-pool model system for numerical simulations. This model includes intracellular (“A”), extracellular (“B”), and macromolecular (“C”) water pools. The model parameters and spin exchange are labeled.
Figure S4 The simulated PSR and kex vs R1 based on a three-pool model. Note that kBA is the transcytolemmal water exchange rate and the black lines represent the expected values.
Figure S5 The simulated PSR and kex vs R1 based on a four-pool model. The PSR was assume homogeneous everywhere inside tumors. Note that kBA is the transcytolemmal water exchange rate and the black lines represent the expected values.