Abstract
Goal
In K-edge tomographic imaging with photon counting detectors, the energy window width of photon counting detectors significantly affects the signal-to-noise ratio (SNR) of measured intensity data and the contrast-to-noise ratio (CNR) of reconstructed images. In this paper, we present an optimization method to determine an optimal window width around a K-edge for optimal SNR and CNR.
Methods
An objective function is designed to describe SNR of the projection data based on the Poisson distribution of detected X-ray photons. Then, a univariate optimization method is applied to obtain an X-ray energy window width.
Results
Numerical simulations are performed to evaluate the proposed method, and the results show that the optimal energy window width obtained from the proposed method produces not only optimal SNR data in the projection domain but also optimal CNR values in the image domain.
Conclusions
The proposed method in the projection domain can determine an optimal energy window width for x-ray photon counting imaging, and achieve optimality in both projection and image domains.
Significance
Our study provides a practical way to determine the optimal energy window width of photon counting detectors, which helps improve contrast resolution for x-ray K-edge tomographic imaging.
Index Terms: X-ray CT, photon-counting detector, K-edge imaging, optimal energy window width, SNR, CNR
I Introduction
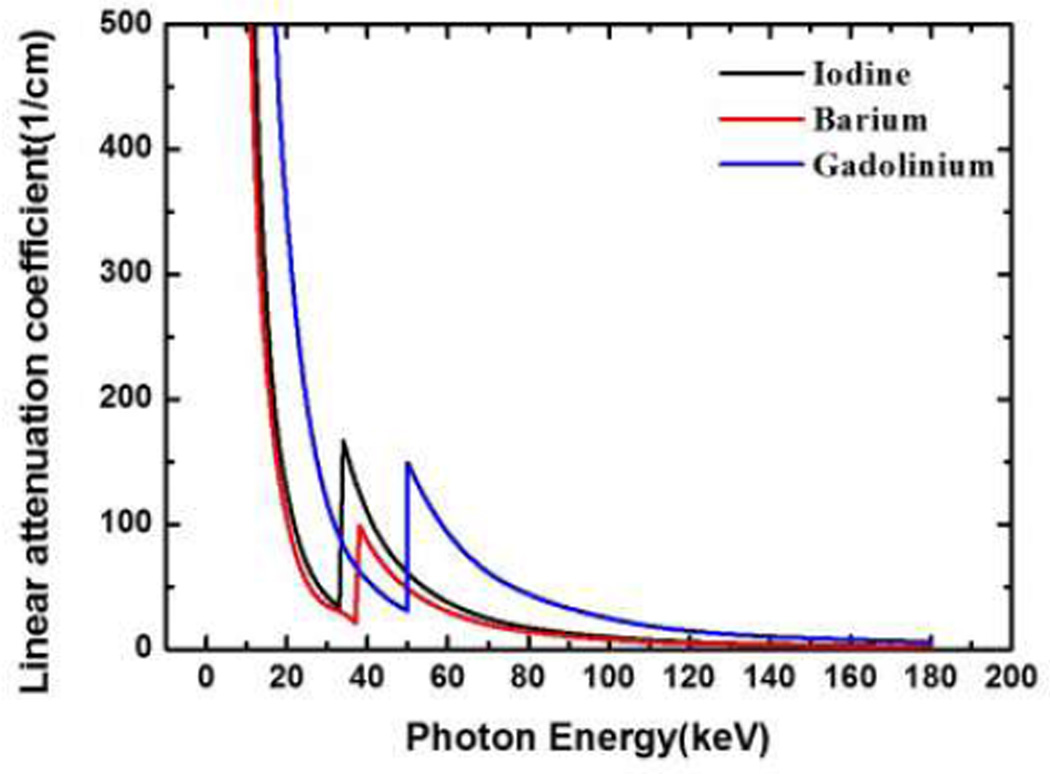
K-edge imaging has recently attracted much attention for material decomposition and other applications. The X-ray attenuation characteristic of matter is energy-dependent, and K-edge describes a sudden increase in the X-ray attenuation [1, 2]. K-edge imaging can be applied to identify and quantify elements with high atomic number Z within a specimen, an animal, or a patient. Some elements with a high-atomic number Z serve as contrast agents for diagnostic X-ray imaging, such as iodine, barium, gadolinium and gold solutions. They are promising contrast agents because of high attenuation contrast and relatively low toxicity, in particular when properly coated. The K-edges of iodine, barium, gadolinium, are 33keV, 37keV and 50keV, respectively, which are indicated in Fig. 1. A current focus in K-edge imaging research is to improve the detectability and quantification of those contrast agents in preclinical and clinical studies.
Fig. 1.
Linear attenuation coefficient curves for Iodine (black), Barium (red), and Gadolinium (blue) respectively.
The physical foundation of K-edge imaging is the strong energy dependence of a contrast element attenuation around a K-edge. The enabling technology is an energy-discriminating X-ray photon-counting detector [3]. With the emergence of X-ray photon counting detectors, there is a new opportunity to utilize K-edge characteristics of contrast agents for material decomposition. Photon-counting detectors are energy sensitive and discriminative with the ability to count individual X-ray photons in different energy windows, defined by various energy thresholds [4–8]. Hence, it is feasible to capture X-ray photons on two sides of a K-edge respectively.
In the absence of a K-edge, a linear attenuation coefficient can be decomposed into two components: Compton and Photoelectric effects [9–11]. Roessl et al. modified this formulation in the presence of a substance with a K-edge [12–14]. The optimization of the energy thresholds is clearly important for K-edge imaging. An initial effort was made by He et al. to optimize K-edge imaging in the image domain [15, 16]. This method needs to use reconstructed images for determination of the optimal energy window widths. This procedure is often difficult to perform in many applications.
In this paper, we propose a new criterion to determine an energy window for optimal contrast resolution and signal-to-noise ratio (SNR). In the next section, we will describe our approach for energy window determination. In the third section, we report numerical simulation results. In the last section, we discuss relevant issues and conclude the paper.
II. Spectral window optimization in K-edge imaging
To perform structural or functional imaging of biological tissues with high contrast, contrast agents offer excellent contrast resolution in image reconstruction, and are extensively employed in practice. For example, iodine, barium, and gadolinium solutions are important agents for K-edge imaging, and have a long history in a wide range of biomedical applications as contrast enhancers for X-ray imaging. The attenuation coefficients of several kinds of contrast agents are available for different X-ray energies in the databases released by the National Institute of Standards and Technology (NIST) [17]. Hence, for a specific width of the energy window, we can compute the average attenuation coefficient within the energy window before and after the K-edge jump:
| (1) |
| (2) |
where μ(E) is the attenuation coefficient of a contrast agent (such as gadolinium, iodine, etc.) at energy E, K− and K+ are the energy levels right before and after the sudden increment in linear attenuation, respectively. Hence, the attenuation contrast between the left and right energy windows is formulated as
| (3) |
From (3), the attenuation contrast μcontrast(ω) relies on the energy window width, and is monotonically decreasing with respect to the variable ω. In fact, the derivative of μcontrast(ω) can be expressed as
| (4) |
With the K-edge characteristics of a contrast agent, the attenuation coefficient is monotonically decreasing in the left and right energy windows of the K-edge, respectively, as shown in Fig. 1. Hence, we have
| (5) |
and
| (6) |
In other words, the narrower the energy window width, the larger the linear attenuation coefficient difference across the K-edge, and the higher the contrast (as defined in equation (3)), not considering any noise arguments [18]. The appropriate energy window selection around the K-edge jump is a key step for X-ray spectral imaging. A narrower energy window gives a better contrast than a wider energy window [19]. However, narrower windows would result in fewer photons to be detected in each energy window, significantly reducing the image signal-to-noise ratio (SNR). Thus, we need to find an optimal width of the energy window to achieve the best contrast-to-noise (CNR) ratio, or the best combination of high contrast and low noise.
All the above arguments are related to the image domain and don’t consider the actual CT measurements and the reconstruction process. In the X-ray K-edge imaging process, the X-ray intensity recorded by photon counting detectors in left and right energy windows can be respectively formulated as
| (7) |
| (8) |
where I0(E) is the number of photons emitted from an X-ray source, μ(r, E) is the distribution of attenuation coefficients of an object, ω is energy window width of the left and right windows of a K-edge.
In this study, we assume that the same energy window width ω is used for both the left and right sides of the K-edge, the contrast agent distribution in an object can be reconstructed based on the following equation (see [20] for a detailed derivation) :
| (9) |
where and and normalized X-ray intensities recorded with photon counting detectors for the left and right energy windows respectively, μtissue(r, E) is the distribution of attenuation coefficients of the background of object, μAgent(E) is the contrast agent attenuation coefficient, and αAgent(r) is the contrast agent volume fraction [21, 22].
The first term represents actual measurements. As detailed in [20], ĪL and ĪR are the normalized measured X-ray intensities left and right of the K-edge. The second term is a correction term to eliminate the contribution from all other structures (other than the contrast agent). μtissue(r, E) can either be estimated from a first scan without contrast agent or can be computed by alternating minimization. The right-hand side of (9) is the Radon transform of the contrast agent volume fraction, weighted by W(r). Using an inverse Radon transform method, the image W(r)αAgent(r) can be reconstructed from the projection values computed by the left-hand side of (9), from measured data obtained from K-edge imaging. After reconstructing W(r)αAgent(r), we can divide by W(r) to obtain the contrast agent volume fraction image αAgent(r).
We now present a quantitative analysis for the SNR related to the energy window width. When an X-ray source irradiates an object, the number of detected photons is a random variable, obeying a Poisson distribution [23]. Hence, the number of detected photons IL within a left energy window of the K-edge can be expressed by a Poisson distribution with a mean value and the number of detected photons IR within a right energy window of the K-edge also obeys a Poisson distribution with a mean value . To achieve the optimal signal-to-noise ratio (SNR) of the measured signal for image reconstruction, we define the SNR in the projection domain as
| (10) |
where
| (11) |
| (12) |
From (13), the SNR is a function of the energy window width ω and the attenuation background μtissue(r, E). In other words, for a given X-ray source spectrum and attenuation background, SNR(ω) can be estimated and maximized with respect to the window width ω. Similar to the image-domain contrast μcontrast(ω), the projection-domain contrast or the difference in attenuation left and right of the K-edge
| (13) |
ln(ĪL) − ln(ĪR) depends on the energy window width and is monotonically decreasing with respect to the variable ω. When the energy window width becomes sufficiently larger, the normalized number of photons acquired in the left energy window would be less than that in the right energy window, so the calculated attenuation would be higher than that in the right energy window, leading to a negative SNR value. On the other hand, when the energy window width is very small, the number of photons acquired in each energy window would yield a very high standard deviation in the noise level. Clearly, there is an optimal energy window width ω over the range of (0, ωmax) so that SNR(ω) reaches a maximum value, where ωmax is a maximum energy window width, as we will demonstrate numerically in the next section.
Empirically (in reference to Fig. 3), Eq. (13) seems a convex function which can be effectively solved via a univariate optimization process, such as a Quadratic Interpolation Search used in our implementation [24]. The main steps for each iteration of this optimization process deal with several objective functions, which are listed as follows:
Step 1: Given an energy window width ω, calculate λ̅L and λ̅R from Eqs. (11) and (12), which are the normalized mean photon numbers detected by detectors respectively in the left and right energy windows of photon counting detectors;
- Step 2: Calculate the Poisson distribution:
k =1, 2, …; Step 3: Take results from Steps 1 and 2 into Eq. (13) to calculate the objective function SNR(ω).
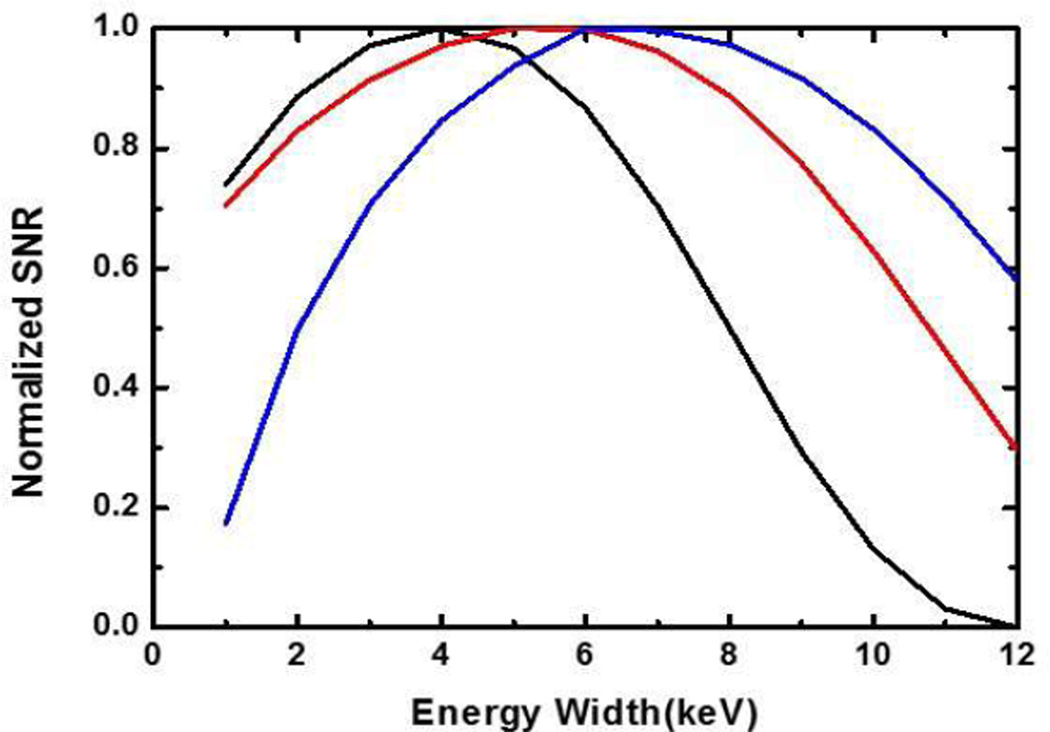
Fig. 3.
Curves between the energy window width (x-axis) and the normalized SNR (y-axis). Each of the three contrast agents has its optimal energy window width for the maximum SNR: for 0.9% iodine solution (black), the optimal width is 3.9keV; for 1.5% barium solution (red), the optimal width is 5.4keV; and for 0.5% Gadolinium solution (blue), the optimal width is 6.299keV.
III. Numeric simulations
A. One-dimensional experiment
We assumed a simplified situation with a representative attenuation scenario and a single x-ray beam. We consider a total path length L, a path length through tissue only (L1 and L3) and a certain path length through tissue with contrast (L2), as shown in Fig. 2. Note that the order in which the different tissues occur does not impact the result. While this is only a 1D analysis, it is representative for a 2D or 3D scenario with a circle-symmetric or cylinder-symmetric phantom. It can also be used based on the average path lengths of a 2D or 3D geometry. Later in this paper, we will show that the 1D results are well correlated to the more complicated 2D and 3D results.
Fig. 2.
A representative one-dimensional attenuation scenario.
With Iodine, Barium, and Gadolinium contrast agents as examples, we numerically studied the objective function SNR(ω) for different energy window widths. The volume fractions of these contrast agents were chosen based on the biomedical imaging literature [15, 25–28]: 0.9 % for Iodine, 1.5 % for Barium and 0.5 % for Gadolinium. We performed the optimization of the energy window width for photon counting detectors at a representative projection path. We assumed a total path length L of 20 cm and a contrast path length L2 of 4 cm. In this case, the expected numbers of photons λL and λR are only related to the tissue thickness and the contrast length, which are defined as: dtissue = μ̅tissue × [L1 + L3 + (1 − ρ)L2]= μ̅tissue × [L − ρL2] and dagent = μ̅agent × ρ × L2 respectively. The average attenuation coefficients of tissue and contrast agents below the K-edge are and respectively, and ρ is the concentration of the contrast agent. For different energy window widths, we computed the expected numbers of attenuated photons λL and λR in the left and right energy windows for a projection, and SNR (ω) in (13). The variation curves of SNR (ω) for contrast agents Iodine, Barium, and Gadolinium are shown in Fig. 3. The objective functions SNR (ω) are concave, and the optimal energy window width can be easily found using a univariate optimization method. We found the optimal energy widths to be 3.9keV, 5.4keV and 6.299keV, respectively.
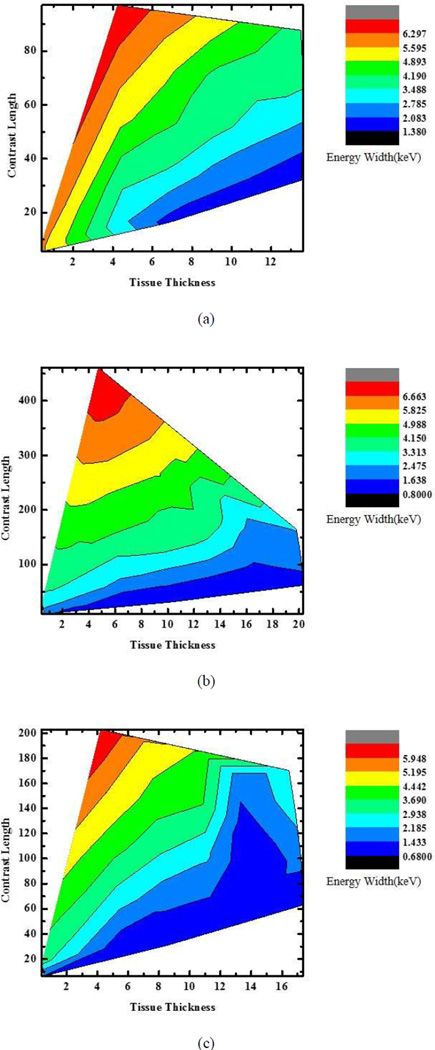
We also numerically evaluated the optimal energy widths by computing the SNR from a large number of noise realizations. From the numerical data, the relationships are plotted between the optimal energy width, the tissue length, and the contrast agent length for gadolinium, iodine, and barium solutions respectively. Fig. 4 presents a 2D plot showing the optimal energy window width as a function of the total tissue path length and the contrast agent path length. First of all, Fig. 4 serves as a guideline for selecting not only the energy window width but also the type of contrast agent in a specific application. In a real application, we can setup a database to optimize K-edge imaging with photon-counting detectors. Also, Fig.4 can tell which situation is effective for K-edge reconstruction. It can be seen in Fig. 4 that with the increase of contrast length, which will result in the increase of photon attenuation, the optimal energy width will grow for a sufficiently strong signal. When tissue thickness is too large relative to contrast length for a specific contrast agent, the effect of the K-edge becomes weak for reconstruction of the contrast agent distribution.
Fig. 4.
2D Plots for the optimal energy widths with respect to tissue thickness and contrast length. (a)–(c) Optimal energy width plots for gadolinium, iodine, and barium solutions, respectively.
B. Cylindrical phantom
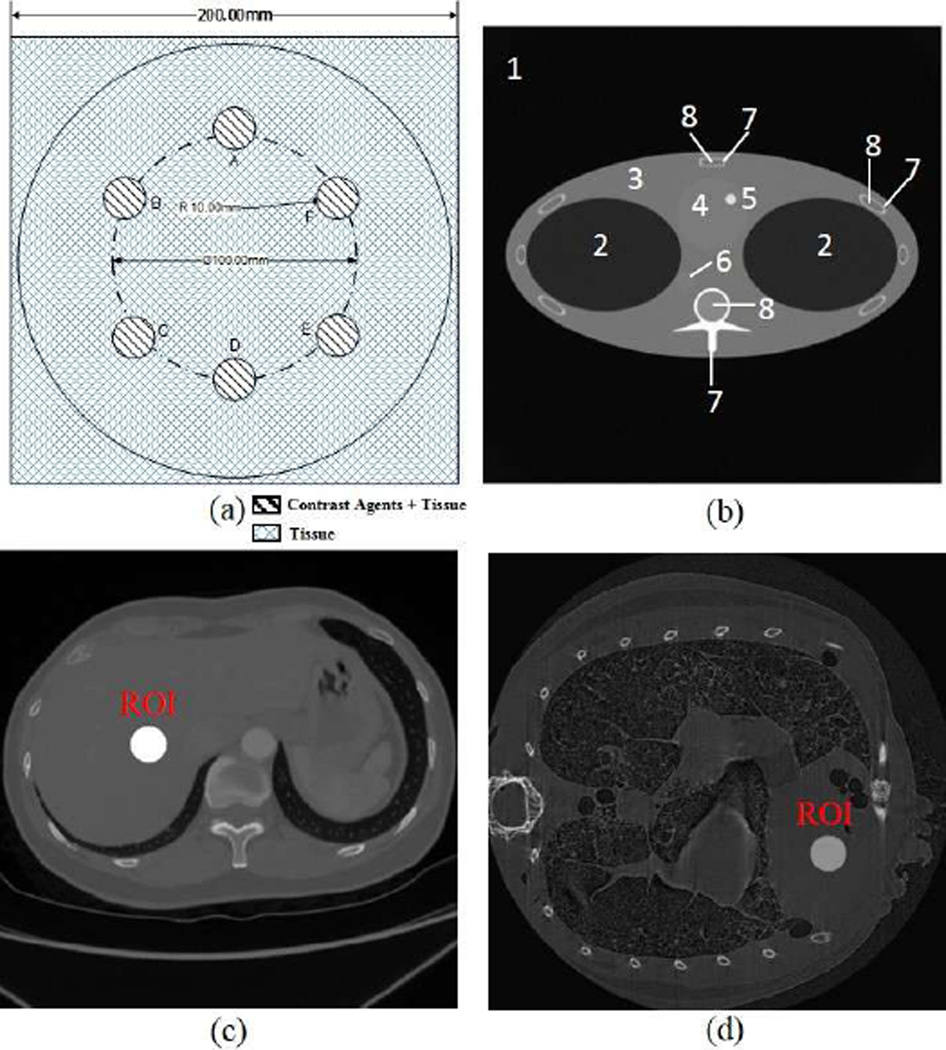
In the next part, we show that the optimal energy widths selected using the above-described approach in the projection domain are closely correlated to the results after image reconstruction. First, we used three tissue-simulating phantoms (phantoms 1, 2, 3) to test the approach with three contrast agents respectively. The cylindrical phantoms have 20cm diameter and 20cm height and have six embedded tubes of 2cm diameter, filled with tissue and contrast agent solution, as shown in Fig. 5. The design of this phantom is to mimic simple biological samples with different contrast agents.
Fig. 5.
Numerical simulation phantoms; (a) a numerical tissue-simulating phantom with six embedded contrast tubes (Phantom 1, 2, 3), (b) the FORBILD thorax phantom (phantom 4), where the sub region are defined in table I, (c) a numerical human body phantom with a contrast enhanced region of 4cm diameter (phantom 5), and (d) a numerical mouse phantom with a contrast enhanced region of 0.2cm diameter (phantom 6).
A GE Maxiray125 source with a 140kV and 80kV spectra respectively was utilized in the simulation, which was modeled using a free program (Spectrum GUI). The tube was equipped with a 3.0mm Al filter [29]. The photon counting detectors measured X-ray intensities in spectral windows around each K-edge.
The detector efficiency η(E) was 90% and X-rays irradiated a cross-section of the phantom. The cross-section was discretized into a 512×512 matrix for image reconstruction. Parallel-beam projections were acquired over a 180o range with a 0.5o angular increment in every energy window. Each projection was covered by 512 detector cells. To perform K-edge imaging, the filtered back projection (FBP) method was employed. The image quality was quantified with CNR. The CNR is defined as [23]:
| (14) |
where αC and αB are respectively mean reconstructed concentration of the contrast agent and background regions, and σB is the standard deviation of the background in the reconstructed concentration image.
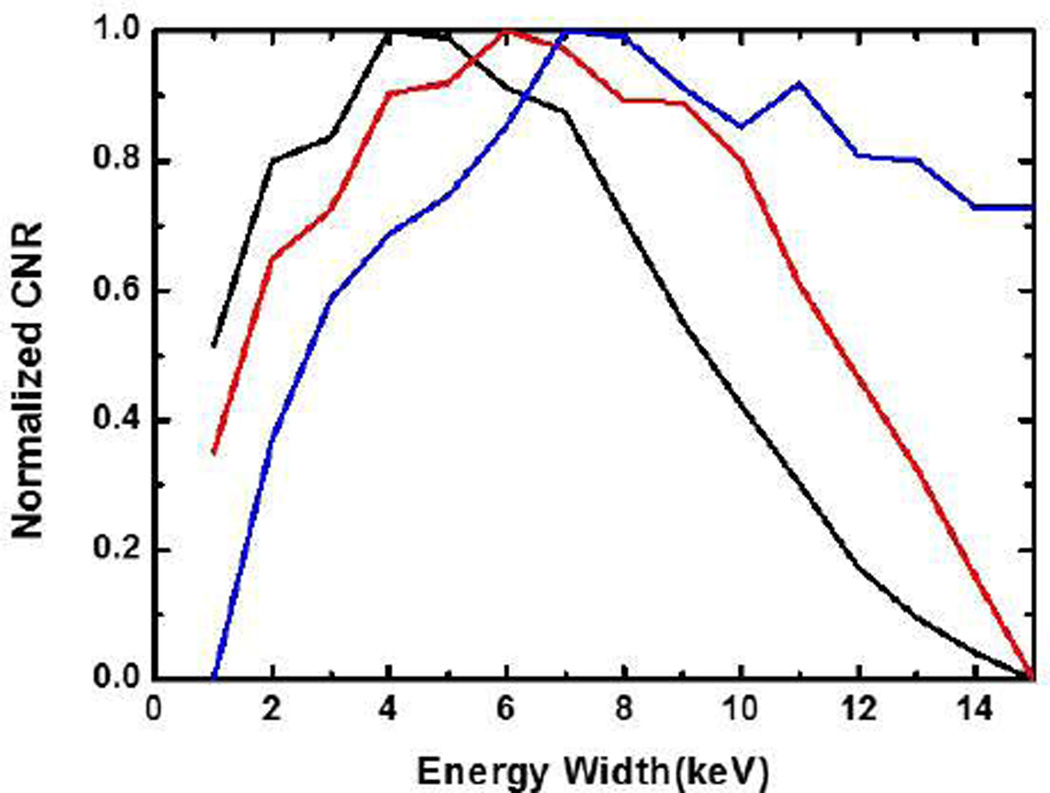
We tested with different contrast agents in phantoms 1, 2, and 3 respectively, and calculated CNR values in the tubes containing different contrast agents in the K-edge tomographic images. According to the above-described optimization scheme, we found that the optimal energy window widths would be 5.4keV for 1.5% barium solution, 3.9keV for 0.9% iodine solution and 6.299keV for 0.5% gadolinium solution. It can be seen in Fig. 6 that the maximum values of all the CNRs for different contrast solutions are reached around the optimal window widths calculated according to the SNR in the projection domain. Also, Fig. 6 indicates that our results from the projection domain analysis are consistent with the image domain observation.
Fig. 6.
Normalized CNR values for the tubes containing different contrast agents. The energy window widths in accordance with the maximum CNR are 4keV for 0.9% iodine solution (black), 6.1keVfor 1.5% barium solution (red), and 7.1keV for 0.5% gadolinium solution (blue) respectively.
C. Anthropomorphic phantoms
To verify our optimization method in a realistic situation, we used a new simulation environment for x-ray computed tomography, called CatSim, which was developed by GE Global Research Center. CatSim incorporates polychromaticity, realistic quantum and electronic noise models, finite focal spot size and shape, finite detector cell size, detector cross-talk, detector lag or afterglow, bowtie filtration, detector efficiency, non-linear partial volume, scatter (variance-reduced Monte Carlo), and absorbed dose [30]. The CatSim simulation model is given by Eq. (15):
| (15) |
where yi is the detector signal with a sinogram index i, k is the energy index, s is the beam sub-sampling index, Aik is the number of photons arriving at the detector without attenuator in the energy bin indexed by k, liso is the intersection length between the line with an index s and an object with an index o, μok is the linear attenuation coefficient of the object o in the energy bin k, is the scatter signal, computed by the Monte Carlo simulation, DQE is the detector quantum efficiency, fCONV is a factor to convert from keV to the number of electrons, and σelectronic is the standard deviation of the electronic noise [30]. Photon counting detectors have the additional benefit of being less sensitive to electronic noise, by using a threshold to discriminate charge pulses from the noise floor of the detector and associated electronics [31]. While electronic noise will alter the energy attributed to a given x-ray photon, the number of counts is preserved and photon-counting detectors are expected to maintain better overall low-signal performance.
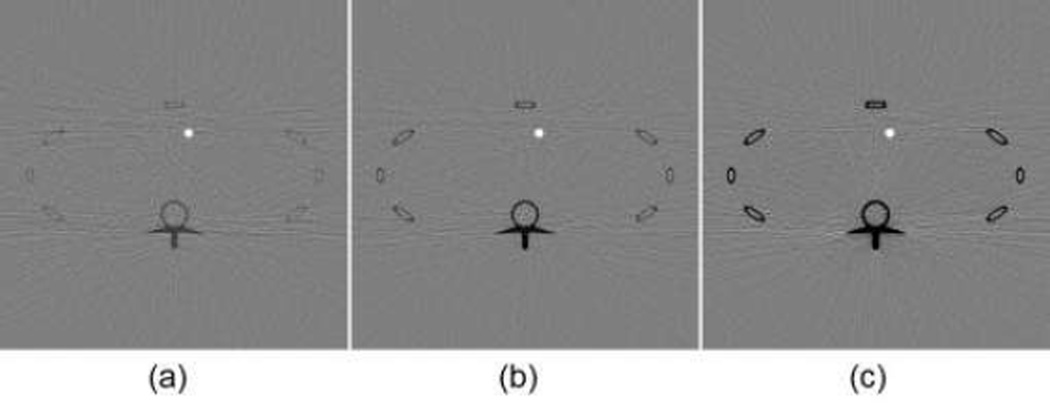
In this simulation, we used the FORBILD thorax phantom (phantom 4) with a 1.5% Gadolinium solution enhanced region in the heart area [32]. The phantom was of 40cm × 40cm with an enhanced region of 1cm in diameter. We performed a numerical simulation with phantom 4 [30]. For the phantom 4, the energy width were respectively set to 2keV, 5keV (optimal width), 15keV for 1.5% gadolinium solution. Concentration maps were produced with those energy window widths, as shown in Fig. 7. The CNR of the concentration map with the 5keV energy window width was 16.4305, which is better than CNRs associated with the energy window widths of 2keV and 15keV. Therefore, our optimization method seems working well in a realistic situation with most actual factors incorporated.
Fig. 7.
K-edge tomographic concentration images containing 1.5% gadolinium solution. (a) The image corresponding to energy width of 2keV with CNR of 9.8129; (b) the image corresponding to 5keV (optimal width) with CNR of 16.4305; and (c) the image corresponding to 15keV with CNR of 15.1031. The display window is [−5e-3, 5e-3]
Then, we used a human body phantom (phantom 5) and a mouse phantom (phantom 6) to test the approach in clinical and preclinical scenarios respectively. Both the human body phantom of 40cm × 40cm and the mouse phantom of 2.5cm ×2.5cm were discretized in a 512 × 512 matrix. The human body phantom contains liver, tissue, lung, and vertebra regions, as well as a contrast enhanced region of 4cm diameter. The mouse phantom contains heart, lung, and tissue regions, along with a contrast enhanced region of 0.2cm diameter. Gadolinium solution (0.5%) was used as the contrast agent to analyze the K-edge based concentration reconstruction in an ROI inside the liver region in the clinical application, and another ROI inside the heart region in the preclinical application.
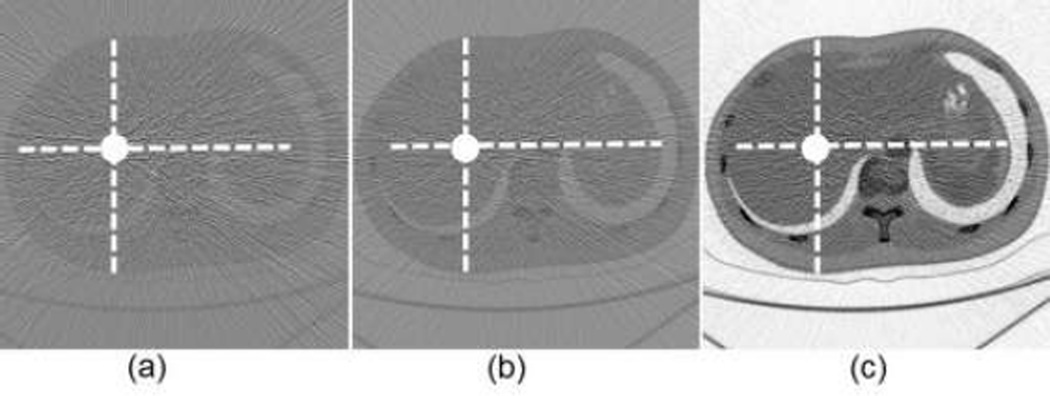
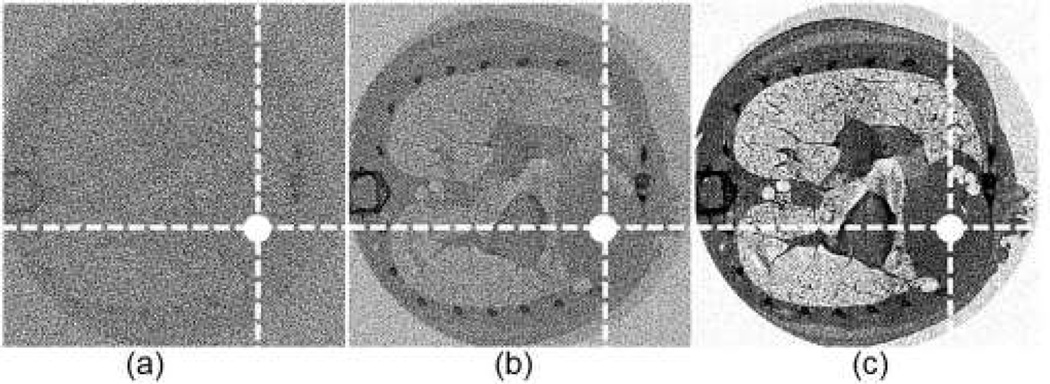
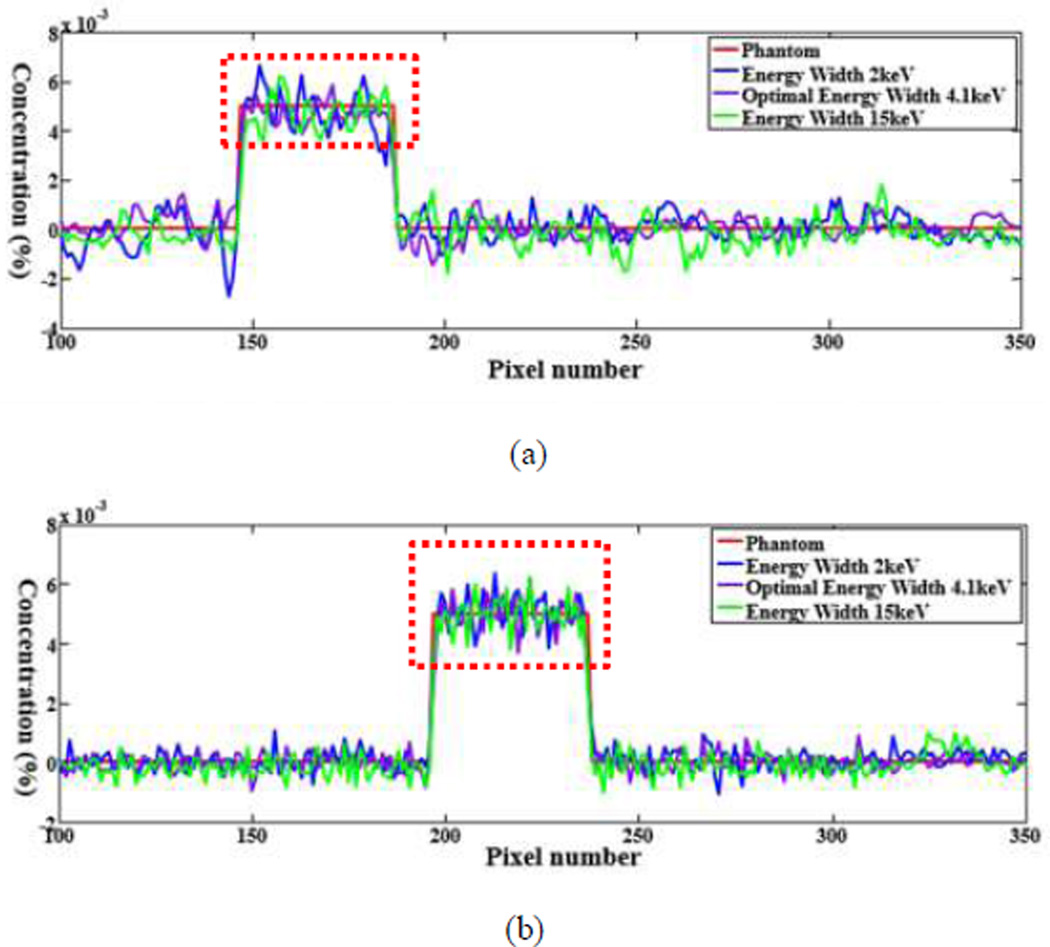
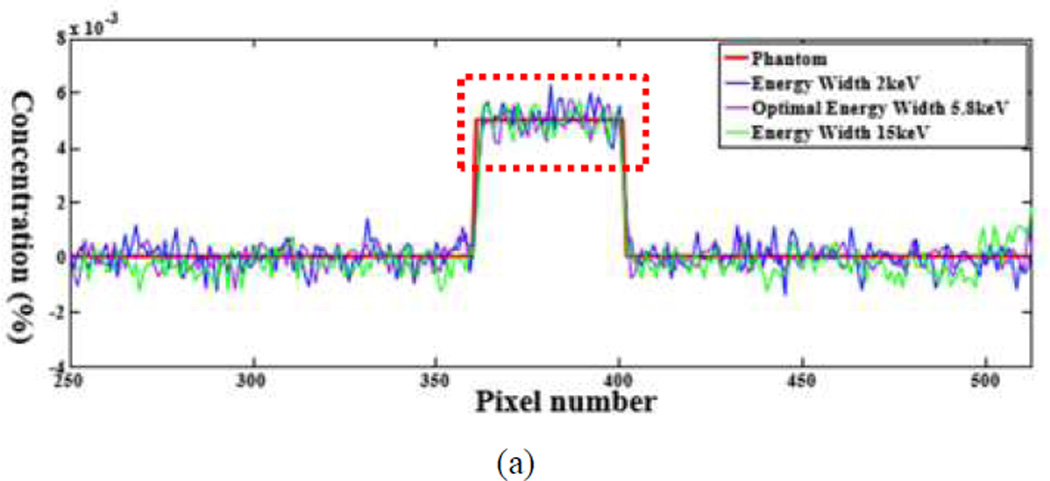
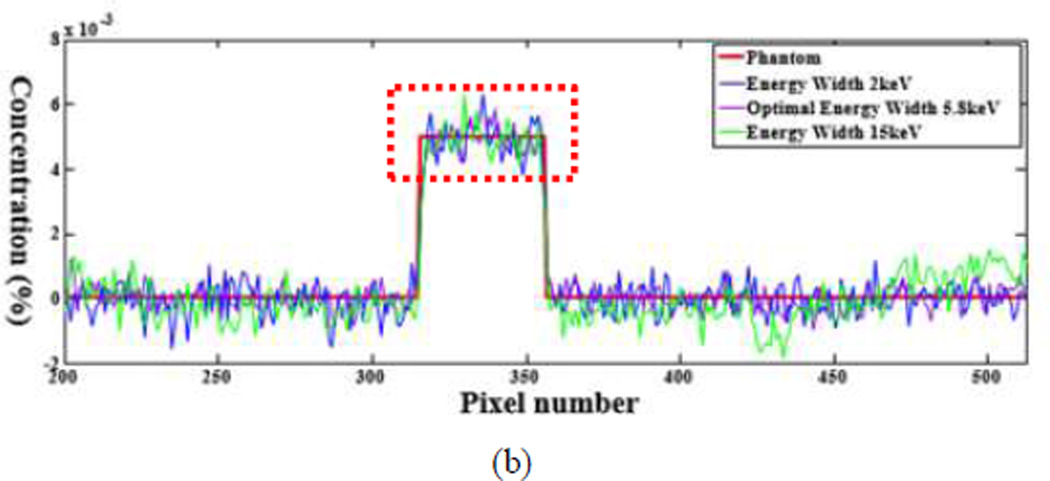
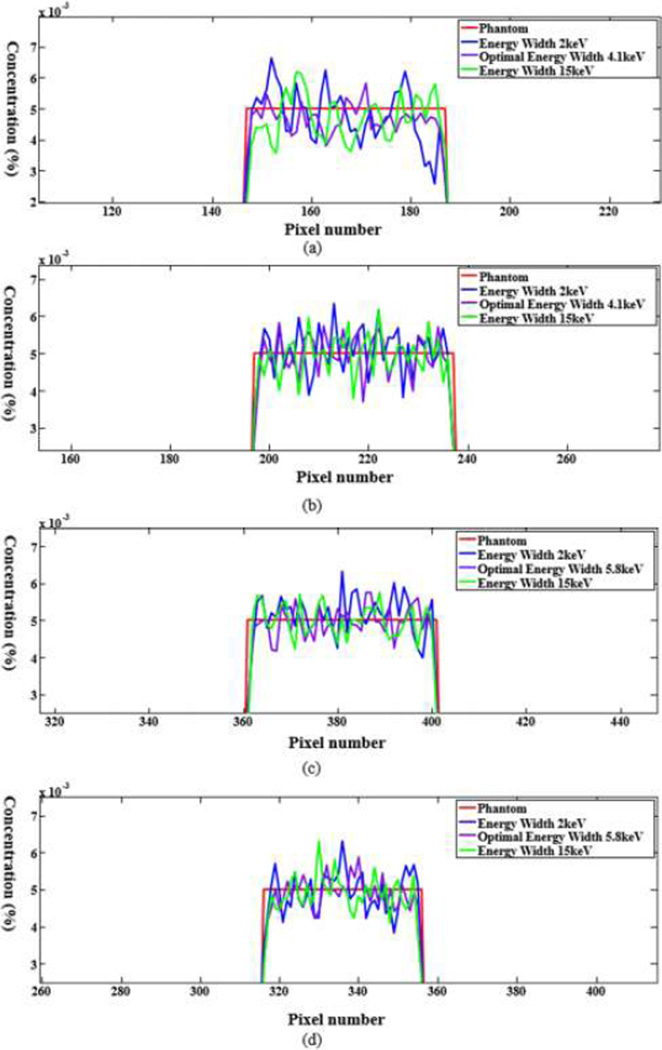
The numerical evaluation was performed with phantoms 5 and 6. For the phantom 5, the energy window widths were respectively set to 2keV, 4.1keV (optimal width), 15keV for 0.5% gadolinium solution. For the phantom 6, the energy window widths were 2keV, 5.8keV (optimal width), 15keV for 0.5% gadolinium solution. All the candidate window widths were used to perform the concentration mapping as shown in Figs.8 and 10. The corresponding plotted profiles are shown along the broken lines in Figs. 9 and 11. For better visualization, Fig. 12 gives a zoomed presentation demonstrating details indicated by the red boxes in Figs. 9 and 11.
Fig. 8.
K-edge tomographic concentration images containing 0.5% gadolinium solution. (a) The image corresponding to energy width of 2keV; (b) the image corresponding to 4.1keV (optimal width) with; and (c) the image corresponding to 15keV. The display window is [−1e-3, 1e-3].
Fig. 10.
K-edge tomographic concentration images containing 0.5% gadolinium solution. (a) The image corresponding to energy window width of 2keV; (b) the image corresponding to 5.8keV (optimal width); and (c) the image corresponding to 15keV. The display window is [−5e-4, 5e-4]
Fig. 9.
Profiles along the dotted line in Fig. 8. (a) The profiles along the horizontal dotted line and (b) the counterparts along the vertical dotted line.
Fig. 11.
Profiles of the dotted line in Fig. 10. (a) The profiles along the horizontal dotted line and (b) the counterparts along the vertical dotted line respectively.
Fig. 12.
Profiles for (a) the zoomed region of (a) in Fig. 9; (b) the zoomed region of (b) in Fig. 9; (c) the zoomed region of (a) in Fig. 11, and (d) the zoomed region of (b) in Fig. 11.
We reconstructed concentration images of contrast agents as shown in Figs. 7, 8 and 10. By visual inspection, the energy width of 2keV contains apparent noise comparing with that of the optimal energy width, which will impair the recognition of the contrast agents. The images of energy width of 15keV had too much background content, making it difficult to identify the concentration map of contrast agents. In contrast, the images with the optimal energy width had not only a better noise condition, but also less background interference. For quantitative measurement, the CNRs with the optimal energy width are the best among various energy windows, as listed in Table III. The optimal energy window widths gave least fluctuation of concentration in ROIs, as shown in Fig. 12.
TABLE III.
CNR FOR Various Energy Windows
| Phantom Number |
Width of 2keV | Optimal width |
Width of 15keV |
|---|---|---|---|
| 4 | 9.8 | 16.5 | 15.1 |
| 5 | 9.7 | 16.4 | 10.8 |
| 6 | 9.5 | 13.6 | 11.8 |
IV. Conclusion
In the earlier studies [15, 16], the optimization was made in the image domain for K-edge imaging. According to He et al. (2012), the signal difference to noise ratio (SDNR) was the criterion to optimize the energy window width on both sides of the K-edge. Their work needs reconstructed images before the optimal energy window width could be calculated. Our proposed approach starts from the physics of the CT measurements and does not rely on the selection of a reconstruction method. Numeric evaluation of CNR as a function of window width shows that the optimal window width indeed results in superior SNR.
In the image domain, we used CNR as the criterion for evaluation of the reconstructed images of contract agent concentration. As indicated in Figs. 7, 8 and 10, the concentration maps with the optimal energy window widths generally produced more desirable results. For example, our optimized images gave weaker noise measures than with the less energy width (2keV), and better contrast in the ROI than with the larger energy width (15keV). The profiles in Figs. 9, 11 and 12 illustrate that the optimal window widths achieved an excellent tradeoff between the attenuation coefficient contrast and SNR.
With the Poisson distribution of X-ray photons, we have used the signal-to-noise ratio (SNR) of projection data in the objective function to optimize the width of the X-ray energy window. This noise model could be improved to better reflect the data acquisition process. With a more generalized noise model, we would need to re-examine the properties of the objective function and see if and how the objective function will achieve the maximum SNR.
A further research topic is to evaluate if there is any significant benefit in using different energy window widths on the left and right sides of a K-edge. It is hypothesized that the optimal window widths must produce similar noise variances for the estimated line integrals on the left and right sides of the K-edge. A full formulation would involve significantly more steps and a new reconstruction algorithm. Hence, this work is considered beyond the scope of this feasibility paper.
In conclusion, we have proposed a practical method to determine the optimal width for the energy windows to the left and right of an X-ray K-edge. Our numerical results have verified that the proposed approach can achieve an optimal SNR of the projection data, and as expected, an optimal CNR in reconstructed images of contrast agents as well. The proposed optimization method is accurate and robust against data noise.
TABLE I.
Material Types of the Phantom Sub Regions Shown In Figure 5
| Number | Material |
|---|---|
| 1 | air |
| 2 | lung |
| 3 | tissue |
| 4 | heart(blood) |
| 5 | ROI(1.5%Gadolinium+98.5%Blood) |
| 6 | artery(blood) |
| 7 | bone |
| 8 | marrow |
TABLE II.
Description of the Numerical Phantoms
| No. | Contrast Agent |
Concentration | L (cm) |
L2 (cm) |
Optimal ω |
|---|---|---|---|---|---|
| 1 | Iodine | 0.9% | 20 | 4 | 3.9 |
| 2 | Barium | 1.5% | 20 | 4 | 5.4 |
| 3 | Gadolinium | 0.5% | 20 | 4 | 6.9 |
| 4 | Gadolinium | 1.5% | 40 | 1 | 5 |
| 5 | Gadolinium | 0.5% | 40 | 4 | 4.1 |
| 6 | Gadolinium | 0.5% | 2.5 | 0.2 | 5.8 |
Acknowledgments
This work has been partially supported by NIH under Grant No. R01 EB016977 and Grant No. U01 EB017140.
Contributor Information
Bo Meng, Biomedical Imaging Center, Department of Biomedical Engineering, Rensselaer Polytechnic Institute, Troy, NY 12180, USA and also with First Research Institute of Ministry of Public Security of PRC, Beijing 100048, P.R. China(bit.meng@gmail.com).
Wenxiang Cong, Biomedical Imaging Center, Department of Biomedical Engineering, Rensselaer Polytechnic Institute, Troy, NY 12180, USA (congw@rpi.edu).
Yan Xi, Biomedical Imaging Center, Department of Biomedical Engineering, Rensselaer Polytechnic Institute, Troy, NY 12180, USA (xiyansjtu@gmail.com).
Bruno De Man, GE Global Research, Niskayuna, NY, 12309, USA (deman@ge.com).
Ge Wang, Biomedical Imaging Center, Department of Biomedical Engineering, Rensselaer Polytechnic Institute, Troy, NY 12180, USA(wangg6@rpi.edu).
References
- 1.Coursey CA, et al. Dual-Energy Multidetector CT: How Does It Work, What Can It Tell Us, and When Can We Use It in Abdominopelvic Imaging? Radiographics. 2010 Jul-Aug;30:1037–1055. doi: 10.1148/rg.304095175. [DOI] [PubMed] [Google Scholar]
- 2.Suetens P. Fundamentals of Medical Imaging. 2nd. New York: Cambridge University Press; 2009. pp. 15–27. [Google Scholar]
- 3.Bornefalk H, Danielsson M. Photon-counting spectral computed tomography using silicon strip detectors: a feasibility study. Phys Med Biol. 2010 Apr 7;55:1999–2022. doi: 10.1088/0031-9155/55/7/014. [DOI] [PubMed] [Google Scholar]
- 4.Firsching M, et al. Contrast agent recognition in small animal CT using the Medipix2 detector. Nuclear Instruments & Methods in Physics Research Section a-Accelerators Spectrometers Detectors and Associated Equipment. 2009 Aug;607:179–182. [Google Scholar]
- 5.Heijne EHM, et al. Vectors and submicron precision: redundancy and 3D stacking in silicon pixel detectors. Journal of Instrumentation. 2010 Jun;5 [Google Scholar]
- 6.Norlin B, Frojdh C. Characterisation of spectral performance of pixellated X-ray imaging detectors in a microscopy setup. Nuclear Instruments & Methods in Physics Research Section a-Accelerators Spectrometers Detectors and Associated Equipment. 2009 Aug;607:199–201. [Google Scholar]
- 7.Norlin B, et al. Spectral performance of a pixellated X-ray imaging detector with suppressed charge sharing. Nuclear Instruments & Methods in Physics Research Section a-Accelerators Spectrometers Detectors and Associated Equipment. 2007 Jun;576:248–250. [Google Scholar]
- 8.Norlin B, et al. Material recognition with the Medipix photon counting colour X-ray system. Nuclear Instruments & Methods in Physics Research Section a-Accelerators Spectrometers Detectors and Associated Equipment. 2004 Sep;531:265–269. [Google Scholar]
- 9.Alvarez RE, Macovski A. Energy-Selective Reconstructions in X-Ray Computerized Tomography. Physics in Medicine and Biology. 1976;21:733–744. doi: 10.1088/0031-9155/21/5/002. [DOI] [PubMed] [Google Scholar]
- 10.Kelcz F, et al. Noise considerations in dual energy CT scanning. Medical physics. 1979;6:418–425. doi: 10.1118/1.594520. [DOI] [PubMed] [Google Scholar]
- 11.Lehmann LA, et al. Generalized Image Combinations in Dual Kvp Digital Radiography. Medical Physics. 1981;8:659–667. doi: 10.1118/1.595025. [DOI] [PubMed] [Google Scholar]
- 12.Roessl E, Proksa R. K-edge imaging in x-ray computed tomography using multi-bin photon counting detectors. Physics in medicine and biology. 2007;52:4679. doi: 10.1088/0031-9155/52/15/020. [DOI] [PubMed] [Google Scholar]
- 13.Schlomka J, et al. Experimental feasibility of multi-energy photon-counting K-edge imaging in pre-clinical computed tomography. Physics in medicine and biology. 2008;53:4031. doi: 10.1088/0031-9155/53/15/002. [DOI] [PubMed] [Google Scholar]
- 14.Feuerlein S, et al. Multienergy Photon-counting K-edge Imaging: Potential for Improved Luminal Depiction in Vascular Imaging. Radiology. 2008 Dec;249:1010–1016. doi: 10.1148/radiol.2492080560. [DOI] [PubMed] [Google Scholar]
- 15.He P, et al. Optimization of K-edge imaging with spectral CT. Med Phys. 2012 Nov;39:6572–6579. doi: 10.1118/1.4754587. [DOI] [PMC free article] [PubMed] [Google Scholar]
- 16.He P, et al. Material discrimination based on K-edge characteristics. Comput Math Methods Med. 2013;2013:308520. doi: 10.1155/2013/308520. [DOI] [PMC free article] [PubMed] [Google Scholar]
- 17. see http://www.nist.gov/pml/data/xraycoef/index.cfm.
- 18.Riederer S, Mistretta C. Selective iodine imaging using Kedge energies in computerized x - ray tomography. Medical physics. 1977;4:474–481. doi: 10.1118/1.594357. [DOI] [PubMed] [Google Scholar]
- 19.Shikhaliev PM. Photon counting spectral CT: improved material decomposition with K-edge-filtered x-rays. Physics in medicine and biology. 2012;57:1595. doi: 10.1088/0031-9155/57/6/1595. [DOI] [PubMed] [Google Scholar]
- 20.Meng B, et al. Image reconstruction for X-ray K-edge Imaging With Photon Counting Detector. Developments in X-ray Tomography IX, edited by Stuart R. Stock, Proc. of SPIE. 2014:921219. [Google Scholar]
- 21.Mendonca P, et al. A flexible method for multi-material decomposition of dual-energy CT images. IEEE Transactions on Medical Imaging. 2014 Jan;33:99–116. doi: 10.1109/TMI.2013.2281719. [DOI] [PubMed] [Google Scholar]
- 22.Mendonçaa PRS, et al. Multi-Material Decomposition of Spectral CT Images. Proc. of SPIE. 2010;7622:76221W. [Google Scholar]
- 23.Bushberg Jerrold T, et al. The Essential Physics of Medical Imaging. 3rd. Philadelphia: Lippincott Williams & Wilkins; 2011. [Google Scholar]
- 24.Boyd S, Vandenberghe L. Convex Optimization. New York: Cambridge University Press; 2004. [Google Scholar]
- 25.Gierada DS, Bae KT. Gadolinium as a CT contrast agent: Assessment in a porcine model. Radiology. 1999 Mar;210:829–834. doi: 10.1148/radiology.210.3.r99mr06829. [DOI] [PubMed] [Google Scholar]
- 26.Depypere M, et al. An iterative dual energy CT reconstruction method for a K-edge contrast material. Medical Imaging 2011: Physics of Medical Imaging. 2011;7961 [Google Scholar]
- 27.Roessl E, et al. Sensitivity of Photon-Counting Based K-Edge Imaging in X-ray Computed Tomography. IEEE Transactions on Medical Imaging. 2011 Sep;30:1678–1690. doi: 10.1109/TMI.2011.2142188. [DOI] [PubMed] [Google Scholar]
- 28.Anderson NG, et al. Spectroscopic (multi-energy) CT distinguishes iodine and barium contrast material in MICE. European Radiology. 2010 Sep;20:2126–2134. doi: 10.1007/s00330-010-1768-9. [DOI] [PubMed] [Google Scholar]
- 29.Primak AN, et al. Improved dual-energy material discrimination for dual-source CT by means of additional spectral filtration. Medical Physics. 2009 Apr;36:1359–1369. doi: 10.1118/1.3083567. [DOI] [PMC free article] [PubMed] [Google Scholar]
- 30.De Man B, et al. CatSim: a new computer assisted tomography simulation environment. Medical Imaging. 2007:65102G–65102G-8. [Google Scholar]
- 31.Åslund M, et al. Detectors for the future of X-ray imaging. Radiation protection dosimetry. 2010;139:327–333. doi: 10.1093/rpd/ncq074. [DOI] [PubMed] [Google Scholar]
- 32.Yu ZC, et al. Simulation tools for two-dimensional experiments in x-ray computed tomography using the FORBILD head phantom. Physics in Medicine and Biology. 2012 Jul 7;57:N237–N252. doi: 10.1088/0031-9155/57/13/N237. [DOI] [PMC free article] [PubMed] [Google Scholar]


