Abstract
Red blood cell (RBC) membrane skeleton is a closed two-dimensional elastic network of spectrin tetramers with nodes formed by short actin filaments. Its three-dimensional shape conforms to the shape of the bilayer, to which it is connected through vertical linkages to integral membrane proteins. Numerous methods have been devised over the years to predict the response of the RBC membrane to applied forces and determine the corresponding increase in the skeleton elastic energy arising either directly from continuum descriptions of its deformation, or seeking to relate the macroscopic behavior of the membrane to its molecular constituents. In the current work, we present a novel continuum formulation rooted in the molecular structure of the membrane and apply it to analyze model deformations similar to those that occur during aspiration of RBCs into micropipettes. The microscopic elastic properties of the skeleton are derived by treating spectrin tetramers as simple linear springs. For a given local deformation of the skeleton, we determine the average bond energy and define the corresponding strain energy function and stress–strain relationships. The lateral redistribution of the skeleton is determined variationally to correspond to the minimum of its total energy. The predicted dependence of the length of the aspirated tongue on the aspiration pressure is shown to describe the experimentally observed system behavior in a quantitative manner by taking into account in addition to the skeleton energy an energy of attraction between RBC membrane and the micropipette surface.
1 Introduction
Red blood cell (RBC) membrane is a composite of a bilayer and membrane-associated cytoskeleton (in the following “skeleton”). The bilayer is lipid based, but densely occupied by integral proteins. The skeleton is essentially a triangular protein network linked to the cytoplasmic side of the bilayer (Byers and Branton 1985). The principal component of the RBC skeleton is a fibrous spectrin heterodimer (composed of α and β subunits) which at its tail associates with a short actin filament belonging to a junctional complex, and at its head with another spectrin dimer to form a spectrin tetramer (Ipsaro et al. 2010). The junctional complexes can be considered to be network nodes and the spectrin tetramers the bonds connecting the nodes. Under resting conditions, spectrin tetramers have an end-to-end distance of approximately 70 nm and are thus much shorter than when extended to their full contour length of about 200nm. The number of bonds emanating from each node varies from five to seven but is typically six (Liu et al. 1987). In addition to having different numbers of spectrin tetramers at different nodes, irregularities in the network include spectrin dimers that may stay unconnected or associate with other oligomeric structures such as hexamers. RBC skeleton is linked to the bilayer via integral proteins at junctional complexes and via ankyrin near the middle of the tetramer (Grey et al. 2012).
The tri-layer structure formed by the two layers of the RBC bilayer and its membrane skeleton is the main determinant of the RBC response to mechanical deformations. All three layers are two-dimensional entities freely able to slide one by the other, the skeleton because of the freedom of the integral membrane proteins to move laterally within the plane of the bilayer. Each layer thus relaxes its elastic strains within its lateral direction independently of the other two layers, with the exception that the layers are in contact and therefore must have a common shape and interrelated total areas (Svetina and Žekš 1992). The RBC bilayer and the skeleton respond to deformation in markedly different ways. The area compressibility moduli of the two leaflets of the bilayer are much larger than that of the skeleton so that the area of the RBC membrane corresponds to the area of its bilayer. The membrane bending resistance of the bilayer is also much greater than that of the skeleton and includes both local, intrinsic resistance to curvature change as well as a global coupling (area difference elasticity) between the two leaflets (Svetina and Žekš 2014). The bilayer exhibits no shear elastic resistance, and its behavior in surface shear is well characterized as that of a two-dimensional liquid. In contrast, the mechanical contribution of the skeleton is manifested principally in its resistance to in-plane shear deformation. These macroscopic features of the RBC membrane are well incorporated into the model introduced by Mukhopadhyay et al. (2002).
There remain several reasons that the calculations of the total energy of the deformed skeleton and its lateral redistribution remain a challenge. When a RBC is deformed, the acquired state of the skeleton is governed by two important constraints: The topological connectedness of the network elements must be preserved while maintaining the total area of the membrane defined by the area of the bilayer. Within these constraints, skeleton responds by changing both the position of its structural elements relative to their original position on the cell surface and their deformation. Understanding the relationship between the skeletal energy and the skeletal state after an imposed deformation has been the subject of numerous published reports over the past several decades. In one common approach, the skeleton elastic properties are described on the basis of assumed constitutive relations defined at the level of an elastic continuum (for example, Waugh and Evans 1979; Skalak et al. 1973; Mohandas and Evans 1994; Mukhopadhyay et al. 2002; Kuzman et al. 2004). The different versions of constitutive relations presented in the literature typically describe small deformations equally well, but differ in describing the behavior of the system at relatively large deformations (Dimitrakopoulos 2012). Alternatively, skeletal energies have been estimated based on molecular-level models of the spectrin network either using simple elastic springs (Hansen et al. 1996) or a worm-like chain potential (Discher et al. 1998; Li et al. 2005). Given understanding that the macroscopic behavior of the cell is ultimately rooted in the interactions and properties of the constituent molecules of the skeleton (An and Mohandas 2008), this approach has significant appeal, although the computational complexity of such molecular-scale calculations limits the applicability and accessibility of these approaches.
In this study, we propose a theoretical approach that is based on the characteristics of the principal constituent molecules of the skeleton (spectrin), but which is expressed in terms of macroscopic continuum variables: the principal extension ratios of the deformation. We derive strain energy descriptions for an underlying molecular potential of simple linear springs and then apply this energy function to simple, well-defined changes in surface shape to gain insights into the underlying mechanisms that determine the balance between local changes in skeletal density and the elastic shear energy of the deformed network. In the first part of the paper, we shall describe the method for the determination of lateral distribution of spectrin bonds and the increase in the skeleton energy for axisymmetric shape transformations. As an example, we analyze a deformation of an annulus of membrane into a cylinder before proceeding to compare the predicted behavior of model calculations with measurements of cell projections formed by micropipette aspiration.
2 Spectrin bond approximation of the deformational energy of the RBC membrane skeleton
Our determination of the energy of a deformed RBC skeleton structural element is based on the assumption that the main contribution to the energy comes from the compression or extension of spectrin tetramers. Thus, the first step in our analysis is to define the molecular energy as a function of its extension, and to relate this energy to measures of macroscopic deformation, namely the principal extension ratios of the surface deformation. Our treatment of spectrin bonds as simple elastic springs (Hansen et al. 1996, 1997) is clearly a simplification in light of evidence that spectrin tetramers exhibit a complex length–strain relationship and that their extensional behavior may be complicated by strain induced unfolding of subunits within the larger molecule (Rief et al. 1999; Randles et al. 2007). Nevertheless, this simple potential represents the small deformation limit for more complex molecular potentials and should capture the behavior of any network model for small to moderate deformations. We further assume that the deformation of a given bond is not correlated with the deformation of the neighboring bonds, that is, we neglect effects that may arise from the connectivity within the network, and treat the system as a collection of randomly oriented molecules. The advantage of this simplification is that an analytical expression for the energy in terms of the principal extension ratios of the deformation can be obtained, and this allows the direct determination of the average bond energy for any macroscopic deformation of the membrane expressed in terms of the principal extension ratios. The method will be illustrated by a change of skeleton geometry from an annulus to a cylinder such as occurs in the problem of micropipette aspiration of the RBC membrane.
2.1 Average energy of the deformed spectrin bond
With the goal of developing the simplest possible molecular-based model for the RBC skeleton, the main contribution to its elastic energy is assumed to come from the elastic energy of network bonds behaving as Hookean springs. The energy of a given bond is then given (Hansen et al. 1996) by
| (1) |
with K the elastic spring constant, X0 the equilibrium length of the bond, and X the length of stretched or compressed bond.
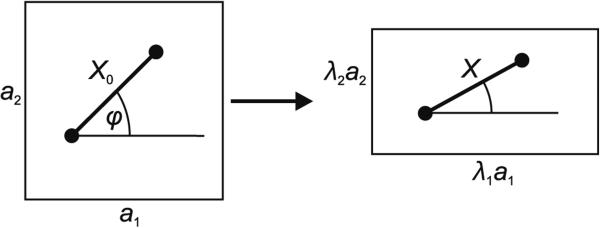
It is assumed that in the resting state the length of all bonds is X0. Skeleton deformation is defined by two extension ratios, λ1 and λ2, such that a rectangle a1 × a2 deforms into a rectangle λ1a1×λ2a2. In accord with this deformation, the length of the spring changes as a function of the original bond orientation defined by angle φ (Fig. 1). The acquired bond length is then
| (2) |
Fig. 1.
Deformation of rectangle a1 × a2 into λ1a1 × λ2a2. At original bond orientation φ, the bond acquires the length given by Eq. 2
For a given deformation defined by the extension ratios λ1 and λ2, it is possible to determine the average of deformational energy of a single bond where the average is calculated over all surface orientations of the undeformed bond. Assuming that the bonds in the undeformed state are oriented in all directions with the equal probability, the average bond energy can be expressed as
| (3) |
where u(λ1, λ2) is the average of the square of the relative deviation of the bond length from its equilibrium value
| (4) |
The integration over all bond orientations gives
| (5) |
where E is the complete elliptic integral of the second kind. The expression (5) is written for λ1 > λ2. For λ2 > λ1, the expression is analogous with the exchanged extension ratios λ1 and λ2.
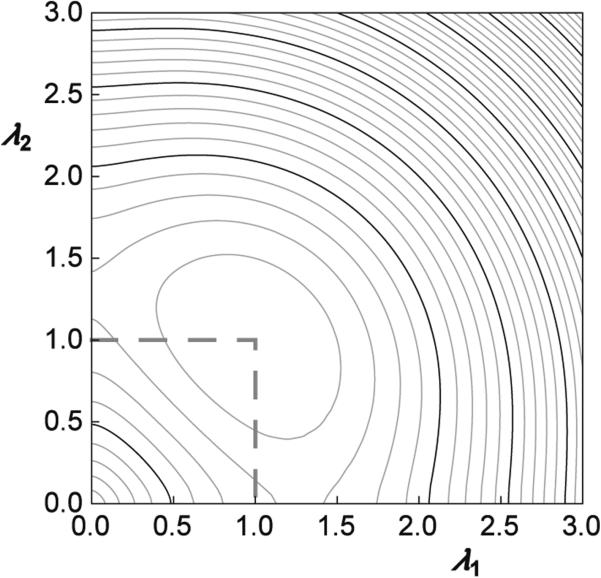
The function u(λ1, λ2) (Eq. 5) can be considered as the reduced strain energy. Its dependence on the extension ratios λ1 and λ2 is shown in Fig. 2 in its two-dimensional representation where the dependence of the deformational energy on the extension ratios is represented by the lines of constant energy.
Fig. 2.
The dependence of the reduced strain energy function u(λ1, λ2) (Eq. 5) on the extension ratios λ1 and λ2. The lines of constant reduced strain energy are presented in a two-dimensional representation. Thin lines are separated by 0.1 and bold lines by 0.5
2.2 The deformational energy of the whole skeleton
Assuming that in the resting state the spectrin bonds are distributed uniformly, the area density of the skeleton energy w can be expressed:
| (6) |
where n0 is the area density of bonds of the undeformed skeleton. The total skeleton energy is then the integral of its energy area density (energy per unit area) over the undeformed membrane area. In the following, this integral will be determined only for axisymmetric shapes. Therefore, we shall define extension ratios for this geometry, i.e., along the meridians λm = λ1 and along the parallels λp = λ2. The skeleton energy is then
| (7) |
where dA0 is the differential area of the undeformed membrane.
The strain energy functions such as the one presented in Fig. 2 are alternative to the use of constitutive relations. It is straightforward to define constitutive relationships that are consistent with the strain energy function given by Eq. 6. The principal force resultants τ1 and τ2 can be expressed as:
| (8) |
| (9) |
where E(x) is the complete elliptic integral of the second kind and K (x) is the complete elliptic integral of the first kind (not to be confused with the molecular spring constant!). Note that as was the case with u(λ1, λ2), expressions are written for λ1 > λ2, and when this condition is not met, the respective indices must be interchanged.
2.3 The variational procedure to determine the redistribution of membrane skeleton in the case of axisymmetric deformation
We are looking for the skeleton deformation that corresponds to the minimum of the skeleton energy (Eq. 7). The undeformed shape of the axisymmetric skeleton is given by the contour r0(s0) where s0 is the arc length on the contour measured from one of the poles and r0 is the distance from the axis. The deformed contour is defined by the function r(s) where s and r have corresponding meanings. The skeleton at the position s0 moves to the unknown position s on the deformed shape. We define the mapping function s0(s) that relates the location of the point at s in the deformed state to its position in the undeformed surface s0. Then it is possible to define principal deformations along parallels and meridians, respectively, as
| (10) |
and
| (11) |
Replacing the area differential dA0 = 2πr0ds0, the total change of the skeleton energy (Eq. 7) for the axisymmetric case then reads
| (12) |
Our task is to find the mapping function s0(s) for which the total energy Wsk will be minimal. Because our variable is s, we shall look for the minimum of the functional
| (13) |
where
| (14) |
The minimum of F corresponds to the solution of the Euler–Lagrange equation:
| (15) |
By expressing the partial derivatives in Eq. (15) as
| (16) |
and
| (17) |
we get for the Euler–Lagrange equation
| (18) |
Equation 18 is to be solved for a given change of the skeleton geometry prescribed by the function r(s). Technical details to solve this equation are given in “Appendix 1”.
2.4 The effects of geometrical changes on the skeleton lateral distribution
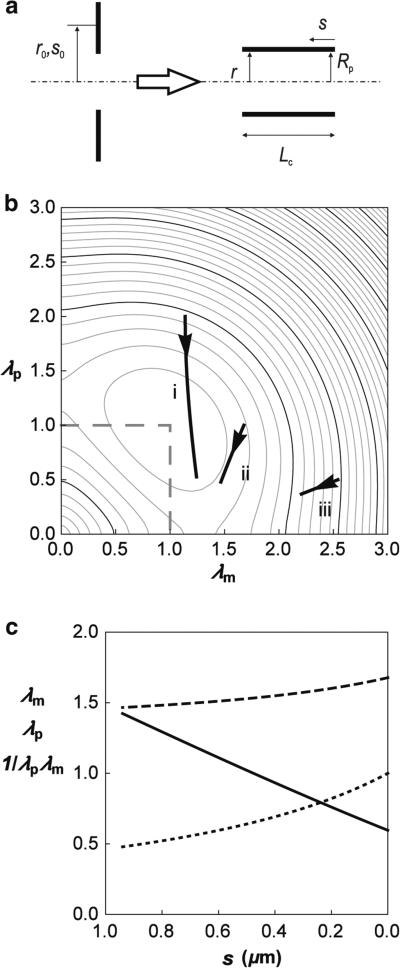
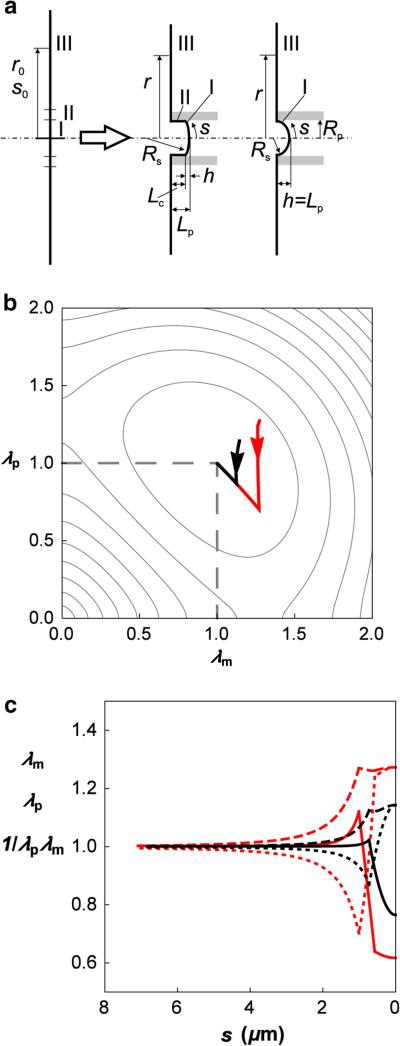
The applicability of this approach to determining the skeleton lateral distribution in its deformed state is illustrated by deforming a section of skeleton originally in the shape of an annulus with uniform density into a narrow cylinder (Fig. 3a). The skeleton responds to this deformation by redistributing so that the increase in its elastic energy is minimal. To illustrate how an imposed change in shape affects the local energy density of the skeleton, we calculated the distribution of energy density for three different annuli being deformed into a cylinder. The distributions were obtained by minimization of Eq. 7 and are illustrated in Fig. 3b, where three curves showing the variation in the reduced energy with position s are superimposed on a contour diagram of the reduced strain energy function u(λm, λp) as a function of the extension ratios λm and λp. In Fig. 3c, we show the corresponding extension ratios λm and λp, and the reduced bond area density (1/λmλp) as functions of the coordinate distance s from the edge of the cylinder. The formation of the cylinder requires material elements originally near the outer edge of the annulus to move the greatest distance from their original location on the planar surface toward the axis of symmetry, leading to large compressions along the surface parallels and the lowest values of the extension ratio λp. (See Eq. 10.) This also results in an increase in the skeleton density, but by a proportion less than the proportional change in λp because compression along the parallels is accompanied by the extension along the meridians. It is interesting to note that the predicted distribution of density depends only on the function u(λ1, λ2) and so is independent of the elastic moduli of the material.
Fig. 3.
Skeleton deformation due to transformation from annulus to cylinder. a Side view of the deformation. s0 is the contour along the undeformed skeleton and s the contour along the deformed skeleton. The radial distance from the axis of symmetry in the undeformed state is r0 and in the deformed state, r. The areas of the cylinder and the annulus are equal (5.9 μm2). b The variation in the reduced energy of the deformed skeleton with position, s, is illustrated by the solid curves overlaid on a contour depiction of the reduced strain energy u(λm, λp) as a function of the extension ratios λm and λp. The inner radius of the annulus is taken to be Rp/2 (curve i), Rp (curve ii) and 2Rp (curve iii) where Rp = 0.56 μm. Arrows indicate the direction of increasing arc length s. c The extension ratios λm (dashed line) and λp (dotted line) and the reduced bond area density 1/λmλp (solid line) as a function of arc length s for the case where the initial inner radius of the annulus is Rp. In keeping with the diagram shown in a, s increases from right to left.
3 Aspiration of RBC into a micropipette with a small attraction energy between the membrane and the wall of the pipette
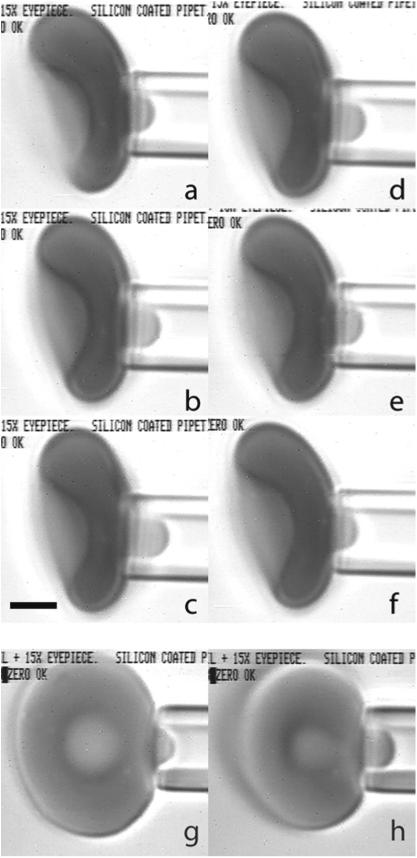
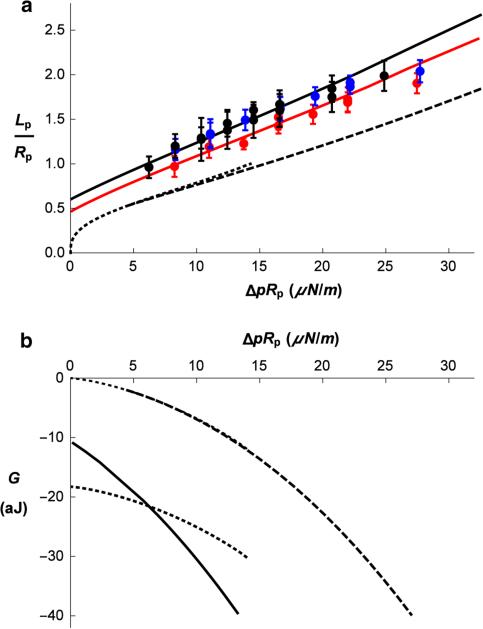
The proposed approach to calculating the energy of the deformed spectrin skeleton can be readily applied to the analysis of the experiment in which a RBC is aspirated into a micropipette. The cell shape during this deformation remains axisymmetric, and the expected extension ratios are significantly less than maximal extension of spectrin tetramer and thus remain within the region of applicability of the harmonic approximation for the spectrin bond. In the experiment, a micropipette is used with an inside radius of approximately 1.0 μm. A small aspiration pressure (Δp) is applied to the surface of the cell, creating a short projection of the cell membrane into the pipette (Fig. 4). Aspiration of a small section of the membrane into such a small micropipette does not appreciably affect the shape of the rest of the cell. The length of the aspirated projection is measured as a function of the aspiration pressure (Fig. 5a, experimental points). While experiments like these have been performed and analyzed since the earliest days of testing RBC mechanical properties, there are two subtle aspects of the experimental results that we will attempt to address here. First, we note that a line drawn through projection length values measured at different aspiration pressures extrapolates to an intercept at zero aspiration pressure at an unexpectedly high positive value of the projection length (Fig. 5a). Second, at very small aspiration pressures, the shape of the projection differs from what is observed at larger pressures. It appears that for the lowest est pressures, the membrane aligns along the flat surface of the pipette tip, forming a Gaussian-like shape at the opening of the pipette, whereas at higher pressures, the membrane aligns with the inner wall of the pipette, forming a longer projection with less curvature at the tip. (See Fig. 4 and supplemental movie.) This latter observation could reflect the existence of an attractive force between the membrane and the micropipette wall. The effect such a force might have on the behavior of the aspirated membrane will be explored in our analysis.
Fig. 4.
A red blood cell being aspirated into a micropipette. Pipettes were made by pulling capillary tubing to a point and using a microforge to produce a flat tip of the desired diameter. The inside diameter was measured using a calibration needle inserted into the tip. The maximum insertion depth was measured, and the corresponding diameter (1.70 μm) was determined from electron micrograph images of the probe. Pressure was applied to the surface of the cell by using a micrometer to adjust the height of a water manometer relative to zero pressure, which was determined by observing the movement of small particles within the empty pipette lumen. For a typical measurement series, the cell was aspirated near the dimple region of the biconcave disk (a–f). Suction was increased stepwise to a maximum of approximately 30Pa and then decreased stepwise to a minimum pressure of approximately 7.4Pa. Images were recorded on videotape, and frames were captured subsequently for data analysis. At each pressure step, the length of the projection was measured. Six example images are shown for an individual cell at different pressures: a–c increasing pressures of 12.3, 19.6 and 29.4Pa; d–f decreasing pressures of 19.6, 12.3 and 7.3Pa. Observation of the transition from the cell membrane contacting the front face of the pipette to contacting the interior of the pipette cylinder is more easily seen when a cell is aspirated on edge (g, h). This transition (for this particular experiment) typically took place between aspiration pressures of 7.3 and 12.3Pa. The pressure in g (pre-transition) is 9.8Pa, and in h (post transition) is 14.7Pa. Scale bar (c) is 2.0 μm
Fig. 5.
a Aspiration length of the RBC (Lp/Rp) as a function of pipette aspiration pressure (ΔpRp) for the pipette radius Rp = 0.85 μm. Points are average values of the measured projection length at each pressure taken from nine or ten different cells, and error bars indicate the standard deviation. Each different color corresponds to a different day of experiments. For the black data points, the pipette diameter was 1.7 μm, and for the red and blue data points, the pipette diameter was 1.1 μm. The lines show corresponding theoretical predictions. Dotted line represents aspiration of the RBC without forming a cylindrical part inside the pipette (Lc = 0). Dashed line represents the equilibrium aspiration lengths versus the aspiration pressure obtained by Eq. 22 with no adhesion (σeff = 0). The thick black line presents a rough visual fit to the data for the larger pipette, and the red curve is a visual fit to the red data points from a smaller pipette. Parameters for the solid black line are K = 30 μN/m and σeff = −0.277, and for the red curve, K = 30 μN/m and σeff = −0.225. b Free energy G of the aspirated RBC (Eq. 19) as a function of the aspiration pressure. Dotted lines represent the energy of the RBC without a cylindrical section inside the pipette (Lc = 0), the upper for σeff = 0 and the lower for σeff = −0.277, i.e., the value at which the Lc = 0 curve was found to cross the curve with Lc ≠ 0. Dashed line presents the energy for Lc > 0 and the adhesion constant σeff = 0. Full line presents energy that corresponds to the solid black line in (a)
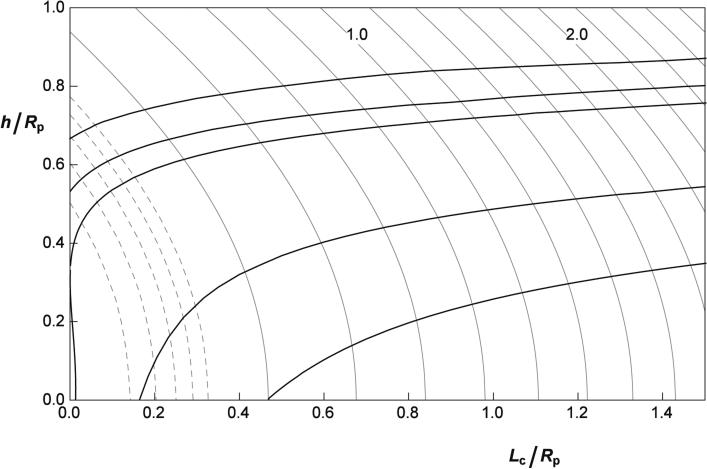
To estimate the RBC skeleton deformational energy as a function of the aspirated projection length and determine the dependence of the projection length on the aspiration pressure, we model the aspiration process as the deformation of a planar disk with an area equal to the area of the RBC membrane into a shape comprising an annulus, a cylinder of length Lc and a section of a spherical cap (not a complete hemisphere) with a meniscus height h (Fig. 6a). The length of the aspirated projection is thus Lp = Lc + h. The total area of the deformed skeleton geometry is kept+constant. The lateral distribution of the principal extension ratios and the surface density of the skeleton were determined as described in the previous section. For the two representative examples presented in Fig. 6a, the variation in the reduced energy with position on the deformed surface s is mapped in overlay on the reduced energy diagram (Fig. 6b). In Fig. 7, the corresponding (total) skeleton energy (Wsk) is plotted as a function of Lc and h, which can vary independently.
Fig. 6.
Skeleton deformation in the aspiration into micropipette. a Side view of the deformation of RBC membrane by a micropipette with the radius Rp = 0.56 μm. Before the deformation, the RBC membrane is approximated by a flat disk (left side). Two deformations are considered (right side). In the first case, an inner circle of the flat disk deforms into a spherical cap with the height h/Rp = 0.19 (I) and its remaining annulus partly into a cylinder of the length Lc/Rp = 0.78 (II) and a smaller annulus (III). In the second case, the flat disk deforms into a spherical cap with the height h/Rp = 0.70 (I) and its remaining annulus into a smaller annulus (III). The total area of the deformed skeleton is equal to the undeformed area. In both cases, Lp is the length of the projection in the pipette. Definitions of s0, s, r0 and r are as given in the caption of Fig. 3. b Presentation of the first (red) and the second (black) skeleton deformation in the diagram of the reduced strain energy function u(λm, λp). Arrows indicate the direction of increasing arc length s. c The extension ratios λm (dashed lines) and λp (dotted lines) and the reduced bond area density 1/λmλp (solid lines) as functions of the arc length (distance from the pole) s for the first (red/thin line) and the second (black/thick line) cases shown in a
Fig. 7.
The reduced skeleton strain energy (see Eq. 7) of the aspirated RBC as a function of the relative cylinder length (Lc/Rp) and relative meniscus height (h/Rp). Gray lines connect points with the same reduced strain energy in increments of 0.2. Curves corresponding to reduced energies of 1.0 and 2.0 are labeled. Dotted lines below are separated by 0.02. Black lines represent the dependence of h/Rp on Lc/Rp for the equilibrium shapes obtained by solving Eq. (26) for the effective adhesion constants (from top down) σeff = 0.010, 0.0, −0.0074, −0.087 and −0.225
Model predictions for the equilibrium configuration of the system can be obtained by considering the deformational energy of the skeleton, the work due to the aspiration pressure and the energy of the membrane—micropipette interaction. The corresponding free energy (G) can then be expressed as
| (19) |
where V is the volume of the aspirated part of the membrane, σ the membrane–micropipette interaction constant, and Ai the area of the membrane–micropipette contact.
The equilibrium of this system is obtained by requiring δ G = 0. For the case in which the area of interaction between the micropipette and the cylindrical portion of the membrane takes the form Ai = 2π RpLc, we obtain
| (20) |
Equation 20 is satisfied by the conditions
| (21) |
and
| (22) |
Using the fact that volume of the aspirated part of the cell is , Eqs. 21 and 22 become
| (23) |
and
| (24) |
Elimination of Δp from Eqs. 23 and 24 gives the relationship
| (25) |
To calculate the dependence of h on Lc for any given equilibrium configuration, it is convenient to write this equation in a reduced form:
| (26) |
where an effective interaction constant was defined as . In Fig. 7 are shown examples of the correspond ing relationships for some positive (repulsive) and negative (attractive) values of this constant. For repulsive interactions or for very small attractive forces (0.010 > σeff > −0.0074), these curves begin at Lc = 0 and have initial values of h/Rp larger than 0.35. When the adhesive interaction becomes larger in magnitude (σeff < −0.0074), the attraction is sufficient to pull the membrane into the pipette lumen, resulting in a finite initial projection length. The attractive interaction that provides the closest agreement with measurement varies depending on the experiment. For the two example fits shown in Fig. 5a, σeff = −0.225 (lower curve) and σeff = −0.277 (top curve). It should be kept in mind, however, that there is significant uncertainty in this value because of practical limitations of determining the exact location of the pipette tip and the consequent uncertainty in knowing the exact value of the projection length.
To obtain predictions for Lp as a function of Δp, we note that the value of Δp that corresponds to a given equilibrium point in Fig. 7 can be obtained either from Eqs. 21 or 22. We can also determine Lp(Δp) for the case Lc = 0, that is, for the lowest pressures where the membrane aligns with the flat end of the pipette and the contact area is given by where Rp, out is the outside radius of the pipette tip. In this case Lp = h. The corresponding pressure difference is given by Eq. 22. The predictions for Lp(Δp) are shown in Fig. 5a for the regime where Lc = 0 (dotted line), and for the cases of nonzero h and Lc with either no (dashed line) or finite (full line) membrane–micropipette interaction energy. We note that depending on the magnitude of the effective interaction constant σeff, one of the two qualitatively different behaviors is predicted. When σeff is within the interval −0.0074 < σeff < 0.0101, the aspiration process is continuous: As the aspiration pressure increases from zero, a cell is first sucked into the micropipette without touching the inner wall, and after a certain critical aspiration pressure is reached, the membrane contacts the inner wall forming a cylindrical section. As shown in Fig. 5b (dotted and dashed curves), the free energies for these two stages form a single smoothly varying curve, indicating that this transition is continuous. For more negative σeff, however, the transition is discontinuous (Fig. 5b, dotted and solid curves). In this case, the favorable interaction energy between the RBC membrane and the flat face of the micropipette shifts the curve for Lc = 0 to lower values of the energy. The discontinuous transition from Lc = 0 to Lc ≠ 0 occurs when the two energy curves cross each other. This behavior is in fact observed experimentally. (See supplemental movie.)
To obtain the value of the spring constant K that corresponds to the measured Lp(Δp) values presented in Fig. 5a, we first need to estimate the number of bonds per square area of undeformed membrane. By assuming a triangulated network, we obtain . The energy density (Eq. 6) is then √3K u. Experimental measurements of the length of the aspirated projection as a function of the aspiration pressure (Fig. 5a, red curve and points) are well fit by taking K = 30 μN/m and σ = −0.13√3K = −6.8 μN/m. In accordance with the observed projection lengths, the adhesion constant is in the regime of discontinuous transitions from the aspiration at Lc = 0 to the case in which h and Lc are both changing. From the obtained negative energy at zero aspiration pressure −6.3 aJ and the value σ = −6.8 μN/m, we estimate the area of the cut edge of the pipette to be 0.93 μm2. with the inner pipette radius 0.56 μm, we get for the outside pipette radius Rp, out = 0.78 μm. For the black curve and data points in Fig. 5a, similar values are obtained: K = 30 μN/m and σ = −0.16√3K = −8.3 μN/m. In this case, the pipette radius is 0.85 μm, and the estimated outer radius of the pipette is 1.19 μm.
4 Discussion
After it is released from a strain of a reasonably low magnitude and short duration, an RBC returns into its undeformed state. Such elastic behavior is entirely the consequence of the mechanical properties of its membrane. There is a longstanding quest to properly describe these properties (Evans 1973; Skalak et al. 1973; Zarda et al. 1977; Stokke et al. 1986; Markin and Kozlov 1988; Hochmuth and Waugh 1987; Mohandas and Evans 1994; Discher et al. 1998; Li et al. 2005; Mukhopadhyay et al. 2002; Lim et al. 2002; Kuzman et al. 2004; Pivkin and Karniadakis 2008; Zhu and Asaro 2008; Fedosov et al. 2010; Peng et al. 2010; Hartmann 2010; Li et al. 2013; Chen and Boyle 2014). Understanding that the membrane bilayer constrains the surface area of the cell to be constant inspired early formulations involving a two-dimensional, locally incompressible skeleton. This condition is attractive from a practical point of view because it captures many of the qualitative behaviors of the membrane and it vastly simplifies analysis of deformation. Consequently, it has persisted even in recent analyses (Dimitrakopoulos 2012). Elegant experiments by Discher and colleagues have demonstrated, however, that the distribution of the skeleton in deformed cells is not uniform (Discher et al. 1994; Discher and Mohandas 1996). Therefore, accounting for the local changes in skeletal density is critical for accurately modeling the mechanical response of the cell membrane (Stokke et al. 1986; Markin and Kozlov 1988; Mukhopadhyay et al. 2002; Lim et al. 2002; Kuzman et al. 2004; Li et al. 2013). There have also been efforts to construct models based on an understanding of the molecular composition of the membrane skeleton (Hansen et al. 1996; Discher et al. 1998; Dao et al. 2006). All of these models to varying degrees replicate some aspects of cellular behavior, but in the worst cases, this agreement is confined to a particular experiment, or the model has no connection to experiment at all, and in other cases, the models may provide agreement across multiple experimental approaches, but are so computationally intensive that connections between molecular behavior and macroscopic thermodynamic observables are obscure.
We have undertaken the current analysis to derive macroscopic relationships from consideration of molecular-level behavior to obtain insights into the mechanisms that govern basic membrane behavior. In doing so, we made several simplifications, and it is important to consider the limits of applicability of these assumptions. Consistent with other molecular approaches, we assumed that the skeleton network elastic properties arise primarily from the elastic properties of spectrin molecules. In a departure from prior models, however, we neglect the connectivity of the network and the resulting interdependence of molecular deformation on the deformation of neighboring molecules. Rather, we take the point of view that the molecular deformations are affine, that is, that molecular deformations follow the deformation of a local material element. This enabled us to obtain an analytic expression for the energy of the system in terms of the principal extension ratios of the deformation, something that is not generally possible with models based on discrete molecular networks. In defense of this viewpoint, we note that the actual spectrin network is not a perfectly regular hexagonal lattice, but may deviate from such a model because of different numbers of spectrin tetramers joined at junctional complexes or the formation of higher-order spectrin oligomers in the intervening space. Thus, we believe that treating the orientation of the spectrin molecules as randomly oriented is a reasonable simplification of the actual network.
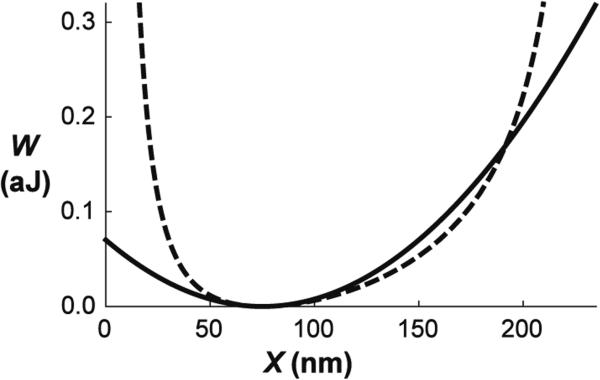
Our next simplification was to treat the energy of the spectrin molecules as simple harmonic springs. We note that this approximates any molecular potential for “small” extensions. To assess how small is small, we compare the harmonic potential and the commonly used worm-like chain potential used by Discher et al. (1998) and by Dao et al. (2006). In extension, the harmonic potential coincides with the worm-like chain potential up to a ratio X/X0 of 2.0, and in compression deviation begins to occur around 0.6 (Fig. 8). The extension ratios encountered in micropipette aspiration experiments (Fig. 6b, c) fall within the applicability of the harmonic potential. Significantly, the use of the harmonic potential reveals that the minimum energy of the system due to a given change in shape is determined solely through the function u(λ1, λ2), which is independent of the properties of the molecular springs. Thus, the distribution of extension ratios depends only on the nature of the shape change and is independent of the stiffness or density of the molecular springs. Inasmuch as this formulation approximates other molecular potentials for small to moderate extension, this suggests that this result should be approximately accurate for a wide range of different molecular models for modest membrane deformations. That is, the distribution of skeletal density after deformation depends much more strongly on the geometry of the deformation than on the material constants involved.
Fig. 8.
Comparison between the dependence of effective elastic potential of a spectrin bond on its length X presented for a worm-like chain potential by Li et al. (2013) (Eq. 1) (dashed curve) and the harmonic potential exhibiting the same second derivative of the potential at its minimum (Eq. 1) (solid curve). The constants of the chain term are taken from Discher et al. (1998) to be X0 = 75 nm, Xmax = 3.17X0, and the persistence length is b = 0.075X0. The parameter kp obtained to give the minimum of the potential at X0 is 1.82 10−34 J/m2. Second derivatives of both potential functions correspond to the spring constant K = 25.1 μN/m
Our treatment of deformations approximating micropipette aspiration experiments was also simplified, first by treating the biconcave shape of the cell as a simple disk and second by neglecting membrane bending stiffness. The approximation of the cell surface by a plane was originally proposed by Evans (1973) and is justified by noting that the majority of the energy of deformation is concentrated near the tip of the pipette and falls off rapidly with distance away from the mouth of the pipette. Although we neglect bending energy in our calculations, it is likely that the bending energy plays a role in the initial stages of cell entry into the micropipette. Specifically, resistance to bending will prevent the formation of sharp curvatures such as those depicted in Fig. 6a. If one assumes that the membrane bilayer at the inside edge of the pipette opening takes on a radius of curvature of 50nm, and knowing the local bending stiffness of the RBC membrane is ~2.0×10⁻¹⁹ J, we estimate the energy of bending for a cell aspirated into a pipette with inside diameter of 1.0 μm to be ~8 × 10⁻¹⁸ J. This is comparable to the elastic energy of the skeleton for the formation of a hemispherical cap (3.3 × 10⁻¹⁸ J) but less than the energy required for formation of a projection of length 2Rp(23.4 × 10⁻¹⁸ J). Thus, bending resistance will almost certainly affect the shape of the initial projection into the pipette, but will become less important as the projection length increases. This is consistent with the images of very small projections shown in Fig. 4g, where the shape appears more like a Gaussian than a spherical section.
Finally, we find that the observed projection lengths into the pipette are longer than would be expected for an elastic membrane. This is the case for essentially all of the constitutive models we have examined, including one (R. Waugh, unpublished) based on the worm-like chain calculations of Discher et al. (1998) and Li et al. (2005), the original formulation of Evans (1973), the model used by Lim et al. (2002), the function proposed by Mohandas and Evans (1994) and one based on a simple harmonic potential (Svetina, Žekš and Waugh, unpublished). To account for this discrepancy between theory and experiment, we postulate that there exists a favorable interaction energy between the RBC membrane and the pipette wall. This postulate results in new predictions about the system behavior that match experimental observation. Note that our estimate of the strength of this interaction energy depends strongly on measuring the absolute magnitude of the projection length. This value is prone to error because of uncertainty about the exact location of the pipette tip. In analyzing our data, we took the smallest measurement of Lp that seems justified for the given images, and so the magnitude of the energy we estimate should represent a lower bound for the strength of this interaction.
The model we have proposed is unique in that by specifying the stiffness of the molecular springs that make up the skeleton and their density on the surface, the macroscopic elastic moduli that correspond to that stiffness can be readily calculated. The values we obtain for the spectrin tetramer elastic spring constant (K = 30 μN/m) are in good agreement with the constant obtained by taking the second derivative of the worm-like chain potential with parameter values used by Discher et al. (1998) to obtain agreement between their network model and micropipette aspiration tests (25 μN/m). The value is different from the one calculated by Hansen et al. (1996), which is based on comparison between their model predictions and published values of the membrane shear modulus for an incompressible skeleton. This disagreement should not be surprising because the modulus value they chose was based on an incorrect (incom-pressible) description of skeletal elasticity, and there was no direct comparison between model predictions and experimental observations.
At the continuum level, the elastic properties of the triangular network of springs are described by the area expansivity (κ) and shear (μ) moduli. In the limit λ1 − 1 < < 1 and λ2 − 1 > > 1, they both can be described in terms of the bond stiffness K. From the number of bonds per square area obtained by assuming a triangulated network, we have . The energy density is then 31/2Ku. For λ1 = λ2 = 1, the second derivatives of u for area expansivity and surface shear are 1/2 and 1/4, respectively, so that κ = 31/2K/2 and μ = 31/2K/4 which yields, by taking K = 30 μN/m, κ = 26μN/m and μ = 13μN/m.
When extension ratios are large, the comparison of the predictions of the current model and predictions of different proposed continuous models is not so straightforward. For the model proposed here, large deformations still depend on the same single parameter K , whereas most continuous models attempt to separate the energy changes due to isotropic deformation from those due to surface shear, and two different elastic constants are defined. For example, a number of descriptions of red cell membrane elasticity use the quantities α = λ1λ2 −1 (the fractional change in skeletal area) and β = (λ1 − λ2)2/2λ1λ2 (a measure of surface shear deformation) as the independent thermodynamic state variables to define the state of the membrane (Waugh and Evans 1979; Li et al. 2013). This approach is appealing because it separates the energy change due to isotropic deformation from that due to surface shear. In this case, the elastic energy can be written as (Dimitrakopoulos 2012):
| (27) |
In traditional treatments, the elastic moduli κ and μ are constants that characterize the resistance to area expansion at no shear deformation and the resistance to shear deformation at constant area, respectively (Waugh and Evans 1979; Hansen et al. 1996). In terms of the strain energy, these are defined as:
| (28) |
| (29) |
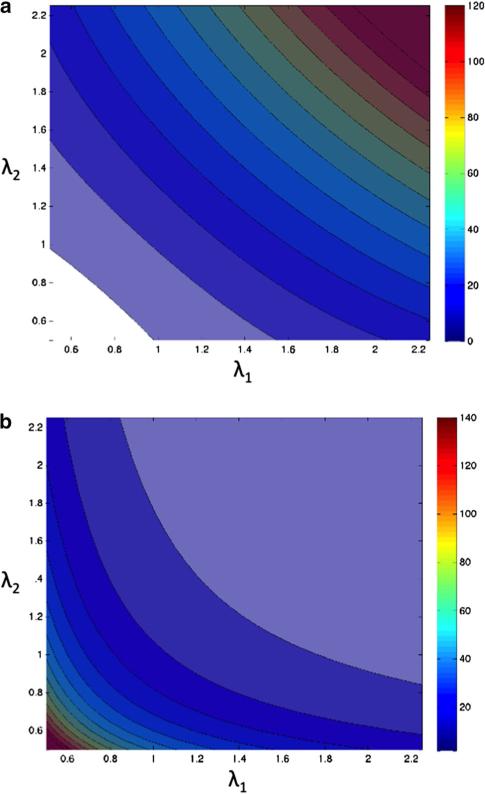
One possible way to compare predictions of the treated microscopic model with those of the model defined by Eq. (27) is to see how μ and κ defined by Eqs. (28) and (29) depend on extension ratios. It is straightforward to calculate these dependences, and the corresponding equations are presented in “Appendix 2.” The dependence of μ and κ on λ1 and λ2 is shown in Fig. 9. It can be seen that in a more extended skeleton, the shear modulus increases, while the area expansivity modulus decreases. For example, at λ1 = λ2 = 1.5, κ = 7.7 μN/m and μ = 58.5 μN/m which is considerably different from the corresponding values at small extensions given above. This behavior was also recognized by Hansen et al. (1996) who presented the dependence of the shear modulus on one of the extension ratios.
Fig. 9.
Dependence of the macroscopic elastic constants on the principal extension ratios. a The shear modulus as a function of extension ratios λ1 and λ2. Each line/color change corresponds to an increase in 10 μN/m. Note that values of the modulus in the white portion of the graph are negative. b The area expansivity modulus as a function of extension ratios λ1 and λ2. In contrast to the shear modulus, the area modulus increases under compression, whereas the shear modulus increases with extension. Contour lines/color changes indicate changes of 10 μN/m
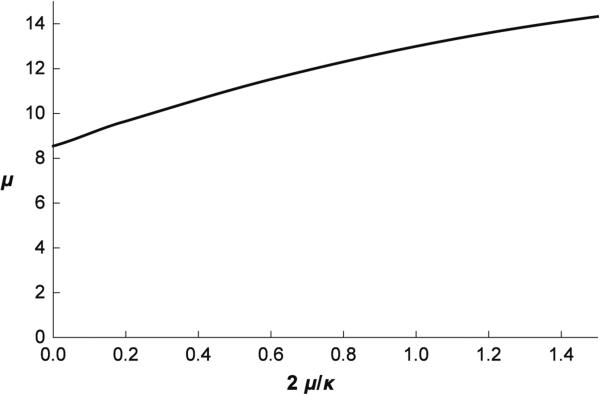
When comparing the predictions of the proposed microscopic model and the continuous approach defined by Eq. (27), it is also of interest to compare the corresponding analyses of the aspiration of a RBC into a micropipette. By replacing in Eq. (19) Wsk by WE defined by Eq. (27), and applying the same subsequent procedure as there, it is possible to find different combinations of the moduli μ and κ which give a satisfactory fit of the observed dependence of Lp/Rp on RpΔp (Fig. 5). These combinations are presented in Fig. 10. It is clear that from the micropipette aspiration experiment alone, it would not be possible to obtain the values of the constants μ and κ appearing in Eq. (27). However, it is satisfactory to note that if the spring network model which predicts that κ = 2μ gives μ ~ 13 μN/m, the apparent shear modulus obtained by assuming local inextensibility of the RBC membrane (κ = ∞) is μm ~ 8.5 μN/m which is of the order of the value of the apparent modulus obtained from micropipette studies (6.6 ± 1.2 μN/m) (Waugh and Evans 1979).
Fig. 10.
Functional relationship for values of the coefficients κ and μ that provide a match to experimental measurements of the projection length as a function of pressure in micropipette aspiration experiments
5 Conclusions
We have developed a novel formulation to describe the elasticity of the RBC membrane skeleton based on the idea that the macroscopic properties of the membrane can be derived from a collection of randomly oriented Hookean springs. The simplicity of our approach has enabled us to derive closed-form expressions for the elastic energy of the surface, the membrane force resultants and elastic moduli in terms of the principal extension ratios of the deformation. Moreover, we show that for this form, the distribution of molecular densities in the deformed state is independent of spring stiffness. While the actual force versus length relationship for spectrin molecules is almost certainly more complex (Rief et al. 1999; Law et al. 2003; Paramore and Voth 2006), the behavior of simple harmonic springs approximates all of the more complex molecular models for small deformations and in fact matches the expected worm-like chain behavior over a fairly wide range. This is significant, because it suggests that our conclusions regarding the independence of skeletal density distribution from molecular stiffness should be approximately correct even for more realistic molecular potentials. Clearly, our simple approach is likely not applicable for very large deformations, as it is expected that the resistance of spectrin molecules to extension should increase sharply as its end-to-end distance approaches its maximum contour length. How this will affect membrane behavior at large extensions and whether unfolding of spectrin domains might limit worm-like chain effects must await further investigation.
Appendix 1: Description of the numerical procedure
Equation 18 is a differential equation of second order, and we translate it to a system of two differential equations of first order:
| (30) |
The undeformed RBC area is a disk with radius RIII = (A0/4π)1/2 and is divided into three sections, each corre sponding to a different region of the deformed membrane: cap, cylinder and annulus. Because each section has a different contour function s(r), the corresponding deformations are obtained from different versions of Eq. 30 subject to the constraints that s and s0 must be continuous across boundaries from the beginning of Sect. 1 to the end of Sect. 3 (Fig. 6a).
The contour functions in case of deformation from a flat disk to a spherical cap are:
| (31) |
where R is the radius of the spherical cap and can be determined from the meniscus height h and the pipette radius Rp
| (32) |
For the cylindrical section, the contour functions are:
| (33) |
and for deformation from a larger to a smaller annulus, the relationships are:
| (34) |
where sp is the length of the contour within the micropipette. The mapping function between the shapes s0 (s) is determined by requiring area preservation and applying the condition that the extension ratios at the pole are the same λm = λp. Numerically, we set the value of λm at the pole as λm = 1/γ and making the first step of integration s0 = γ s. The value of γ is obtained by iteration to satisfy the requirement that the value of s0 at the end of the third section matches the initial disk radius RIII.
Appendix 2
For our present model, it is straightforward to calculate the dependence of the continuum moduli κ and μ on extension ratios:
| (35) |
| (36) |
for λ1 > λ2, and with indices interchanged when the inequality is not satisfied. At first, the second term in the expression for μ appears to be singular for λ1 = λ2, but a careful analysis of this term reveals the following limit:
| (37) |
From Fig. 9, it is evident that these two coefficients for a material made up of randomly oriented springs are strongly dependent on deformation, with the shear modulus increasing dramatically with extension and the area modulus decreasing with expansion. This indicates that such a material would “prefer” to decrease its local density than stretch when membrane deformations are large. As indicated in the discussion, experiments involving aspiration of small portions of red cell membrane into a micropipette, by themselves, do not enable us to determine whether this behavior is exhibited by RBC membrane, but future experiments using fluorescence to image changes in local skeletal density could provide a test of this prediction.
Footnotes
Electronic supplementary material The online version of this article (doi:10.1007/s10237-015-0721-x) contains supplementary material, which is available to authorized users.
Compliance with ethical standards
Conflicts of interest The authors declare that they have no conflict of interest for these studies.
References
- An X, Mohandas N. Disorders of red cell membrane. Br J Haematol. 2008;141:367–375. doi: 10.1111/j.1365-2141.2008.07091.x. [DOI] [PubMed] [Google Scholar]
- Byers TJ, Branton D. Visualization of protein associations in the erythrocyte-membrane skeleton. Proc Natl Acad Sci USA. 1985;82:6153–6158. doi: 10.1073/pnas.82.18.6153. [DOI] [PMC free article] [PubMed] [Google Scholar]
- Chen M, Boyle FJ. Investigation of membrane mechanics using spring networks: application to red-blood-cell modelling. Mater Sci Eng C. 2014;43:506–516. doi: 10.1016/j.msec.2014.07.043. [DOI] [PubMed] [Google Scholar]
- Dao M, Li J, Suresh S. Molecularly based analysis of deformation of spectrin network and human erythrocyte. Mater Sci Eng C. 2006;26:1232–1244. [Google Scholar]
- Dimitrakopoulos P. Analysis of the variation in the determination of the shear modulus of the erythrocyte membrane: effects of the constitutive law and membrane modeling. Phys Rev E. 2012;85(1–10):041917. doi: 10.1103/PhysRevE.85.041917. [DOI] [PMC free article] [PubMed] [Google Scholar]
- Discher DE, Mohandas N. Kinematics of red cell aspiration by fluorescence-imaged microdeformation. Biophys J. 1996;71:1680–1694. doi: 10.1016/S0006-3495(96)79424-9. [DOI] [PMC free article] [PubMed] [Google Scholar]
- Discher DE, Mohandas N, Evans EA. Molecular maps of red cell deformation: hidden elasticity and in situ connectivity. Science. 1994;266:1032–1035. doi: 10.1126/science.7973655. [DOI] [PubMed] [Google Scholar]
- Discher DE, Boal DH, Boey SK. Simulations of the erythrocyte skeleton at large deformation. II. Micropipette aspiration. Biophys J. 1998;75:1584–1597. doi: 10.1016/S0006-3495(98)74076-7. [DOI] [PMC free article] [PubMed] [Google Scholar]
- Evans EA. New membrane concept applied to the analysis of fluid shear- and micropipette-deformed red blood cells. Biophys J. 1973;13:941–954. doi: 10.1016/S0006-3495(73)86036-9. [DOI] [PMC free article] [PubMed] [Google Scholar]
- Fedosov DA, Caswell B, Karniadakis GE. A multiscale red blood cell model with accurate mechanics, rheology, and dynamics. Biophys J. 2010;98:2215–2225. doi: 10.1016/j.bpj.2010.02.002. [DOI] [PMC free article] [PubMed] [Google Scholar]
- Grey JL, Kodippili GC, Simon K, Low PS. Identification of contact sites between ankyrin and band 3 in the human erythrocyte membrane. Biochemistry. 2012;51:6838–6846. doi: 10.1021/bi300693k. [DOI] [PMC free article] [PubMed] [Google Scholar]
- Hansen JC, Skalak R, Chien S, Hoger A. An elastic network model based on the structure of the red blood cell membrane skeleton. Biophys J. 1996;70:146–166. doi: 10.1016/S0006-3495(96)79556-5. [DOI] [PMC free article] [PubMed] [Google Scholar]
- Hansen JC, Skalak R, Chien S, Hoger A. Influence of network topology on the elasticity of the red blood cell membrane skeleton. Biophys J. 1997;72:2369–2381. doi: 10.1016/S0006-3495(97)78882-9. [DOI] [PMC free article] [PubMed] [Google Scholar]
- Hartmann D. A multiscale model for red blood cell mechanics. Biomech Model Mechanobiol. 2010;9:1–17. doi: 10.1007/s10237-009-0154-5. [DOI] [PubMed] [Google Scholar]
- Hochmuth RM, Waugh RE. Erythrocyte membrane elasticity and viscosity. Ann Rev Physiol. 1987;49:209–219. doi: 10.1146/annurev.ph.49.030187.001233. [DOI] [PubMed] [Google Scholar]
- Ipsaro JJ, Harper SL, Messick TE, Marmorstein R, Mondragón A, Speicher DW. Crystal structure and functional interpretation of the erythrocyte spectrin tetramerization domain complex. Blood. 2010;115:4843–4852. doi: 10.1182/blood-2010-01-261396. [DOI] [PMC free article] [PubMed] [Google Scholar]
- Kuzman D, Svetina S, Waugh RE, Žekš B. Elastic properties of the red blood cell membrane that determine echinocyte deformability. Eur Biophys J. 2004;33:1–15. doi: 10.1007/s00249-003-0337-4. [DOI] [PubMed] [Google Scholar]
- Law R, Carl P, Harper S, Dalhaimer P, Spreicher DW, Discher DE. Cooperativity in forced unfolding of tandem spectrin repeats. Biophys J. 2003;84:533–544. doi: 10.1016/S0006-3495(03)74872-3. [DOI] [PMC free article] [PubMed] [Google Scholar]
- Li J, Dao M, Lim CT, Suresh S. Spectrin-level modeling of the cytoskeleton and optical tweezers stretching of the erythrocyte. Biophys J. 2005;88:3707–3718. doi: 10.1529/biophysj.104.047332. [DOI] [PMC free article] [PubMed] [Google Scholar]
- Li X, Vlahovska PM, Karniadakis GE. Continuum- and particle-based modeling of shapes and dynamics of red blood cells in health and disease. Soft Matter. 2013;9:28–37. doi: 10.1039/C2SM26891D. [DOI] [PMC free article] [PubMed] [Google Scholar]
- Lim GHW, Wortis M, Mukhopadhyay R. Stomatocyte– discocyte–echinocyte sequence of the human red blood cell: evidence for the bilayer–couple hypothesis from membrane mechanics. Proc Natl Acad Sci. 2002;99:16766–16769. doi: 10.1073/pnas.202617299. [DOI] [PMC free article] [PubMed] [Google Scholar]
- Liu SC, Derick H, Palek J. Visualization of the hexagonal lattice in the erythrocyte membrane skeleton. J Cell Biol. 1987;104:527–536. doi: 10.1083/jcb.104.3.527. [DOI] [PMC free article] [PubMed] [Google Scholar]
- Markin VS, Kozlov MM. Mechanical properties of the red cell membrane skeleton—analysis of axisymmetric deformations. J Theor Biol. 1988;133:147–167. doi: 10.1016/s0022-5193(88)80002-x. [DOI] [PubMed] [Google Scholar]
- Mohandas N, Evans EA. Mechanical properties of the red cell membrane in relation to molecular structure and genetic effects. Ann Rev Biophys Biomol Struct. 1994;23:787–818. doi: 10.1146/annurev.bb.23.060194.004035. [DOI] [PubMed] [Google Scholar]
- Mukhopadhyay R, Lim GHW, Wortis M. Echinocyte shapes: bending, stretching, and shear determine spicule shape and spacing. Biophys J. 2002;82:1756–1772. doi: 10.1016/s0006-3495(02)75527-6. [DOI] [PMC free article] [PubMed] [Google Scholar]
- Paramore S, Voth GA. Examining the influence of linkers and tertiary structure in the forced unfolding of multiple-repeat spectrin molecules. Biophys J. 2006;91:3436–3445. doi: 10.1529/biophysj.106.091108. [DOI] [PMC free article] [PubMed] [Google Scholar]
- Peng Z, Asaro RJ, Zhu Q. Multiscale simulation of erythrocyte membranes. Phys Rev E. 2010;81(1–11):031904. doi: 10.1103/PhysRevE.81.031904. [DOI] [PMC free article] [PubMed] [Google Scholar]
- Pivkin IV, Karniadakis GE. Accurate coarse-grained modelling of red blood cells. Phys Rev Lett. 2008;101:118115. doi: 10.1103/PhysRevLett.101.118105. [DOI] [PubMed] [Google Scholar]
- Randles LG, Rounsevell RWS, Clarke J. Spectrin domains lose cooperativity in forced unfolding. Biophys J. 2007;92:571–577. doi: 10.1529/biophysj.106.093690. [DOI] [PMC free article] [PubMed] [Google Scholar]
- Rief M, Pascual J, Saraste M, Gaub HE. Single molecule force spectroscopy of spectrin repeats: low unfolding forces in helix bundles. J Mol Biol. 1999;286:553–561. doi: 10.1006/jmbi.1998.2466. [DOI] [PubMed] [Google Scholar]
- Skalak R, Torezen A, Zarda RP, Chien S. Strain energy function of red blood cell membrane. Biophys J. 1973;13:245–264. doi: 10.1016/S0006-3495(73)85983-1. [DOI] [PMC free article] [PubMed] [Google Scholar]
- Stokke BT, Mikkelsen A, Elgsaeter A. The human-erythrocyte membrane skeleton may be an ionic gel. 1. Membrane mechanochemical properties. Eur Biophys J. 1986;13:203–218. doi: 10.1007/BF00260368. [DOI] [PubMed] [Google Scholar]
- Svetina S, Žekš B. The elastic deformability of closed multilayered membranes is the same as that of a bilayer membrane. Eur Biophys J. 1992;21:251–255. doi: 10.1007/BF00185119. [DOI] [PubMed] [Google Scholar]
- Svetina S, Žekš B. Nonlocal membrane bending: a reflection, the facts and its relevance. Adv Colloid Interface Sci. 2014;208:189–196. doi: 10.1016/j.cis.2014.01.010. [DOI] [PubMed] [Google Scholar]
- Waugh RE, Evans EA. Thermoelasticity of the red blood cell membrane. Biophys J. 1979;26:115–132. doi: 10.1016/S0006-3495(79)85239-X. [DOI] [PMC free article] [PubMed] [Google Scholar]
- Zarda PR, Chien S, Skalak R. Elastic deformation of red blood cells. J Biomech. 1977;10:211–221. doi: 10.1016/0021-9290(77)90044-6. [DOI] [PubMed] [Google Scholar]
- Zhu Q, Asaro RJ. Spectrin folding versus unfolding reactions and RBC membrane stiffness. Biophys J. 2008;94:2529–2545. doi: 10.1529/biophysj.107.119438. [DOI] [PMC free article] [PubMed] [Google Scholar]


