Abstract
Recently, hydrogen sulfide was experimentally found to show the high superconducting critical temperature (Tc) under high-pressure. The superconducting Tc shows 30–70 K in pressure range of 100–170 GPa (low-Tc phase) and increases to 203 K, which sets a record for the highest Tc in all materials, for the samples annealed by heating it to room temperature at pressures above 150 GPa (high-Tc phase). Here we present a solid H5S2 phase predicted as the low-Tc phase by the application of the genetic algorithm technique for crystal structure searching and first-principles calculations to sulfur-hydrogen system under high-pressure. The H5S2 phase is thermodynamically stabilized at 110 GPa, in which asymmetric hydrogen bonds are formed between H2S and H3S molecules. Calculated Tc values show 50–70 K in pressure range of 100–150 GPa within the harmonic approximation, which can reproduce the experimentally observed low-Tc phase. These findings give a new aspect of the excellent superconductivity in compressed sulfur-hydrogen system.
Search for room-temperature superconductors is a challenging study in materials science, and pressurization and hydrogenation have been considered as a way to push up the superconducting critical temperature, Tc, to the higher region1. Recently, high Tc superconductivity was experimentally observed in compressed hydrogen sulfide (H2S) and Tc reaches 203 K at 150 GPa2,3, which exceeds copper oxide superconductors4,5 and sets a record for the highest Tc. In the experiments, the superconducting Tc shows 30–70 K in pressure range of 100–170 GPa for the H2S samples loaded at 100–150 K and compressed to 100 GPa (low-Tc phase) and increases to 203 K for the samples annealed by heating it to room temperature at pressures above 150 GPa (high-Tc phase). The pressure-temperature path dependence of Tc is considered to be involved by changes of stoichiometry from H2S, but the details have not been identified completely. Therefore, further studies on sulfur-hydrogen system under high-pressure are required for the understanding of the mechanism for its excellent superconductivity.
Stoichiometry, crystal structure, and superconductivity of sulfur-hydrogen system under high-pressure have been investigated by first-principles calculations based on the density functional theory (DFT)6,7,8,9,10,11,12,13,14,15,16,17. Duan et al. predicted that H2S is stable below 43 GPa and decomposes into H3S and S above the pressure8. For H2S, a monoclinic P2/c structure transforms into a monoclinic Pc structure at 27 GPa. H3S shows the sequence of pressure-induced structural phase transitions as follows: triclinic P1 → orthorhombic Cccm (37–111 GPa) → trigonal R3m (111–180 GPa) → cubic Im-3m. Other hydrogen-rich stoichiometries, H4S, H5S, and H6S, were reported to be unstable up to at least 300 GPa8. Errea et al. predicted the stabilizations of HS2 above 200 GPa and HS above 300 GPa by including zero-point energy9. HS2 crystallizes in a monoclinic C2/c and it transforms into a monoclinic C2/m above 250 GPa. HS takes a monoclinic C2/m. Recently, energetically competitive stoichiometries, H2S3, H3S2, and H4S3 were identified14. H2S3 and H3S2 are unstable above 25 and 34 GPa, respectively, whereas H4S3 is thermodynamically stable in pressure range from 25 to 113 GPa, in which an orthorhombic P212121 structure is formed in pressure range of 25–60 GPa and an orthorhombic Pnma in 60–113 GPa.
For the superconductivity, Tc calculated for Im-3m H3S with the inclusion of anharmonic effects shows 194 K at 200 GPa9,10, which is in good agreement with recent results of synchrotron x-ray diffraction measurements combined with electrical resistance measurements for the high-Tc phase18. On the other hand, for R3m H3S stabilized below 180 GPa, the calculated Tc is lower by approximately 50 K than the experimentally observed one9,10,14. For the low-Tc phase, H2S has been considered as a candidate, and Tc is predicted to be 30–60 K for pressure range of 130–160 GPa in a triclinic P-1 structure and 80–40 K for 160–250 GPa in an orthorhombic Cmca6,11. However, the calculated Tc dose not completely reproduce the experimental data in the pressure region except for 150–160 GPa. For other stoichiometries, the calculated Tc values of C2/c HS2, C2/m HS2, C2/m HS, and Pnma H4S3 are 23.4 K for the effective screened Coulomb repulsion constant μ* of 0.16 at 200 GPa9, 14.9 K at 250 GPa9, 23.4 K at 300 GPa9, and 0.75 K at 300 GPa14, respectively, which are all far from the experimentally observed values.
Results
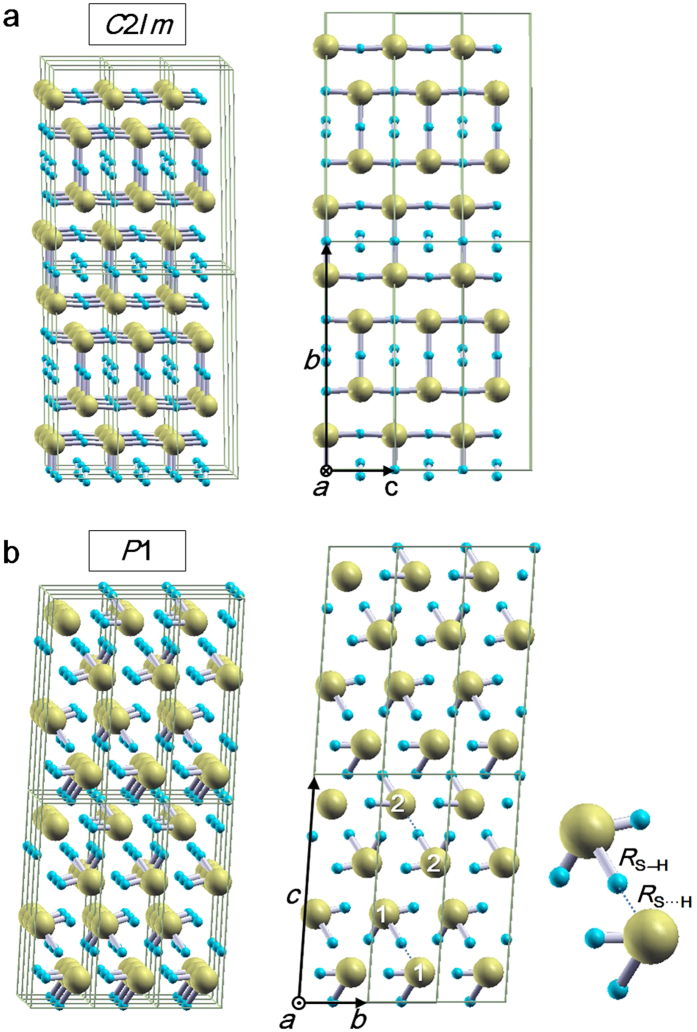
In the present study, we focus on another stoichiometric compound, H5S2, which has hydrogen content between H2S and H3S. We first explored stable structures of H5S2 by the genetic algorithm (GA) technique and first-principles calculations based on DFT, and then compared formation enthalpy per atom among the obtained structures in pressure range from 50 to 250 GPa (Fig. 1). The formation enthalpy was calculated as follows: △H = HH5S2−5/7HH−2/7HS, where HH5S2, HH, and HS are the enthalpies per atom of H5S2, pure hydrogen (H), and pure sulfur (S), respectively. At 50 GPa, H5S2 takes a disorderly mixed structure of H2S and H2 molecules. At 64 GPa, a monoclinic C2/m structure is stabilized. In this structure, four H atoms form two H2 molecules, and the other H atoms make covalent bonds with the S atoms (Fig. 2a). The C2/m structure transforms into a triclinic P1 structure at 92 GPa. In this phase, H5S2 takes a mixed structure of H2S and H3S molecules, between which asymmetric hydrogen bonds are formed (Fig. 2b). This structure is also interpreted as a member of the Magnéli-like crystals reported very recently19.
Figure 1. Formation enthalpy per atom, H, of crystal structures obtained by the application of the GA technique to the H5S2 stoichiometry.
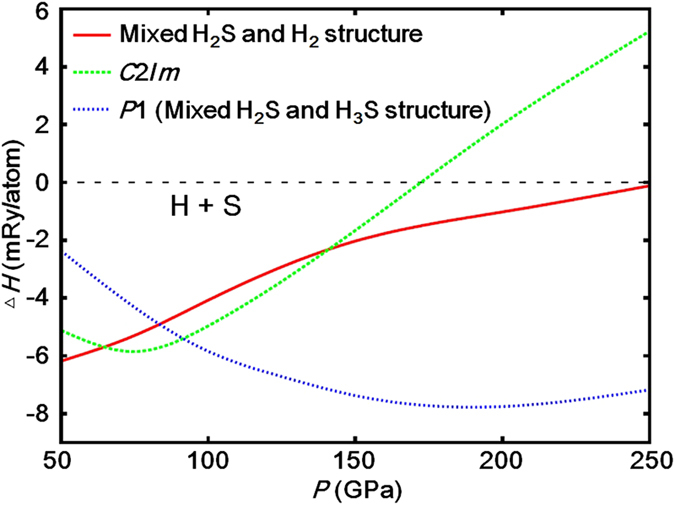
H5S2 takes a disorderly mixed structure of H2S and H2 molecules at 50 GPa, and it transforms into a monoclinic C2/m at 64 GPa and then into a triclinic P1 with mixed H2S and H3S structure at 92 GPa.
Figure 2. Crystal structures obtained by the GA technique.
(a) A monoclinic C2/m. The lattice parameters at 75 GPa are as follows: a = 2.1813Å, b = 10.5741Å, c = 3.0907Å, and γ = 77.563°. The S atoms occupy a 4i site with (0.1420, 0.8507, 0), and the H atoms a 2a site and two 4i sites with (0.4323, 0.4710, 0) and (0.1476, 0.3429, 0). (b) A triclinic P1 with a mixed structure of H2S and H3S molecules. The lattice parameters at 112 GPa are a = 2.7127Å, b = 2.7119Å, c = 8.6105Å, α = 84.706°, β = 84.447°, and γ = 71.868°. All the atoms occupy 1a sites: (0.1869, 0.1539, 0.3865), (0.2812, 0.2819, 0.8685), (0.7196, 0.7232, 0.1301), and (0.8252, 0.8495, 0.6114) for S, and (0.6031, 0.5675, 0.7345), (0.7238, 0.8394, 0.8735), (0.1554, 0.2735, 0.1260), (0.0269, 0.9946, 0.9939), (0.7166, 0.5739, 0.4144), (0.2905, 0.4248, 0.5862), (0.0626, 0.0306, 0.7276), (0.9602, 0.9548, 0.2744), (0.4342, 0.4268, 0.2592), and (0.5163, 0.4870, 0.0020) for H. Asymmetric hydrogen bonds are formed between the H2S and H3S molecules: (1) RS–H = 1.4886Å and RS.H = 1.5929Å, and (2) RS–H = 1.4441Å and RS.H = 1.6596Å, where the numbers in parenthesis correspond to those represented on the S atom and R shows the distance between S and H.
Next, we investigated thermodynamic stability of H5S2 from the convex hull diagram with respect to the H-S stoichiometric compounds, HxS1−x. Figure 3a shows the static formation enthalpy per atom of the compounds as a function of x, which is defined as ΔH (x) = H(x)−xHH−(1−x)HS, at 112 GPa. The structures of the compounds are as follows: β-Po for S 20, Pnma for H4S314, P-1 for H2S6, P1 for H5S2, R3m for H3S7, and B2/n for H21. The results show that H4S3 and H5S2 are below the line connecting between H3S and S (dotted line) but H4S3 is above the line connecting between H5S2 and S. As the results, H5S2 and H3S are the compounds on the convex hull (solid line) and are thermodynamically stable at 112 GPa, whereas H4S3 and H2S are predicted to be decomposed at this pressure. Figure 3b shows the formation enthalpies of H4S3 + H3S and H3S + S relative to that of H5S2 as a function of pressure. H5S2 is composed from H4S3 and H3S at 110 GPa (H4S3 + 7H3S → 5H5S2), and is decomposed into H3S and S at 123 GPa (3H5S2 → 5H3S + S).
Figure 3. Formation enthalpy per atom as a function of x for HxS1−x compounds. a, The formation enthalpies of H4S3, H2S, H5S2, and H3S compounds at pressure of 112 GPa.
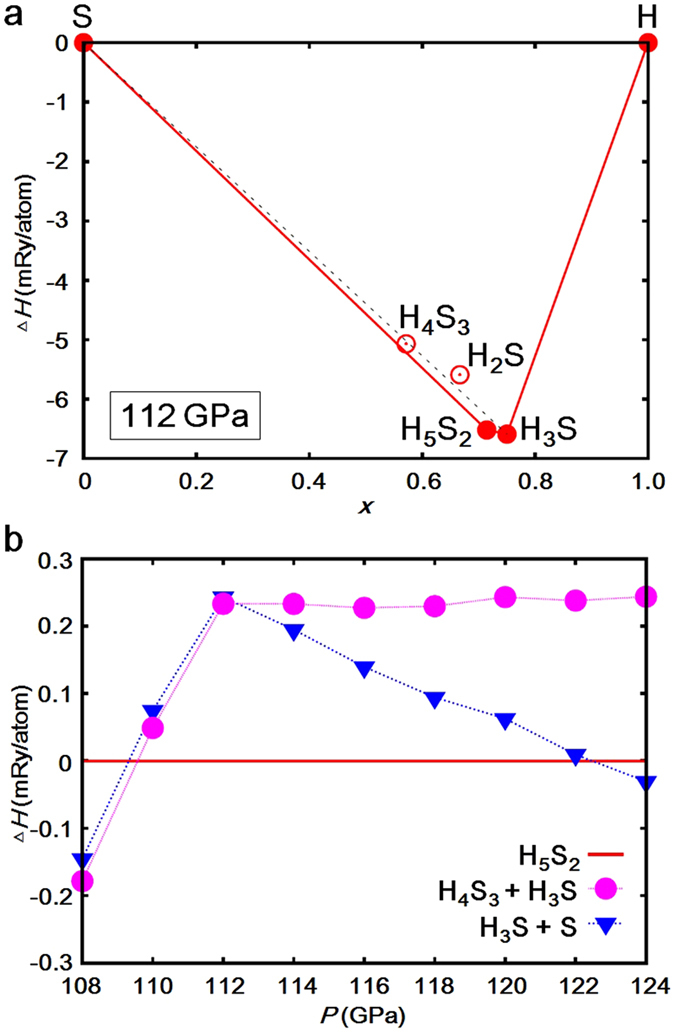
The H5S2 and H3S compounds are on a convex hull shown by solid line, which indicates that the compounds are thermodynamically stable at this pressure. The other compounds are above the convex hull (open circle), which are predicted to be decomposed. b, Pressure dependence of the enthalpies for H5S2, H4S3 + H3S, and H3S + S. H5S2 is composed from H4S3 and H3S at 110 GPa (H4S3 + 7H3S → 5H5S2) and is decomposed into H3S and S at 123 GPa (3H5S2 → 5H3S + S).
Figure 4 shows electronic band structure and density of states (DOS) for P1 H5S2 at 112 GPa. Antibonding bands formed by hybridization of S 3p and H 1s states, pushed up in the energy owing to the high pressure, appear as flat band dispersions at the Fermi level (EF) at around the Г symmetry point by overlapping conduction bands. As the results, DOS at EF, i.e. N(EF), is increased and H5S2 is a good metal. The hybridization is remarkable at EF, similar to the cases of H2S and H3S predicted earlier6,7,12, whereas for a ratio of the H 1s state to N(EF) there is a clear distinction among the compounds: NH(EF) /N(EF) ≈ 0.50 for H3S at 130 GPa7, NH(EF)/N(EF) ≈ 0.45 for H5S2 at 112 GPa, and NH(EF) /N(EF) ≈ 0.25 for H2S at 130 GPa6. Therefore, H5S2 and H3S show a larger contribution of H to the electrons at EF than H2S.
Figure 4. Electronic band structure and density of states (DOS) for P1 H5S2 at 112 GPa.
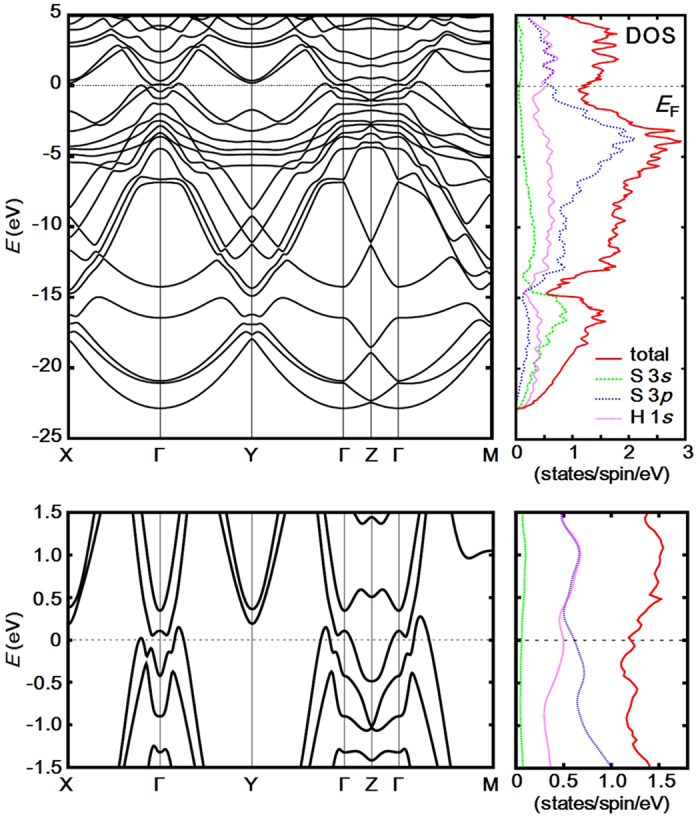
The lower panel shows a close-up view around the Fermi level (EF). The calculated band structure forms flat bands near EF at around the Г symmetry point and H5S2 is a good metal. The partial DOS shows that S 3p and H 1s are strongly hybridized at EF.
We investigated the superconductivity of metallic P1 H5S2 within the harmonic approximation. Table 1 lists electron-phonon coupling constant λ, logarithmic-averaged phonon frequency ωlog, and Tc calculated for P1 H5S2. The calculated Tc values show 70.1–79.1 K for μ* = 0.13 and 58.3–66.5 K for μ* = 0.17 in pressure region of 112–130 GPa, which is close to the data for the experimentally observed low-Tc phase. We also list the similar data for P-1 H2S6,11 at 130 GPa considered as a candidate of the low-Tc phase. The ωlog value of P1 H5S2 is almost identical to that of P-1 H2S, whereas the λ value P1 H5S2 is almost 1.5 times as large as that of P-1 H2S. The larger λ value is considered to be involved by the larger contribution of H to the electrons at EF as mentioned above. As the results, Tc of P1 H5S2 is higher by approximately 40 K than that of P-1 H2S.
Table 1. Superconductivity of P1 H5S2.
| P (GPa) | λ | ωlog (K) | μ* | Tc (K) | ||
|---|---|---|---|---|---|---|
| H5S2 | 112 | 1.1856 | 898 | 0.13 | 70.1 | |
| 0.17 | 58.3 | (46.6) | ||||
| 120 | 1.2390 | 907 | 0.13 | 75.2 | ||
| 0.17 | 63.2 | (50.6) | ||||
| 130 | 1.2417 | 951 | 0.13 | 79.1 | ||
| 0.17 | 66.5 | (53.2) | ||||
| H2S | 130 | 0.77 | 950 | 0.13 | 33 | |
| 0.801 | 913 | 0.155 | 29.4 | (23.5) | ||
| Exp. | 115 | 30, 50 | ||||
| 122 | 40 | |||||
| 130 | 55 |
Superconducting parameters calculated for P1 H5S2 within the harmonic approximation: electron-phonon coupling constant λ, logarithmic-averaged phonon frequency ωlog, and superconducting critical temperature Tc. Effective screened Coulomb repulsion constant μ* is assumed to be 0.13 − 0.17. The calculated data for H2S and experimental data are taken from refs 3, 6 and 11, respectively. The values in parentheses show the Tc values decreased by 20%, which are expected in the calculations with the inclusion of the anharmonic effect.
We plotted the Tc values obtained at μ* = 0.17 for P1 H5S2 with the earlier-predicted Tc data for the H2S6,11, H3S7,10,11, H4S314, and HS29 compounds and compared it with the experimental data3 (Fig. 5). Phonon calculations indicate that P1 H5S2 is mechanically stable to at least 150 GPa (Fig. 6) and is expected to sustain as a metastable phase above 122 GPa owing to high kinetic barrier, rigid grain boundary, etc. The Tc value shows 49.5 K at 100 GPa, slightly increases with pressurization, and reaches 71.8 K at 150 GPa, which are in good agreement with the experimental data below 170 GPa in the low-Tc phase. These results suggest that P1 H5S2 is a better candidate for the low-Tc phase than H2S, H4S3, and HS2.
Figure 5. Superconducting critical temperature Tc of the H5S2, H2S, H3S, H4S3, and HS2 compounds.
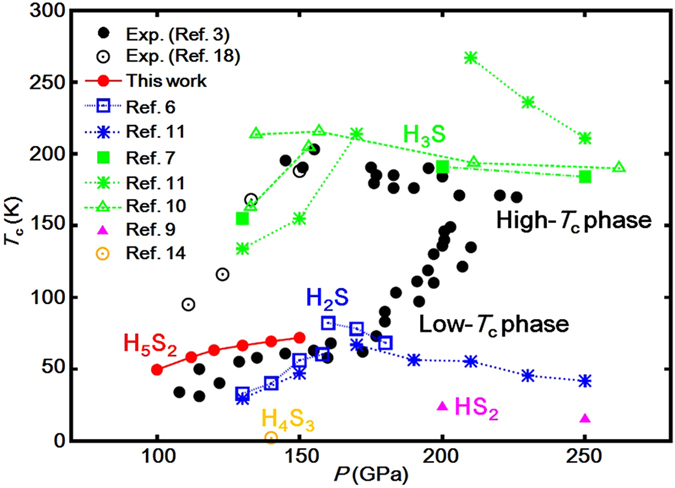
For H5S2, Tc is obtained by the Allen-Dynes formula with the effective screened Coulomb repulsion constant μ* of 0.17. Calculated Tc data of the other compounds and the experimental data are taken from refs 3, 6, 7, 9, 10, 11, 14 and 18, respectively. The H5S2 phase reproduces the experimental data below 170 GPa in the low-Tc phase.
Figure 6. Phonon dispersion curves and density of states for P1 H5S2 at 150 GPa.
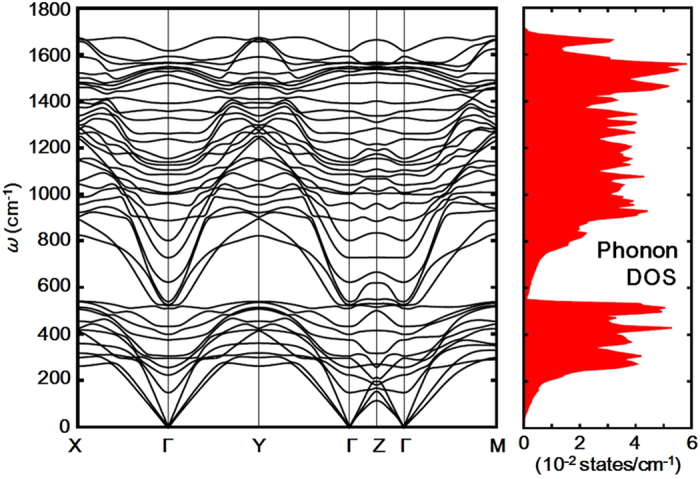
P1 H5S2 is thermodynamically unstable above 122 GPa but is mechanically stable to at least 150 GPa.
Discussion
We searched for stable crystal structures of the H5S2 stoichiometry, which has hydrogen content between H2S and H3S, by the genetic algorithm technique, and found three structures in pressure range from 50 to 250 GPa. H5S2 takes the disorderly mixed structure of H2S and H2 molecules below 64 GPa, and it transforms into the monoclinic C2/m structure. By further compression, the triclinic P1 structure with asymmetric hydrogen bonds formed between H2S and H3S emerges above 92 GPa. The convex hull diagram with respect to the H-S compounds shows that P1 H5S2 is thermodynamically stable in the pressure region from 110–123 GPa. By further compression, P1 H5S2 is predicted to decompose into R3m H3S and S: 3 H5S2 → 5H3S + S.
We calculated the superconducting Tc for P1 H5S2 and obtained the values of 49.5–71.8 K in pressure region of 100–150 GPa within the harmonic approximation, which shows better superconductivity than P-1 H2S owing to the large contribution of the H 1s electrons to N(EF). Errea et al. reported the importance of the anharmonicity in sulfur hydrides under high-pressure9,10. The anharmonicity hardens H-S stretching modes and softens H-S bending modes, which causes a suppression of λ. As the results, Tc is decreased by approximately 20% (see Table II in ref. 9). In addition, Akashi et al. nonempirically determined μ* as 0.155 for H2S and 0.168 for H3S at 130 GPa11. Considering these earlier works, we expect that Tc can be corrected to 46.6 K at 112 GPa and 53.2 K at 130 GPa in P1 H5S2, which are in good agreement with the experimental data for the low-Tc phase (see Table 1). Our predicted P1 H5S2 is mechanically stable to at least 150 GPa, whereas imaginary phonon frequency appears above the pressure. However, the stable region of the P1 H5S2 phase is expected to be shifted in higher pressure with the inclusion of the anharmonic effects because the phonon frequency is reported to be pushed up in H3S owing to the anharmonic effects9,10. Therefore, the sharp increase of Tc experimentally observed above 170 GPa in the low-Tc phase2,3 is probably involved by the structural phase transition from P1 or the decomposition of H5S2 into H3S via the intermediate Magnéli phases19, i.e. the transition from the low-Tc phase into the high-Tc phase.
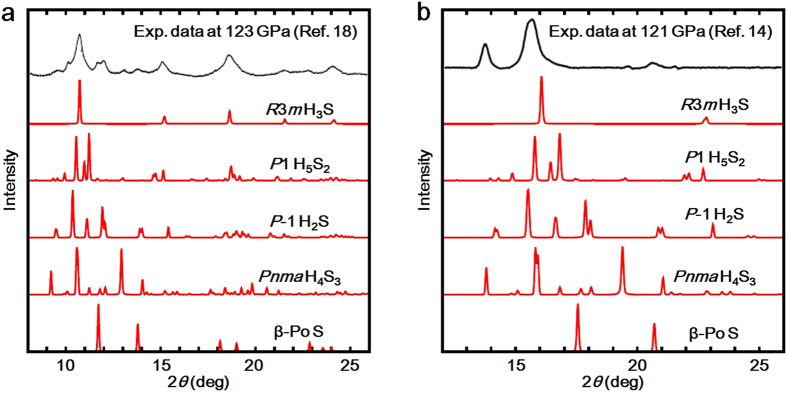
Recently, the x-ray diffraction (XRD) measurements were carried out for H-S system under high-pressure, and R3m H3S and β-Po S was experimentally confirmed in the high-Tc phase showing Tc = 203 K18. In the experimental XRD patterns, however, there are some peaks which cannot be identified only by R3m H3S and β-Po S18. We checked whether the unidentified peaks are obtained by our predicted H5S2 compound. Figure 7a shows XRD patterns of R3m H3S, P1 H5S2, P-1 H2S, Pnma H4S3, and β-Po S at 123 GPa, simulated by RIETAN-200022. The experimental XRD pattern was taken from Fig. 2a of ref. 18, which is obtained by decompression at room temperature after the high-Tc phase is observed at 150 GPa. The wavelength λ of 0.41397 Å was employed for the simulated XRD patterns, which is the same value as the experimental data. The XRD pattern of P1 H5S2 shows small diffraction peaks at around 2θ = 10° and at 2θ = 13°, which seem to correspond to the unidentified peaks observed in the experimental XRD pattern. However, we cannot clearly conclude that the experimental sample contains P1 H5S2 owing to the overlapping of many peaks. We also compared the simulated XRD patterns with another experimental data at 121 GPa, taken from Fig. 3(a) of ref. 14 (Fig. 7b). The experimental data is obtained by compression from 10 GPa at room temperature, which is a different experimental protocol from ref. 18. The wavelength λ was set at 0.6199 Å. P1 H5S2 seems to be included in the experimental XRD data with Pnma H4S3, while it is hard to explicitly claim the existence of H5S2 owing to weak intensity for small peaks in the experimental data. As noted in refs 3 and 14, dissociation products of H2S depend on pressure-temperature paths. Therefore, the H5S2 compound could be observed by further experimental search for optimum pressure-temperature paths to the low-Tc phase.
Figure 7. Comparison of x-ray diffraction (XRD) patterns.
(a) The XRD patterns at 123 GPa are simulated for R3m H3S, P1 H5S2, P-1 H2S, Pnma H4S3, and β-Po S with the wavelength λ of 0.41397Å. The experimental data is taken from Fig. 2a of ref. 18, which is obtained by decompression at room temperature after the high-Tc phase is observed at 150 GPa. (b) The XRD patterns at 121 GPa are simulated with λ of 0.6199Å. The experimental data is taken from Fig. 3(a) of ref. 14, which is obtained by compression from 10 GPa at room temperature.
Methods
We searched for crystal structures by our genetic algorithm (GA) code, which has been developed along the line proposed by Glass et al.23 and been combined with the Quantum ESPRESSO (QE) code24. In our GA search, we carried 20 structures in each generation, where 8 structures are created by “crossover”, 6 “mutation”, and 6 “permutation”. We used the simulation cells including 1 to 4 formula units for H5S2. Pressures are set at 100, 150, and 200 GPa. The generalized gradient approximation by Perdew, Burke and Ernzerhof25 was used for the exchange-correlation functional, and the Vanderbilt ultrasoft pseudopotential26 was employed. The energy cut-off of the plane wave basis was set at 80 Ry. Marzari-Vanderbilt smearing27 with the width of 0.01 Ry was used for the calculations and the k-space integration over the Brillouin zone (BZ) was performed on an 8 × 8 × 8 grid. We increased the number of k-points to a 16 × 16 × 16 grid for the most stable structures obtained through the GA search, which is enough to achieve a convergence within 0.1 mRy/atom in the enthalpy at each pressure.
The superconducting Tc was calculated by the use of the Allen-Dynes formula28.
 |
The parameters of electron-phonon coupling constant λ and logarithmic-averaged phonon frequency ωlog represent a set of characters for the phonon-mediated superconductivity. The softening on the phonon mode is induced by a strong electron-phonon interaction, i.e. large λ, resulting in a decrease of ωlog. Therefore, Tc is determined by a balance between λ and ωlog. Using the QE code, we calculated these parameters with a 4 × 4 × 4 q-point grid. The k-space integration over BZ was performed on a 16 × 16 × 8 grid, and the electron-phonon matrix element at each q-point was calculated by a 32 × 32 × 16 grid. The effective screened Coulomb repulsion constant μ* was assumed to be 0.13–0.17, which is the values nonempirically determined by DFT for superconductors in sulfur-hydrogen system (see Table VI in ref. 11).
Additional Information
How to cite this article: Ishikawa, T. et al. Superconducting H5S2 phase in sulfur-hydrogen system under high-pressure. Sci. Rep. 6, 23160; doi: 10.1038/srep23160 (2016).
Acknowledgments
This work was supported by JSPS KAKENHI, Grant-in-Aid for Specially Promoted Research (26000006) and Grant-in-Aid for Young Scientists (B) (15K17707).
Footnotes
Author Contributions T.I., A.N., K.S., H.K.-Y. and N.S. designed the project. T.I. and T.O. developed the genetic algorithm code for crystal structure search, and T.I. performed all the calculations. T.I. wrote the manuscript and all the authors reviewed it.
References
- Ashcroft N. W. Hydrogen Dominant Metallic Alloys: High Temperature Superconductors ? Phys. Rev. Lett. 92, 187002 (2004). [DOI] [PubMed] [Google Scholar]
- Drozdov A. P., Eremets M. I. & Troyan I. A. Conventional superconductivity at 190 K at high pressures. Preprint at http://arXiv.org/abs/1412.0460 (2014). [DOI] [PubMed] [Google Scholar]
- Drozdov A. P., Eremets M. I., Troyan I. A., Ksenofontov V. & Shylin S. I. Conventional superconductivity at 203 kelvin at high pressures in the sulfur hydride system. Nature 525, 73 (2015). [DOI] [PubMed] [Google Scholar]
- Schilling A., Cantoni M., Guo J. D. & Ott H. R. Superconductivity above 130 K in the Hg–Ba–Ca–Cu–O system. Nature 363, 56 (1993). [Google Scholar]
- Gao L. et al. Superconductivity up to 164 K in HgBa2Cam−1CumO2m+2+δ (m = 1, 2, and 3) under quasihydrostatic pressures. Phys. Rev. B 50, 4260(R) (1994). [DOI] [PubMed] [Google Scholar]
- Li Y., Hao J., Liu H., Li Y. & Ma Y. The metallization and superconductivity of dense hydrogen sulfide. J. Chem. Phys. 140, 174712 (2014). [DOI] [PubMed] [Google Scholar]
- Duan D. et al. Pressure-induced metallization of dense (H2S)2H2 with high-Tc superconductivity. Sci. Rep. 4, 6968 (2014). [DOI] [PMC free article] [PubMed] [Google Scholar]
- Duan D. et al. Pressure-induced decomposition of solid hydrogen sulfide. Phys. Rev. B 91, 180502(R) (2015). [Google Scholar]
- Errea I. et al. High-Pressure Hydrogen Sulfide from First Principles: A Strongly Anharmonic Phonon-Mediated Superconductor. Phys. Rev. Lett. 114, 157004 (2015). [DOI] [PubMed] [Google Scholar]
- Errea I. et al. Quantum Hydrogen-Bond Symmetrization and High-Temperature Superconductivity in Hydrogen Sulfide. Preprint at http://arXiv.org/abs/1512.02933v1 (2015). [Google Scholar]
- Akashi R., Kawamura M., Tsuneyuki S., Nomura Y. & Arita R. First-principles study of the pressure and crystal-structure dependences of the superconducting transition temperature in compressed sulfur hydrides. Phys. Rev. B 91, 224513 (2015). [Google Scholar]
- Bernstein N., Hellberg C. S., Johannes M. D., Mazin I. I. & Mehl M. J. What superconducts in sulfur hydrides under pressure and why. Phys. Rev. B 91, 060511(R) (2015). [Google Scholar]
- Heil C. & Boeri L. Influence of bonding on superconductivity in high-pressure hydrides. Phys. Rev. B 92, 060508(R) (2015). [Google Scholar]
- Li Y. et al. Dissociation products and structures of solid H2S at strong compression. Phys. Rev B 93, 020103(R) (2016). [Google Scholar]
- Bianconi A. & Jarlborg T. Lifshitz transitions and zero point lattice fluctuations in sulfur hydride showing near room temperature superconductivity. Nov. Supercond. Mater. 1, 37 (2015). [Google Scholar]
- Bianconi A. & Jarlborg T. Superconductivity above the lowest Earth temperature in pressurized sulfur hydride. EPL 112, 37001 (2015). [Google Scholar]
- Quan Y. & Pickett W. E. van Hove singularities and spectral smearing in high temperature superconducting H3S. Preprint at http://arXiv.org/abs/1508.04491v2 (2015). [Google Scholar]
- Einaga M. et al. Crystal Structure of 200 K-Superconducting Phase of Sulfur Hydride System. Preprint at http://arXiv.org/abs/1509.03156v1 (2015). [Google Scholar]
- Akashi R., Sano W., Arita R. & Tsuneyuki S. Possible “Magnéli” phases and self-alloying in the superconducting sulfur hydride. Preprint at http://arXiv.org/abs/1512.06680v1 (2015). [DOI] [PubMed] [Google Scholar]
- Luo H., Greene R. G. & Ruoff A. L. β-Po phase of sulfur at 162 GPa: X-ray diffraction study to 212 GPa. Phys. Rev. Lett. 71, 2943 (1993). [DOI] [PubMed] [Google Scholar]
- Pickard C. J. & Needs R. J. Structure of phase III of solid hydrogen. Nature Physics 3, 473 (2007). [Google Scholar]
- Izumi F. & Ikeda T. A Rietveld-analysis program RIETAN-98 and its applications to zeolites. Mater. Sci. Forum 321-324, 198 (2000). [Google Scholar]
- Glass C. W., Oganov A. R. & Hansen N. USPEX—Evolutionary crystal structure prediction. Comput. Phys. Comm. 175, 713 (2006). [Google Scholar]
- Giannozzi P. et al. QUANTUM ESPRESSO: a modular and open-source software project for quantum simulations of materials. J. Phys.: Condens. Matter 21, 395502 (2009). [DOI] [PubMed] [Google Scholar]
- Perdew J. P., Burke K. & Ernzefhof M. Generalized Gradient Approximation Made Simple. Phys. Rev. Lett. 77, 3865 (1996). [DOI] [PubMed] [Google Scholar]
- Vanderbilt D. Soft self-consistent pseudopotentials in a generalized eigenvalue formalism. Phys. Rev. B 41, 7892 (1990). [DOI] [PubMed] [Google Scholar]
- Marzari N., Vanderbilt D., De Vita A. & Payne M. C. Thermal Contraction and Disordering of the Al(110) Surface, Phys. Rev. Lett. 82, 3296 (1999). [Google Scholar]
- Allen P. B. & Dynes R. C. Transition temperature of strong-coupled superconductors reanalysed. Phys. Rev. B 12, 905 (1975). [Google Scholar]


