

SUMMARY
Medulloblastoma (MB) is a highly malignant pediatric brain tumor. Despite aggressive therapy, many patients succumb to the disease, and survivors experience severe side effects from treatment. MYC-driven MB has a particularly poor prognosis, and would greatly benefit from more effective therapies. We used an animal model of MYC-driven MB to screen for drugs that decrease viability of tumor cells. Among the most effective compounds were histone deacetylase inhibitors (HDACI). HDACI potently inhibit survival of MYC-driven MB cells in vitro, in part by inducing expression of the FOXO1 tumor suppressor gene. HDACI also synergize with phosphatidylinositol 3-kinase inhibitors (PI3KI) to inhibit tumor growth in vivo. These studies identify an effective combination therapy for the most aggressive form of MB.
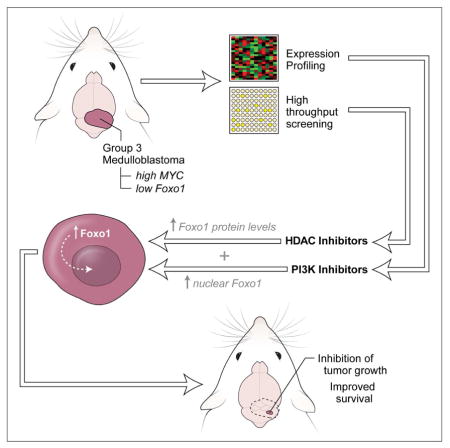
Graphical Abstract
INTRODUCTION
MB is the most common malignant brain tumor in children. Current treatments include surgical resection followed by radiation and intensive chemotherapy. Despite improvements in survival, favorable outcomes for patients with MB lag behind many other pediatric cancers and treatment is often associated with severe long-term side effects (Packer et al., 2012; Saury and Emanuelson, 2011). Moreover, treatment stratification is still mostly based on clinical variables such as age, metastatic stage, degree of surgical resection and histopathological subtype, which results in some children with favorable prognosis being over-treated and some with very poor prognosis still dying of the disease. Improved patient stratification and development of safer and more effective approaches to therapy are urgently needed.
Recent genetic studies have demonstrated that MB is comprised of four molecular subgroups – WNT, Sonic Hedgehog (SHH), Group 3 (G3) and Group 4 (G4) – that have distinct gene expression and methylation profiles, mutations and prognosis (Northcott et al., 2012). Among the most aggressive forms of MB are G3 tumors, which exhibit amplification or overexpression of the MYC oncogene: patients with these tumors are more likely to exhibit metastasis, to relapse following therapy and to die from their disease (Cho et al., 2011; Northcott et al., 2011). More effective therapies are especially important for these patients.
We recently generated a mouse model of G3 MB by overexpressing Myc and a dominant negative form of Trp53 in cerebellar stem cells, and transplanting these cells into the cerebellum of adult mice (Pei et al., 2012). Recipients develop tumors that resemble human MYC-driven MB in terms of both histology and gene expression patterns, making these animals a valuable tool for developing and testing new therapies. The goal of this study was to use our mouse model to identify more effective approaches to treatment of G3 MB.
RESULTS
High-Throughput Screen for Small Molecules that Inhibit Survival of MYC-driven MB
To screen for compounds that inhibit the survival of MYC-driven MB, we isolated cells from MYC/DNp53 (hereafter called MP) tumor-bearing mice, plated them in 384-well plates and evaluated cell viability. To optimize the assay, we first tested the effects of varying cell culture period and cell density on cell viability. BEZ-235, a PI3K/mTOR inhibitor that we previously identified as an inhibitor of MP tumor cells (Pei et al., 2012), was used as a positive control. When cells were cultured for 6–48 hr, we observed a significant inhibition of viability in BEZ-235-treated cells compared to control cells at each time point, with a maximal difference (5.9-fold) at 48 hr (Figure S1A). We also tested the effects of varying the number of cells per well. Maximal differences (6–7-fold) were observed with 8,000–16,000 cells (Figure S1B). Based on these results, we chose the 48 hr time point and used 10,000 cells/well for our screen.
For the screen, we tested compounds from 7 focused small molecule libraries (Figure 1A). All compounds were tested at 1 μM, and compounds were scored as active if they inhibited cell viability by at least 2-fold relative to control (DMSO). Of the 3642 compounds tested, 142 met these criteria (Figure 1B). These compounds represent diverse drug classes (Table S1) including antineoplastic drugs, antibiotics, and inhibitors of HDACs, PI3K/mTOR, DNA topoisomerase, and HMG CoA-reductase.
Figure 1. High-throughput screen to identify inhibitors of MYC-driven MB.

(A). Libraries used for screen. The number in the parenthesis indicates the number of compounds used for the screen within each category. (B). Effects of compounds on cell viability. Each point represents a single compound, with % activity calculated by dividing the cell viability score in the presence of that compound by the mean viability for the plate in which the compound was assayed. The red line indicates inhibition of tumor growth by ≥ 2-fold. (C) Hits from primary screen were tested on human G3 MB PDX (ICb-1572) and on normal granule neurons and astrocytes. Graph shows # of compounds that killed human MB and did not kill neurons and astrocytes. (D) Distribution of hits in secondary screen. See also Figure S1.
Identification of Compounds that Kill Human MYC-Driven MB Cells and are Not Toxic to Normal Cerebellar Cells
To determine whether the compounds identified in our primary screen could also inhibit growth of human MYC-driven MB cells, we used cells from a patient-derived xenograft (PDX) representing human MYC-driven MB. Cells were isolated from PDX-bearing mice and treated with compounds for 48 hr before assessment of viability. Among the 142 compounds active against murine (MP) tumor cells, 50 also significantly inhibited survival of human MYC-driven tumor cells (Table S1, Figure 1C).
Many drugs that kill tumor cells also exhibit substantial toxicity to normal cells. To eliminate compounds that might be broadly toxic to normal cells, we tested our 142 hits on post-mitotic cerebellar granule neurons and astrocytes, two major populations of cells in the cerebellum. We found 107 compounds that were non-toxic to neurons and 128 compounds that were non-toxic to astrocytes (Table S1, Figure 1C). Overall, 23 unique compounds (four of which appeared twice in our screen) met our criteria of killing both mouse and human tumor cells and sparing normal cells (Figure 1D). These compounds were enriched in several drug categories, including antineoplastic drugs and inhibitors of DNA topoisomerase, HDACs, protein phosphatases and HMG-CoA reductase (Table 1). To validate the results of our screen, we performed dose-response experiments on a subset of these inhibitors. As shown in Figures S1C–E, the majority of these agents inhibited growth of MP tumor cells at sub-micromolar concentrations.
Table 1.
Compounds that kill murine and human MYC-driven MB cells but are not toxic to normal cerebellar cells
| Function | Drug name |
|---|---|
| HDAC inhibitors | Apicidin Histone Deacetylase Inhibitor III HNHA Scriptaid |
| PP2A inhibitors | Cantharidin Canthridic acid |
| HMG-CoA reductase inhibitors | Cervastatin Itavastatin Ca |
| DNA topoisomerase II inhibitors | Camptothecin Doxorubicin hydrochloride Idarubicin hydrochloride Etoposide* |
| Antineoplastic agents | Amsacrine hydrochloride* Ancitabine hydrochloride* Celastrol Cytarabine* Homidium bromide Mycophenolic acid |
| Disruption of microtubule assembly | Nocodazole T113242 |
| Antibiotic/antifungal agents | Ciclopirox olamine Dactinomycin |
| IGF inhibitor | Chromeceptin |
indicates drug that appears more than once in different libraries
HDAC Inhibitors Potently Inhibit Growth of MYC-driven MB Cells in vitro
Among the 23 unique compounds identified in our screen, 4 (Apicidin, Histone Deacetylase Inhibitor III, HNHA and Scriptaid) were HDACI. To determine whether HDACI might be effective for treating G3 MB, we investigated this class of compounds in more detail. We tested 9 commercially available HDACI, including several compounds that are in clinical trials for other diseases. Cells from MP tumors and from a human G3 PDX were treated for 48 hr and viability was assessed. All compounds significantly inhibited survival of both murine and human tumor cells (Figures 2A, B). The potency of these drugs varied greatly (IC50 range 8–800 nM), but relative potencies were similar between mouse and human tumor cells. Notably, the pan-HDACI LBH-589 (panobinostat) was the most potent inhibitor of tumor cell growth in vitro. LBH-589 was at least 80-fold more potent than SAHA (suberoylanilidehydroxamic acid), an FDA approved pan-HDACI that is in clinical trials for many types of cancer. LBH-589 was recently approved for treatment of multiple myeloma and is in trials for additional malignant and non-malignant diseases but has not been evaluated in the context of MB.
Figure 2. HDACI inhibit murine and human MYC-driven MB in vitro.

(A, B). HDACI were tested for effects on viability of murine MP tumor cells (A) and human G3 PDX (MB002) cells (B). IC50 values are listed after compound names. (C). MP tumor cells, G3 PDX cells, normal granule neurons and astrocytes were treated with LBH-589 for 48 hr before viability was assessed. IC50 values for each cell type are shown. (D–F). PDX cells representing G3 (D), SHH (E), or G4 (F) MB were treated with LBH-589 for 48 hr and viability was assessed. IC50 values for each PDX are shown. Error bars represent mean ± SD.
Having observed potent inhibitory effects of LBH-589 on murine and human G3 MB cells, we next tested its effects on normal cells. As shown in Figure 2C, LBH-589 inhibited survival of cerebellar granule neurons and astrocytes, but only at much higher concentrations than those required to inhibit murine and human MYC-driven MB cells (granule neuron IC50 = 140 nM; astrocyte IC50 = 110 nM). Doses that inhibited tumor cell survival by 50% (8–10 nM) had no effect on granule neurons and astrocytes. These data suggest that LBH-589 selectively inhibits survival of MB cells, and might be a useful therapeutic agent for treatment of MYC-driven MB.
To determine whether LBH-589 was specifically active against G3 MB, we tested its effects on PDX lines representing other subgroups of MB. Although all PDX lines were sensitive to the drug, the median IC50 for G3 PDX lines (14.44 nM) was lower than those for SHH (47.4 nM) and G4 (25.27 nM) lines (Figures 2D–F). Notably, IC50s for all three subgroups of MB were much lower than those for granule neurons and astrocytes. These data suggest that LBH-589 is effective against multiple MB subgroups, with the greatest potency against G3.
Gene Expression Profiling Predicts a Role for FOXO Proteins in HDACI-mediated Inhibition
To elucidate the mechanisms by which LBH-589 suppresses growth of MYC-driven MB, we performed expression profiling using Affymetrix Mouse Gene 2.0 ST Arrays. MP tumor cells from three different animals were incubated with DMSO or LBH-589 for 6 hr or 12 hr before RNA was isolated for microarray analysis. Unsupervised hierarchical clustering (Figure 3A) and principal component analysis (Figure 3B) revealed a high level of consistency across biological replicates (tumor cells from different animals). For each replicate, treatment with LBH-589 resulted in a marked change in gene expression, both at 6 hr and at 12 hr. Using the criteria of |fold change| ≥ 2 and p value < 0.01, we found 681 genes differentially expressed at 6 hr and 792 genes differentially expressed at 12 hr. The complete list of differentially expressed (DE) genes is presented in Table S2.
Figure 3. Expression profiling identifies FOXO1 as a target of HDACI in MYC-driven MB.

(A) Unsupervised hierarchical clustering of genes differentially expressed between MP tumor cells treated with 0.00025% DMSO and with 25 nM LBH-589 for 6 or 12 hr. Colored bars (green, red, or blue) above columns denote tumor cells from the same animal. Each row represents an individual differentially expressed gene (|Fold Change| ≥ 2.0; p ≤ 0.05) in either the 6 hr (LBH-6 vs. DMSO-6) or 12 hr comparison (LBH-12 vs. DMSO-12). (B) Principal Component Analysis of gene expression profiles from (A). The first three principal components describe 53.1% of the total data variation (PC1, 24.2%; PC2, 16.8%; and PC3, 12.1%). (C, D) Ingenuity Pathway Analysis was used to generate a list of enriched Bio-functions (C) and Upstream Regulators (D) affected by LBH-589 treatment. Only Bio-functions/Regulators with activation z-scores > 2 or < −2 are shown. p values validate relationship between Bio-functions/Regulators and molecules in the category. (E) Gene sets enriched in [LBH-589 vs. DMSO] and [MP vs. NSC] (Pei et al., 2012) datasets, based on Gene Set Enrichment Analysis (GSEA). (F) GSEA enrichment score plots show positive correlation between genes induced by LBH-589 and genes containing FOXO1 binding sites (left); the same genes were depleted in MP tumors vs. NSC (right). (G) DE genes from the [LBH-589 vs. DMSO] and [MP vs. NSC] datasets (here called Biosets, or Bs) were subjected to Nextbio analysis to identify Biogroups (Bg) containing similar genes. Bar graphs show significance (p value) of overlap between genes in the Bs and in the FOXO1A Binding Site Geneset-2 Bg. See also Tables S2 to S8 and Figure S2.
To gain insight into the pathways regulated by LBH-589, we investigated the DE genes using Ingenuity Pathway Analysis (IPA) (Figures 3C, D). HDACs remove acetyl groups from core histones; this promotes formation of histone-DNA complexes, reducing access of transcription factors to DNA and thereby decreasing transcription. Conversely, HDACI’s increase histone acetylation and cause an overall increase in transcription. Consistent with this, a number of the top IPA Bio-functions induced by LBH-589 were related to DNA transcription and promoter activation (Figure 3C and Table S3). Bio-function analysis also suggested that LBH-589 decreased expression of genes associated with stem cell proliferation (Figure 3C). We also used IPA to identify upstream regulators whose target genes are altered by LBH-589 (Figure 3D and Table S4). Not surprisingly, targets of HDACs and BRD4 Bromodomain proteins (readers of histone acetylation) were decreased in response to the drug (Bandopadhayay et al., 2014; Bhadury et al., 2014). In addition, targets of MYC were significantly decreased. Conversely, targets of the transcription factors FOXO3, HNF4A and STAT4 were increased following treatment with LBH-589. FOXO and HNF4A proteins are important regulators of glucose and lipid metabolism (Gross et al., 2008; Hwang-Verslues and Sladek, 2010); thus, increased expression of their targets could explain the observation (Figure 3C) that genes associated with carbohydrate metabolism were increased and those associated with insulin sensitivity and lipid metabolism were decreased following exposure of cells to HDACI.
To determine which of the pathways regulated by LBH-589 might be important for inhibition of tumor growth, we compared the genes induced and repressed by LBH-589 with genes previously found to be altered during transformation of stem cells into MP tumors (Pei et al., 2012). Using Gene Set Enrichment Analysis (GSEA), we found 56 gene sets that were enriched in both datasets (Figure 3E and Table S5, 6). Among these, the set comprised of genes with FOXO1 binding motifs near their transcriptional start sites was significantly increased in LBH-589-treated tumor cells (Normalized Enrichment Score, NES = 1.26), while expression of the same set of genes was decreased in MP tumors compared to neural stem cells (NES = −1.74) (Figure 3F). Analysis using Nextbio software also identified FOXO1 target genes as being significantly induced by LBH-589 and significantly repressed during transformation (Figure 3G and Table S7, 8). The fact that FOXO1 target genes decrease during development of MB and increase in response to HDACI suggests that downregulation of FOXO1 may be important for transformation.
Having observed decreased expression of FOXO1 targets in MP tumors compared to normal neural stem cells, we sought to determine whether FOXO1 expression is also altered in human MB. Analysis of RNA sequencing data from more than 100 human MBs representing all four subgroups of the disease (Figures S2A–C) revealed that all subgroups of MB express lower levels of FOXO1 than normal fetal cerebellum, but the subgroups with the highest levels of MYC (WNT and G3) show especially low levels of FOXO1 (Figure S2C). Low levels of FOXO1 and high levels of MYC were also found in several human G3 MB PDX lines (Figures S2D, E). These data suggest that expression of FOXO1 and MYC is inversely correlated in both murine and human MB, consistent with the notion that FOXO1 may act to oppose the transforming effects of MYC (Bouchard et al., 2004; Peck et al., 2013).
FOXO1 is induced by HDACI and can Inhibit Growth of MYC-driven MB
The observation that FOXO targets were increased in MP tumor cells following treatment with LBH-589 raised the possibility that expression of FOXO transcription factors themselves might be induced by the drug. The FOXO family consists of three members (FOXO1, 3 and 4) with overlapping expression patterns, transcriptional activities, and biological functions (Paik et al., 2007). To determine which of these might be regulated by HDACI, we analyzed their mRNA expression by qRT-PCR in MP tumor cells treated with DMSO or LBH-589 for 6 or 12 hr. As shown in Figure 4A, LBH-589 markedly increased expression of Foxo1 (24–34 fold compared with 6 hr DMSO), but had little effect on expression of Foxo3 or Foxo4 (1–1.2 fold and 1.5–1.8 fold respectively). FOXO1 protein also increased significantly within 6 hr of drug treatment, at concentrations similar to those that induce histone acetylation at this time point (Figure 4B). Thus, LBH-589 potently induces expression of FOXO1.
Figure 4. FOXO1 mediates the effects of HDACI on tumor growth.

(A) MP tumor cells were treated with 0.00025% DMSO or 25 nM LBH-589 for 6 or 12 hr and expression of Foxo1, 3 and 4 mRNA was determined by qRT-PCR. Unpaired, one-tailed t test was used to compare Foxo1 expression in 6 or 12 hr LBH-589-treated samples to respective DMSO controls. (B) Tumor cells were treated with LBH-589 for 6 hr, and levels of FOXO1, acetylated histone H3 (Ac-H3K9 and Ac-H3K27), total histone H3 and actin (ACTB) were determined by Western blotting. Relative amounts of FOXO1 were calculated by normalizing levels of total FOXO1 to ACTB, and then comparing each treatment with levels in DMSO-treated cells (set to 1), and are shown below each band. (C) MP tumor cells were infected with lentiviruses carrying non-targeting (NT) shRNA or two different shRNAs targeting FOXO1. Cells were treated with DMSO or LBH-589 for 6 hr and Foxo1 mRNA levels were determined by qRT-PCR. Unpaired, one-tailed t tests were used to compare LBH-589-induced Foxo1 expression in cells transduced with shFOXO1 #1 or #2 to expression in cells transduced with NT shRNA. (D) Tumor cells expressing shRNAs were treated with the indicated concentrations of LBH-589 for 48 hr and viability was measured. IC50 values for each condition are shown. p values were determined by sum-of-squares F test. (E) Tumor cells were infected with GFP or FOXO1-IRES-GFP retroviruses for 24 hr and FACS-sorted for analysis of Foxo1 mRNA by qRT-PCR. p value was determined by unpaired t test. (F) GFP- or FOXO1-overexpressing cells were sorted and plated for 48 hr before assaying viability. p value was determined by unpaired t test. (G) FACS-sorted GFP- or FOXO1-overexpressing cells were transplanted into the cerebella of NSG mice (n=10 per group), and mice were euthanized when they became moribund. p value for survival was determined by Log-rank (Mantel-Cox) test. Error bars represent mean ± SD. See also Figure S3.
To determine whether FOXO1 levels influence the effects of HDACI on tumor cell viability, we infected murine MP or human PDX tumor cells with lentiviruses encoding shRNAs targeting FOXO1. As shown in Figure 4C, LBH-589 induced Foxo1 expression in cells expressing non-targeting (NT) shRNAs, and this induction was blunted by two different FOXO1 shRNAs (#1 and #2). After 48 hr, FOXO1 shRNA-expressing MP tumor cells showed reduced sensitivity to LBH-589 compared to cells expressing NT shRNA (Figure 4D). Similar results were observed in G3 PDX lines expressing FOXO1 shRNA (Figures S3A–C). To test whether FOXO1 itself is sufficient to impair growth or survival of MYC-driven MB, we generated retroviruses encoding full-length FOXO1 and used them to overexpress the protein in murine MP or human PDX tumor cells (Figures 4E and S3D). After 48 hr, FOXO1-expressing MP tumor cells showed a 35% decrease in viability and FOXO1-expressing PDX cells showed a 48–51% decrease in viability compared to control (GFP-expressing) cells (Figures 4F and S3E, F). Moreover, mice transplanted with FOXO1-overexpressing cells showed prolonged survival compared to mice transplanted with control virus-infected cells (Figure 4G). Together these results suggest that induction of FOXO1 contributes to HDACI-mediated inhibition of tumor growth.
HDACI Synergize with PI3K Inhibitors to Activate FOXO1 and Inhibit Growth of MYC-driven MB
The induction of FOXO1 by LBH-589 was notable for several reasons. First, as mentioned above, Foxo1 mRNA expression decreases during formation of MP tumors from NSCs, suggesting that high levels may be disadvantageous for tumor growth. Second, FOXO1 has been reported to function as a potent tumor suppressor. Not only can it promote cell cycle exit and apoptosis by inducing expression of CDK inhibitors and pro-apoptotic proteins, but it has also been reported to directly oppose the effects of MYC by inducing expression of MYC antagonists and inhibiting expression of MYC target genes (Bouchard et al., 2004; Delpuech et al., 2007; Zhang et al., 2011). Finally, FOXO1 activity is regulated by the PI3K-AKT pathway (phosphorylation of FOXO1 protein prevents it from entering the nucleus) (Calnan and Brunet, 2008), and our previous studies demonstrated that antagonists of this pathway also suppress growth of MP tumors (Pei et al., 2012). The fact that two classes of drugs that inhibit growth of MYC-driven MB can both activate FOXO1 – HDACI increasing its expression and PI3KI promoting its nuclear localization – supports the importance of FOXO1 in regulating tumor cell growth and survival. Moreover, the fact that these drugs regulate FOXO1 by distinct mechanisms raised the possibility that they might cooperate to inhibit tumor growth.
To determine whether PI3KI could synergize with HDACI to enhance activity of FOXO1, we examined the effects of these drugs on FOXO1 expression and phosphorylation in MP tumor cells. As shown in Figures 5A, B, LBH-589 increased the levels of FOXO1 protein, along with the levels of acetylated histones (H3K9 and H3K27). Notably, the FOXO1 protein induced by LBH-589 exhibited significant amounts of phosphorylation. The PI3KI BKM-120 had little effect on absolute levels of FOXO1, but it reduced phosphorylation of the FOXO1 protein that was induced by LBH-589 (Figures 5A, C). BKM-120 also inhibited phosphorylation of AKT and S6, known targets of PI3K signaling. Similar effects were seen in a G3 MB PDX line treated with LBH-589 and BKM-120 (Figures S4A–C). Thus, the combination of HDACI and PI3KI increases the levels of dephosphorylated FOXO1 in MYC-driven MB cells.
Figure 5. HDACI synergize with PI3KI to activate FOXO1 and suppress tumor cell survival.

(A) MP tumor cells were treated with 0.005% DMSO, 25 nM LBH-589, 1 μM BKM-120, or both drugs for 6 hr. Cells were analyzed by Western blotting. ACTB was used as a loading control. (B, C). Quantification of total and phosphorylated FOXO1. Relative amounts of FOXO1 (B) and p-FOXO1 (C) were calculated from 3 independent blots like the one shown in (A), by normalizing levels of total FOXO1 and p-FOXO1 respectively to ACTB, and then comparing each treatment with levels in DMSO-treated cells (set to 1). Unpaired, one-tailed t test was used; p values < 0.05 were considered significant. n.s., not significant. (D) MP tumor cells were treated with 0.005% DMSO, 100 nM LBH-589, 1 μM BKM-120, or both drugs for 6 hr. Nuclear and cytoplasmic fractions were separated and analyzed by Western blotting. Loading controls for the cytoplasmic and nuclear fractions were GAPDH and nuclear lamin A/C (LMNA) respectively. W, whole cell lysate; C, cytoplasmic fraction; N, nuclear fraction. (E) Relative nuclear FOXO1 protein expression was calculated from three independent Western blots like the one shown in (D), by normalizing levels of total FOXO1 in the nuclear (N) fraction to LMNA and then comparing each treatment with DMSO control (set to 1). Unpaired, one-tailed t test was used; p values < 0.05 were considered significant. (F) MP tumor cells were treated with the indicated doses of LBH-589 and BKM-120 for 48 hr before viability was assessed. Compusyn software (http://www.combosyn.com/) (Chou, 2010) was used to calculate combination indices (CIs). Criteria for synergy, additivity and antagonism are shown below the chart. (G, H) MP tumor cells were treated with the indicated concentrations of LBH-589 ± 625 nM BKM-120 (G) or the indicated concentrations of BKM-120 ± 9.77 nM LBH-589 (H) for 48 hr before evaluation of cell viability. IC50 values for each condition are shown. p values were determined by sum-of-squares F test. Error bars represent mean ± SD. See also Figure S4.
Since dephosphorylation of FOXO1 has been reported to increase its accumulation in the nucleus, we asked whether treatment with LBH-589 and BKM-120 affected nuclear localization of FOXO1. MP tumor cells were treated with the drugs for 6 hr and then cytoplasm and nucleus were separated and FOXO1 levels were examined by Western blotting. As shown in Figures 5D, E, the combination of BKM-120 + LBH-589 increased levels of FOXO1 in the nucleus, compared with vehicle (DMSO) or either drug alone. These results suggest that HDACI and PI3KI can cooperate to promote activation of FOXO1.
The ability of LBH-589 and BKM-120 to cooperate at a biochemical level prompted us to ask whether these drugs could synergize to inhibit survival of MYC-driven MB cells. To test this, we treated cells from murine MP tumors or from a human G3 PDX line with varying doses of LBH-589, BKM-120 or combinations of these two drugs. Cells were cultured for 48 hr and survival was assessed. The cytotoxicity of each treatment (% of the maximal cytotoxic effect seen with the highest dose of drug) was entered into Compusyn software to calculate the combination index (CI) (Chou, 2010). As shown in Figure 5F, at almost all doses tested, LBH-589 and BKM-120 were strongly synergistic in suppressing survival of MP tumor cells. For example, LBH-589 alone had an IC50 of 5.6 nM, whereas the addition of 625 nM BKM-120 lowered the IC50 to 0.605 nM (Figure 5G). The IC50 for BKM-120 was also markedly lowered (from 1.9 μM to 21 nM) by addition of LBH-589 (Figure 5H). Potent synergy was also seen in human G3 PDX cells (Figures S4D–F). Consistent with these results, a dual HDAC/PI3K inhibitor, CUDC-907 (Qian et al., 2012), exhibited potent suppressive activity against both murine and human MYC-driven MB cells (Figures S4G, H). These data suggest that HDACI and PI3KI synergize to inhibit of growth of MYC-driven MB cells.
To determine whether FOXO1 is important for the efficacy of the combination treatment, murine MP and human PDX tumor cells were infected with retroviruses expressing a dominant-negative form of FOXO1 (DN-FOXO1) (Nakae et al., 2000; Wang et al., 2011), then treated with either drug alone or with the two drugs in combination. As shown in Figures 6A–D, DN-FOXO1-expressing cells were significantly more resistant to combination treatment than control cells. The same effect could also be seen in MP and PDX tumor cells expressing shFOXO1, as compared to those expressing NT shRNA (Figures 6E, F). These findings suggest that the synergy between HDACI and PI3KI is mediated, at least in part, by activation of FOXO1.
Figure 6. Interfering with FOXO1 reduces sensitivity of MB cells to the combination of HDACI and PI3KI.

(A–D) Murine MP tumor cells (A), and human PDXs MED411-FH (B), MED211-FH (C), and MB002 (D) were infected with GFP or dominant-negative FOXO1 (DN-FOXO1) retroviruses for 48 hr before being treated with the indicated concentrations of LBH-589 alone or LBH-589 plus 500 nM BKM-120 for 48 hr in vitro before cell viability was measured. * in (A) indicates that maximal toxicity was not achieved with the concentrations tested, so the IC50 value might be underestimated. ** in (C) and (D) indicate that IC50 could not be determined since at maximal toxicity > 40% of the cells remained alive. (E, F) human PDX MED411-FH (E) and MED211-FH (F) were infected with lentiviruses carrying NT or FOXO1 shRNAs for 48 hr before being treated with the indicated concentrations of LBH-589 alone or LBH-589 plus 500 nM BKM-120; cells were cultured for an additional 48 hr before cell viability was evaluated. For all panels, p values were determined by sum-of-squares F test, and error bars represent mean ± SD.
HDACI and PI3K Inhibitors Cooperate to Inhibit Growth of MYC-Driven MB in vivo
In light of the potent inhibitory effects of LBH-589 and BKM-120 in vitro, we tested the efficacy of these compounds in vivo. We first determined whether systemically administered LBH-589 and BKM-120 could accumulate in intracranial tumors and affect their respective molecular targets. Consistent with our in vitro findings, we found that BKM-120 (alone or in combination with LBH-589) diminished phosphorylation of AKT and S6, whereas LBH-589 (alone or in combination with BKM-120) increased histone acetylation (Figure S5A). Moreover, animals treated with LBH-589, alone or in combination, showed an increase in total FOXO1 protein; however, animals treated with the combination showed reduced levels of FOXO1 phosphorylation compared to treatment with LBH-589 alone (Figures S5B–D). These results suggest that HDACI and PI3KI can reach intracranial tumor cells and alter their protein targets, including FOXO1.
To assess whether the combination of HDACI and PI3KI was effective at inhibiting intracranial tumor growth, we generated cohorts of MP tumor-bearing mice. Animals were subjected to weekly bioluminescence imaging, and when tumors were clearly detectable (signals in the range of 105–106 radians/second), mice with equivalent bioluminescent signals were randomized into four treatment groups: vehicle, LBH-589, BKM-120 or LBH-589 + BKM-120. Animals were treated until they displayed tumor-associated morbidity and then euthanized. Animals treated with vehicle showed rapid tumor growth and had to be sacrificed 3–4 weeks after transplantation (median survival 24 days) (Figures 7A, B). Treatment with BKM-120 or LBH-589 alone initially slowed tumor growth, but tumors eventually grew and animals had to be sacrificed (median survival 33 and 40 days respectively). The combination of BKM-120 and LBH-589 markedly inhibited tumor growth, and animals survived much longer (median survival 64 days). The combination of BKM-120 and LBH-589 also potently inhibited tumor growth in flank allografts (Figures S6A–C).
Figure 7. HDACI and PI3KI synergize to inhibit growth of MYC-driven MB in vivo.

(A–D) Mice with intracranial MP tumors (A, B) or G3 PDX MB411FH (C, D) were treated with vehicle (0.5% methyl-cellulose + 5% dextrose), 30 mg/kg BKM-120 by oral gavage, 5 mg/kg LBH-589 by intraperitoneal injection, or the LBH-589 + BKM-120 at the same doses. Bioluminescence imaging of representative mice (X’s denote animals euthanized before they could be imaged) (A, C) and survival curves (Control, n=6; BKM-120, n=7; LBH-589, n=8 and LBH+BKM, n=7) (B, D) are shown. Arrows indicate start of drug treatment. p values were determined by Log-rank (Mantel-Cox) test. See also Figures S5 and S6.
To determine whether LBH-589 and BKM-120 were also effective against human MYC-driven MB, we tested these compounds on animals carrying G3 PDXs. Cells from the PDX line MED411FH (Morfouace et al., 2014) were infected with a lentivirus encoding GFP and luciferase and transplanted into the cerebella of NSG mice. When tumors were readily detectable by bioluminescence, mice were treated with vehicle, LBH-589, BKM-120 or a combination of the two drugs. Mice treated with vehicle exhibited a median survival of 51 days. BKM-120 or LBH-589 alone increased the median survival to 65 and 59 days, respectively. In contrast, animals treated with the drug combination exhibited a median survival of 78 days, a 27-day increase compared to animals treated with vehicle (Figures 7C, D). LBH-589 and BKM-120 also significantly prolonged survival in two other G3 PDX lines (p<0.00001 for MB002 and ICb-1572, Figures S6D, E). These studies suggest that combining HDACI and PI3KI might represent an effective therapy for MYC-driven MB.
DISCUSSION
Despite aggressive multimodal therapy, prognosis remains extremely poor for patients with MYC-driven MB (Cho et al., 2011; Northcott et al., 2011). One approach to identifying more effective therapies is high throughput drug screening, which allows evaluation of large numbers of compounds with diverse biological activities. Such screening has been used to identify therapies for other cancers (Atkinson et al., 2011; Gupta et al., 2009), but few screens have been done for MB (Morfouace et al., 2014; Triscott et al., 2013). By using our model of MYC-driven MB, we were able to identify drugs that might be effective for this extremely aggressive disease.
Unlike previous studies, which used MB cell lines or neurospheres that had undergone several passages in culture (Morfouace et al., 2014; Triscott et al., 2013), we assayed cells freshly isolated from tumor-bearing mice. By avoiding culture, which may select for subsets of tumor cells, our screen was designed to identify agents that would be effective against a large proportion of tumor cells. Moreover, by screening cells in serum-free media without growth factors, we hoped to avoid identifying agents that inhibit the effects of these growth factors, which are not necessarily present in the tumor microenvironment. Using these approaches, we found 142 compounds that significantly reduced survival of murine MYC-driven MB cells. The fact that more than one-third of these also potently inhibited survival of G3 PDX cells provides strong validation of these compounds as inhibitors of MYC-driven MB.
The compounds we identified included a number of chemotherapeutic agents that have been previously used for MB, such as etoposide (Ruggiero et al., 2010), camptothecin (Bomgaars et al., 2007) and cytarabine (Mastronuzzi et al., 2013). In addition, our studies pointed to a number of compounds that have not been extensively evaluated for this disease. For example, inhibitors of protein phosphatase 2A (PP2A) were potent inhibitors of MYC-driven MB, consistent with recent studies suggesting that PP2A inhibitors can inhibit the growth of MB cell lines (Cimmino et al., 2012). Likewise, inhibitors of HMG-CoA reductase (statins) emerged as hits in our screen. In light of the role of cholesterol biosynthesis in hedgehog signaling, it has been suggested that statins might be effective against SHH associated MB (Bar and Stearns, 2008). Moreover, a recent report demonstrated that lovastatin can repress MYC expression and function in MB cell lines (Takwi et al., 2012). Further investigation of these agents for treatment of MB is warranted.
For the current studies we focused on HDACI, since several of these agents emerged as potent inhibitors of MYC-driven MB. Our finding that HDACI are effective against mouse and human MYC-driven MB cells is consistent with previous studies showing that these drugs can impede growth of MB cell lines, and can induce cell death in genetically engineered models of SHH-driven MB (Milde et al., 2012; Shu et al., 2006; Spiller et al., 2006). Notably, LBH-589 was more potent than all the other HDACI we tested, including SAHA, one of the few HDACI that has been in clinical trials for MB (Fouladi et al., 2010; Witt et al., 2012). To determine which HDAC isoforms are important for survival of MYC-driven MB cells, we also tested a panel of isoform-selective inhibitors (data not shown). Our studies suggest that inhibitors of class I HDACs (HDAC-1, -2, -3, and -8) are effective against MP tumor cells, although none of these compounds was as potent as LBH-589. In contrast, inhibitors of class II-A (HDAC-4, -5, -7 and -9) and class II-B (HDAC-6) showed minimal activity against MP tumor cells. This conclusion is supported by a recent study demonstrating that class I HDACs (especially HDAC1 and HDAC2) are overexpressed in G3 MB and that inhibitors of these enzymes reduce growth of MB cell lines (Ecker et al., 2015). Thus, class I HDACs are likely to be the predominant mediators of tumor cell survival in our model of MYC-driven MB, and likely represent the key targets of the pan-HDAC inhibitor LBH-589.
Among the pathways most significantly regulated by HDACI was the FOXO pathway. This was initially suggested by expression analysis, which indicated that FOXO target genes were increased in LBH-589-treated tumor cells. Further studies indicated that the levels of FOXO1 mRNA and protein were markedly increased by LBH-589. FOXO1 may contribute to HDACI suppression of tumor growth by interfering with MYC-associated transactivation and transformation (Bouchard et al., 2004; Peck et al., 2013). This interference may involve induction of MXI1-SRα, which can bind to MAX and titrate it away from MYC (Delpuech et al., 2007), or induction of miR-145, a microRNA that can silence MYC expression (Gan et al., 2010). Alternatively, FOXO proteins could act independently of MYC to inhibit tumor growth, by inducing expression of cyclin-dependent kinase inhibitors such as CDKN1A (p21) and CDKN1B (p27) and pro-apoptotic proteins such as BIM, BNIP3, FAS Ligand and TRAIL (Zhang et al., 2011). Our observations that FOXO1 overexpression inhibits tumor growth while FOXO1 knockdown blunts responses to HDACI provide additional support for the importance of this pathway in mediating the inhibitory effects of HDACI. However, it is important to note that HDACI activate multiple pathways in MB cells, and that other proteins besides FOXO1 are likely to contribute to HDACI-mediated growth inhibition.
More than a dozen HDACI are currently in trials for cancer and other diseases. Although these drugs have shown significant effects on their own in the context of cutaneous T-cell lymphoma (Olsen et al., 2007), in most other cancers the benefits of HDACI monotherapy have been limited; thus, efforts have focused on evaluating combinations of HDACI with other drugs (Thurn et al., 2011). Having observed that HDACI function in part by inducing expression of FOXO1, and knowing that FOXO1 nuclear localization can be regulated by PI3K/AKT signaling, we speculated that PI3K inhibitors might cooperate with HDACI in targeting MYC-driven MB. Our studies revealed that BKM-120 potently synergized with LBH-589 to activate FOXO1 and to inhibit tumor growth in vitro and in vivo. Importantly, previous studies have suggested that these drugs can cross the blood-brain barrier (Bendell et al., 2012; Pipalia et al., 2011). These findings suggest that the combination of HDACI and PI3K inhibitors may have utility for patients with MYC-driven MB. In addition, our studies suggest that patients with other subgroups of MB may also benefit from this combination. In future studies it will be important to determine whether combining these agents with radiotherapy or other chemotherapeutic drugs will result in even greater effects on tumor growth.
The fact that MB and other pediatric cancers are relatively uncommon makes clinical trials for these diseases particularly challenging. Since each center sees only a few patients, trials require cooperation among several centers or consortia, and when only a small percentage of patients respond to a given therapy, results are difficult to interpret. Thus, rational selection of therapies and of patients who are likely to respond to them is essential. Our studies suggest that animal models of individual disease subgroups can be extremely valuable tools in this effort. High-throughput screening using these models can identify drugs that are effective for each form of the disease, and preclinical studies using these models can validate the efficacy of these agents and help select priorities for clinical trials. Although no model can predict with certainty which agents will be effective in the clinic, making informed choices about which agents to test can increase the likelihood that patients will benefit from their treatment.
EXPERIMENTAL PROCEDURES
Animals
C57BL/6J mice used as a source of cerebellar stem cells were obtained from the Sanford Burnham Prebys (SBP) Medical Discovery Institute Animal Facility. NOD-SCID IL2R-gamma null (NSG) mice used for intracranial tumor transplantation were purchased from Jackson Labs (Bar Harbor, ME). CD-1 nu/nu mice for flank tumor transplants were from Charles River Labs (Wilmington, MA). Mice were maintained in the animal facilities at SBP and at the Sanford Consortium for Regenerative Medicine. All experiments were performed in accordance with national guidelines and regulations, and with the approval of the animal care and use committees at SBP and at the University of California San Diego (UCSD).
MP Tumor Generation and Tumor Cell Preparation
Cerebellar stem/progenitor cells (Prom1+ cells) were purified by FACS sorting from the cerebella of postnatal day 5–7 (P5–P7) C57BL/6J pups as previously described (Pei et al., 2012). To generate MP tumors, cells were infected with Myc-IRES-Luciferase and DNp53-IRES-GFP retroviruses and stereotaxically injected into the cerebellum of 6–8 week old NSG mice. Animals were monitored weekly with in vivo bioluminescence imaging and euthanized when they showed signs of MB. Tumors were then dissociated and resuspended in NeuroCult medium with proliferation supplement (STEMCELL Technologies) for subsequent experiments. See Supplemental Experimental Procedures for Retroviruses and In vivo Bioluminescence Imaging.
Patient-Derived Xenografts and Normal Cerebellar Controls
Patient-derived xenograft (PDX) lines used for this study include MB002 (G3) generated by the Cho lab (Bandopadhayay et al., 2014); ICb-984 (SHH), ICb-1572 (G3), ICb-1487 (G3) and ICb-1299 (G3), generated by the Li lab (Zhao et al., 2012); Med-1712-FH (SHH), Med-411-FH (G3) and Med-211-FH (G3), generated by the Olson lab (Girard et al., 2015; Morfouace et al., 2014); and RCMB28 (G3), RCMB18 (SHH), RCMB32 (SHH) and DMB006 (G4) generated by the Wechsler-Reya lab (Brun et al., 2014; Kool et al., 2014). PDX lines were generated by implanting patient cells directly into the cerebellum of immune-compromised mice, and propagating them from mouse to mouse without in vitro passaging; the identity and subgroup of each line was validated by gene expression and/or methylation analysis. For all experiments, cells were isolated from tumor-bearing mice, resuspended in NeuroCult with proliferation supplement, and assayed as described below. Normal cerebella (P486 and P487) used as controls for qRT-PCR experiments were kindly provided by Charles Eberhart, Johns Hopkins University.
Inhibitors
Libraries used for high-throughput drug screening are described in Figure 1. Other compounds used include the HDAC inhibitors SAHA, HNHA, LBH-589, Scriptaid, MS-275, Givinostat, PDX101, LAQ-824 and MGCD0103 (all from Selleck), the PP2A inhibitors Cantharidin and Norcantharidin, the topoisomerase inhibitors Camptothecin and Topotecan (all from Sigma), the HMG CoA reductase inhibitors Cerivastatin (Sigma) and Itavastatin (Sequoia Research Products Ltd. UK), and the PI3K/mTOR inhibitors BEZ-235 and BKM-120 (both from Active Biochem). All inhibitors were dissolved in DMSO to 20 mM, and further diluted to an appropriate final concentration in culture medium at the time of use.
High Throughput Drug Screening
For primary screening, 104 MP tumor cells were plated in 25 μl Neurocult with proliferation supplement in 384-well plates (Corning) using an electronic multi-channel pipettor. After 4 hr, 5 nl of compound-containing solution was pin-transferred into the plates. After drug dispensation, an extra 25 μl of Neurocult was added to each well, resulting in a final drug concentration of 1 μM. Each plate included 32 wells of DMSO (negative control) and three wells of 1 μM BEZ-235 (positive control). Viable cell number in each well was determined using the CellTiter-Glo reagent (Promega) and read in an automated Envision plate reader (Perkin-Elmer) after 48 hr incubation. Percent inhibition was calculated using the formula [sample result/mean value of the entire plate × 100].
Treatment of Tumor-bearing Mice
For treatment of intracranial tumor-bearing mice, BKM-120 was dissolved in 0.5% methylcellulose and LBH-589 was dissolved in 0.25% DMSO and 5% dextrose. Pilot experiments demonstrated that the maximum tolerated doses were 30 mg/kg (by oral gavage) for BKM-120 and 5 mg/kg (intraperitoneal) for LBH-589. To assess effects of drugs on tumor growth, 10 days after transplantation, mice were randomly separated into four groups: Vehicle (0.5% methyl-cellulose + 5% dextrose) (n=6); BKM-120 at 30 mg/kg by oral gavage (n=8); LBH-589 at 5 mg/kg by intraperitoneal injection (n=8); and LBH-589 + BKM-120 in the same doses as above. Animals were treated in 4-day cycles (3 days on, 1 day off) until they displayed signs of morbidity or toxicity (>20% weight loss), whereupon they were euthanized. See Supplemental Experimental Procedures for in vivo treatment of mice bearing flank tumors.
Statistical Analyses
Statistical analysis was performed using GraphPad Prism software. All data are presented as mean ± SD unless stated otherwise. Comparisons between different groups were made using Student’s t test or ANOVA as appropriate. The dose-response curves for various compounds were evaluated using Prism software to determine whether these curves were statistically different with respect to the fitted midpoints (Log IC50) using sum-of-squares F test. The statistical significance of Kaplan-Meier survival curves was assessed using the log rank (Mantel-Cox) test. p values of 0.05 or lower were considered statistically significant for all experiments.
Supplementary Material
SIGNIFICANCE.
Medulloblastomas that exhibit amplification or overexpression of the MYC oncogene are associated with the poorest prognosis. By performing high-throughput drug screening on an animal model of MYC-driven MB, we identified HDACI as an important treatment option. HDACI potently kill murine and human MB cells with minimal toxicity to normal cells. Moreover, HDACI synergize with PI3KI to block tumor growth in vitro and in vivo. Discovering effective combination therapies is critical to improve outcomes for children with MYC-driven MB.
HIGHLIGHTS.
High-throughput screening identifies inhibitors of MYC-driven MB
HDACI inhibit growth of murine and human MYC-driven MB cells
HDACI and PI3KI cooperate to activate FOXO1 and suppress tumor growth in vitro
HDACI and PI3KI inhibit growth of MYC-driven tumors in vivo
Acknowledgments
We thank Adriana Charbono and the SBP Animal Facility for assistance with colony maintenance; Amy Cortez and Yoav Altman of the Flow Cytometry Shared Resource and Karl Marquez and Eric O’Connor of the Stem Cell Core at UCSD for help with FACS sorting; and Eduard Sergienko, Fu-Yue Zeng and Thomas Chung of the Conrad Prebys Center for Chemical Genomics for help with assay development and high-throughput screening, and Giovanni Paternostro for help with synergy analysis; Subu Govindarajan of the Analytical Genomics Shared Resource for help with microarray analysis; Feng Qi and Jian-Liang (Jason) Li of the Bioinformatics Shared Resource for help with analysis of microarray data; and Christian Smith for assistance with artwork. This work was supported by NCI grant numbers CA122759 (RWR) and CA159859, by grants from Alex’s Lemonade Stand Foundation (RWR) and CureSearch for Children’s Cancer (RWR and MDT) and by a Leadership Award (LA1-01747) from the California Institute for Regenerative Medicine (RWR).
Abbreviations
- MB
medulloblastoma
- DN
dominant-negative
- MP
Myc/DNp53
- HTS
high-throughput screen
- HDACI
histone acetylation inhibitor
Footnotes
Supplemental information includes 6 Figures and 8 tables.
ACCESSION NUMBER
Gene expression microarray data discussed in this study have been deposited in the NCBI’s Gene Expression Omnibus (GEO; http://www.ncbi.nlm.nih.gov/geo/) with accession number GSE69410. RNA-seq data used in Supplemental Information have been deposited in the European Genome-phenome Archive (https://www.ebi.ac.uk/ega/) with submission number EGAD00001001899.
AUTHOR CONTRIBUTIONS
Y.P., K-W.L., J.W., A.G., R.T., L.A.E., D.L.M., Y.T.U. and N.M. conceived and performed experiments and analyzed data; S.M., H.S.C., S.B., M.K., S.M.P. and M.D.T. performed data analysis; L.Q., M.K., S.S., J.M.O., Y-J.C., X-N.L., J.R.C., M.L.L., S.B., M.K. and S.M.P provided reagents; J.M.O., Y-J.C., X-N.L., M.K., S.M.P., J.R.C. and M.D.T. provided expertise and feedback; Y.P., K-W.L. and R.J.W-R. wrote the manuscript; and R.J.W-R. secured funding for the project.
Publisher's Disclaimer: This is a PDF file of an unedited manuscript that has been accepted for publication. As a service to our customers we are providing this early version of the manuscript. The manuscript will undergo copyediting, typesetting, and review of the resulting proof before it is published in its final citable form. Please note that during the production process errors may be discovered which could affect the content, and all legal disclaimers that apply to the journal pertain.
References
- Atkinson JM, Shelat AA, Carcaboso AM, Kranenburg TA, Arnold LA, Boulos N, Wright K, Johnson RA, Poppleton H, Mohankumar KM, et al. An integrated in vitro and in vivo high-throughput screen identifies treatment leads for ependymoma. Cancer cell. 2011;20:384–399. doi: 10.1016/j.ccr.2011.08.013. [DOI] [PMC free article] [PubMed] [Google Scholar]
- Bandopadhayay P, Bergthold G, Nguyen B, Schubert S, Gholamin S, Tang Y, Bolin S, Schumacher SE, Zeid R, Masoud S, et al. BET bromodomain inhibition of MYC-amplified medulloblastoma. Clinical cancer research : an official journal of the American Association for Cancer Research. 2014;20:912–925. doi: 10.1158/1078-0432.CCR-13-2281. [DOI] [PMC free article] [PubMed] [Google Scholar]
- Bar EE, Stearns D. New developments in medulloblastoma treatment: the potential of a cyclopamine-lovastatin combination. Expert opinion on investigational drugs. 2008;17:185–195. doi: 10.1517/13543784.17.2.185. [DOI] [PubMed] [Google Scholar]
- Bendell JC, Rodon J, Burris HA, de Jonge M, Verweij J, Birle D, Demanse D, De Buck SS, Ru QC, Peters M, et al. Phase I, dose-escalation study of BKM120, an oral pan-Class I PI3K inhibitor, in patients with advanced solid tumors. Journal of clinical oncology : official journal of the American Society of Clinical Oncology. 2012;30:282–290. doi: 10.1200/JCO.2011.36.1360. [DOI] [PubMed] [Google Scholar]
- Bhadury J, Nilsson LM, Muralidharan SV, Green LC, Li Z, Gesner EM, Hansen HC, Keller UB, McLure KG, Nilsson JA. BET and HDAC inhibitors induce similar genes and biological effects and synergize to kill in Myc-induced murine lymphoma. Proceedings of the National Academy of Sciences of the United States of America. 2014;111:E2721–2730. doi: 10.1073/pnas.1406722111. [DOI] [PMC free article] [PubMed] [Google Scholar]
- Bomgaars LR, Bernstein M, Krailo M, Kadota R, Das S, Chen Z, Adamson PC, Blaney SM. Phase II trial of irinotecan in children with refractory solid tumors: a Children’s Oncology Group Study. Journal of clinical oncology : official journal of the American Society of Clinical Oncology. 2007;25:4622–4627. doi: 10.1200/JCO.2007.11.6103. [DOI] [PubMed] [Google Scholar]
- Bouchard C, Marquardt J, Bras A, Medema RH, Eilers M. Myc-induced proliferation and transformation require Akt-mediated phosphorylation of FoxO proteins. The EMBO journal. 2004;23:2830–2840. doi: 10.1038/sj.emboj.7600279. [DOI] [PMC free article] [PubMed] [Google Scholar]
- Brun SN, Markant SL, Esparza LA, Garcia G, Terry D, Huang JM, Pavlyukov MS, Li XN, Grant GA, Crawford JR, et al. Survivin as a therapeutic target in Sonic hedgehog-driven medulloblastoma. Oncogene. 2014 doi: 10.1038/onc.2014.304. [DOI] [PMC free article] [PubMed] [Google Scholar]
- Calnan DR, Brunet A. The FoxO code. Oncogene. 2008;27:2276–2288. doi: 10.1038/onc.2008.21. [DOI] [PubMed] [Google Scholar]
- Cho YJ, Tsherniak A, Tamayo P, Santagata S, Ligon A, Greulich H, Berhoukim R, Amani V, Goumnerova L, Eberhart CG, et al. Integrative genomic analysis of medulloblastoma identifies a molecular subgroup that drives poor clinical outcome. Journal of clinical oncology : official journal of the American Society of Clinical Oncology. 2011;29:1424–1430. doi: 10.1200/JCO.2010.28.5148. [DOI] [PMC free article] [PubMed] [Google Scholar]
- Chou TC. Drug combination studies and their synergy quantification using the Chou-Talalay method. Cancer research. 2010;70:440–446. doi: 10.1158/0008-5472.CAN-09-1947. [DOI] [PubMed] [Google Scholar]
- Cimmino F, Scoppettuolo MN, Carotenuto M, De Antonellis P, Dato VD, De Vita G, Zollo M. Norcantharidin impairs medulloblastoma growth by inhibition of Wnt/beta-catenin signaling. Journal of neuro-oncology. 2012;106:59–70. doi: 10.1007/s11060-011-0645-y. [DOI] [PubMed] [Google Scholar]
- Delpuech O, Griffiths B, East P, Essafi A, Lam EW, Burgering B, Downward J, Schulze A. Induction of Mxi1-SR alpha by FOXO3a contributes to repression of Myc-dependent gene expression. Molecular and cellular biology. 2007;27:4917–4930. doi: 10.1128/MCB.01789-06. [DOI] [PMC free article] [PubMed] [Google Scholar]
- Ecker J, Oehme I, Mazitschek R, Korshunov A, Kool M, Hielscher T, Kiss J, Selt F, Konrad C, Lodrini M, et al. Targeting class I histone deacetylase 2 in MYC amplified group 3 medulloblastoma. Acta neuropathologica communications. 2015;3:22. doi: 10.1186/s40478-015-0201-7. [DOI] [PMC free article] [PubMed] [Google Scholar]
- Fouladi M, Park JR, Stewart CF, Gilbertson RJ, Schaiquevich P, Sun J, Reid JM, Ames MM, Speights R, Ingle AM, et al. Pediatric phase I trial and pharmacokinetic study of vorinostat: a Children’s Oncology Group phase I consortium report. Journal of clinical oncology : official journal of the American Society of Clinical Oncology. 2010;28:3623–3629. doi: 10.1200/JCO.2009.25.9119. [DOI] [PMC free article] [PubMed] [Google Scholar]
- Gan B, Lim C, Chu G, Hua S, Ding Z, Collins M, Hu J, Jiang S, Fletcher-Sananikone E, Zhuang L, et al. FoxOs enforce a progression checkpoint to constrain mTORC1-activated renal tumorigenesis. Cancer cell. 2010;18:472–484. doi: 10.1016/j.ccr.2010.10.019. [DOI] [PMC free article] [PubMed] [Google Scholar]
- Girard E, Ditzler S, Lee D, Richards A, Yagle K, Park J, Eslamy H, Bobilev D, Vrignaud P, Olson J. Efficacy of cabazitaxel in mouse models of pediatric brain tumors. Neuro-oncology. 2015;17:107–115. doi: 10.1093/neuonc/nou163. [DOI] [PMC free article] [PubMed] [Google Scholar]
- Gross DN, van den Heuvel AP, Birnbaum MJ. The role of FoxO in the regulation of metabolism. Oncogene. 2008;27:2320–2336. doi: 10.1038/onc.2008.25. [DOI] [PubMed] [Google Scholar]
- Gupta PB, Onder TT, Jiang G, Tao K, Kuperwasser C, Weinberg RA, Lander ES. Identification of selective inhibitors of cancer stem cells by high-throughput screening. Cell. 2009;138:645–659. doi: 10.1016/j.cell.2009.06.034. [DOI] [PMC free article] [PubMed] [Google Scholar]
- Hwang-Verslues WW, Sladek FM. HNF4alpha--role in drug metabolism and potential drug target? Current opinion in pharmacology. 2010;10:698–705. doi: 10.1016/j.coph.2010.08.010. [DOI] [PMC free article] [PubMed] [Google Scholar]
- Kool M, Jones DT, Jager N, Northcott PA, Pugh TJ, Hovestadt V, Piro RM, Esparza LA, Markant SL, Remke M, et al. Genome sequencing of SHH medulloblastoma predicts genotype-related response to smoothened inhibition. Cancer cell. 2014;25:393–405. doi: 10.1016/j.ccr.2014.02.004. [DOI] [PMC free article] [PubMed] [Google Scholar]
- Mastronuzzi A, Del Bufalo F, Iacono A, Secco DE, Serra A, Colafati GS, MA DEI, Corsetti T. Intrathecal liposomal cytarabine and leptomeningeal medulloblastoma relapse: a valuable therapeutic option. Anticancer research. 2013;33:3515–3518. [PubMed] [Google Scholar]
- Milde T, Lodrini M, Savelyeva L, Korshunov A, Kool M, Brueckner LM, Antunes AS, Oehme I, Pekrun A, Pfister SM, et al. HD-MB03 is a novel Group 3 medulloblastoma model demonstrating sensitivity to histone deacetylase inhibitor treatment. Journal of neuro-oncology. 2012;110:335–348. doi: 10.1007/s11060-012-0978-1. [DOI] [PubMed] [Google Scholar]
- Morfouace M, Shelat A, Jacus M, Freeman BB, 3rd, Turner D, Robinson S, Zindy F, Wang YD, Finkelstein D, Ayrault O, et al. Pemetrexed and gemcitabine as combination therapy for the treatment of Group3 medulloblastoma. Cancer cell. 2014;25:516–529. doi: 10.1016/j.ccr.2014.02.009. [DOI] [PMC free article] [PubMed] [Google Scholar]
- Nakae J, Barr V, Accili D. Differential regulation of gene expression by insulin and IGF-1 receptors correlates with phosphorylation of a single amino acid residue in the forkhead transcription factor FKHR. The EMBO journal. 2000;19:989–996. doi: 10.1093/emboj/19.5.989. [DOI] [PMC free article] [PubMed] [Google Scholar]
- Northcott PA, Jones DT, Kool M, Robinson GW, Gilbertson RJ, Cho YJ, Pomeroy SL, Korshunov A, Lichter P, Taylor MD, Pfister SM. Medulloblastomics: the end of the beginning. Nature reviews Cancer. 2012;12:818–834. doi: 10.1038/nrc3410. [DOI] [PMC free article] [PubMed] [Google Scholar]
- Northcott PA, Korshunov A, Witt H, Hielscher T, Eberhart CG, Mack S, Bouffet E, Clifford SC, Hawkins CE, French P, et al. Medulloblastoma comprises four distinct molecular variants. Journal of clinical oncology : official journal of the American Society of Clinical Oncology. 2011;29:1408–1414. doi: 10.1200/JCO.2009.27.4324. [DOI] [PMC free article] [PubMed] [Google Scholar]
- Olsen EA, Kim YH, Kuzel TM, Pacheco TR, Foss FM, Parker S, Frankel SR, Chen C, Ricker JL, Arduino JM, Duvic M. Phase IIb multicenter trial of vorinostat in patients with persistent, progressive, or treatment refractory cutaneous T-cell lymphoma. Journal of clinical oncology : official journal of the American Society of Clinical Oncology. 2007;25:3109–3115. doi: 10.1200/JCO.2006.10.2434. [DOI] [PubMed] [Google Scholar]
- Packer RJ, Macdonald T, Vezina G, Keating R, Santi M. Medulloblastoma and primitive neuroectodermal tumors. Handbook of clinical neurology. 2012;105:529–548. doi: 10.1016/B978-0-444-53502-3.00007-0. [DOI] [PubMed] [Google Scholar]
- Paik JH, Kollipara R, Chu G, Ji H, Xiao Y, Ding Z, Miao L, Tothova Z, Horner JW, Carrasco DR, et al. FoxOs are lineage-restricted redundant tumor suppressors and regulate endothelial cell homeostasis. Cell. 2007;128:309–323. doi: 10.1016/j.cell.2006.12.029. [DOI] [PMC free article] [PubMed] [Google Scholar]
- Peck B, Ferber EC, Schulze A. Antagonism between FOXO and MYC Regulates Cellular Powerhouse. Frontiers in oncology. 2013;3:96. doi: 10.3389/fonc.2013.00096. [DOI] [PMC free article] [PubMed] [Google Scholar]
- Pei Y, Moore CE, Wang J, Tewari AK, Eroshkin A, Cho YJ, Witt H, Korshunov A, Read TA, Sun JL, et al. An animal model of MYC-driven medulloblastoma. Cancer Cell. 2012;21:155–167. doi: 10.1016/j.ccr.2011.12.021. [DOI] [PMC free article] [PubMed] [Google Scholar]
- Pipalia NH, Cosner CC, Huang A, Chatterjee A, Bourbon P, Farley N, Helquist P, Wiest O, Maxfield FR. Histone deacetylase inhibitor treatment dramatically reduces cholesterol accumulation in Niemann-Pick type C1 mutant human fibroblasts. Proceedings of the National Academy of Sciences of the United States of America. 2011;108:5620–5625. doi: 10.1073/pnas.1014890108. [DOI] [PMC free article] [PubMed] [Google Scholar]
- Qian C, Lai CJ, Bao R, Wang DG, Wang J, Xu GX, Atoyan R, Qu H, Yin L, Samson M, et al. Cancer network disruption by a single molecule inhibitor targeting both histone deacetylase activity and phosphatidylinositol 3-kinase signaling. Clinical cancer research : an official journal of the American Association for Cancer Research. 2012;18:4104–4113. doi: 10.1158/1078-0432.CCR-12-0055. [DOI] [PubMed] [Google Scholar]
- Ruggiero A, Rizzo D, Attina G, Lazzareschi I, Mastrangelo S, Maurizi P, Migliorati R, Bertolini P, Pastore M, Colosimo C, Riccardi R. Phase I study of temozolomide combined with oral etoposide in children with recurrent or progressive medulloblastoma. Eur J Cancer. 2010;46:2943–2949. doi: 10.1016/j.ejca.2010.05.016. [DOI] [PubMed] [Google Scholar]
- Saury JM, Emanuelson I. Cognitive consequences of the treatment of medulloblastoma among children. Pediatric neurology. 2011;44:21–30. doi: 10.1016/j.pediatrneurol.2010.07.004. [DOI] [PubMed] [Google Scholar]
- Shu Q, Antalffy B, Su JM, Adesina A, Ou CN, Pietsch T, Blaney SM, Lau CC, Li XN. Valproic Acid prolongs survival time of severe combined immunodeficient mice bearing intracerebellar orthotopic medulloblastoma xenografts. Clinical cancer research : an official journal of the American Association for Cancer Research. 2006;12:4687–4694. doi: 10.1158/1078-0432.CCR-05-2849. [DOI] [PubMed] [Google Scholar]
- Spiller SE, Ravanpay AC, Hahn AW, Olson JM. Suberoylanilide hydroxamic acid is effective in preclinical studies of medulloblastoma. Journal of neuro-oncology. 2006;79:259–270. doi: 10.1007/s11060-006-9142-0. [DOI] [PubMed] [Google Scholar]
- Takwi AA, Li Y, Becker Buscaglia LE, Zhang J, Choudhury S, Park AK, Liu M, Young KH, Park WY, Martin RC, Li Y. A statin-regulated microRNA represses human c-Myc expression and function. EMBO molecular medicine. 2012;4:896–909. doi: 10.1002/emmm.201101045. [DOI] [PMC free article] [PubMed] [Google Scholar]
- Thurn KT, Thomas S, Moore A, Munster PN. Rational therapeutic combinations with histone deacetylase inhibitors for the treatment of cancer. Future Oncol. 2011;7:263–283. doi: 10.2217/fon.11.2. [DOI] [PMC free article] [PubMed] [Google Scholar]
- Triscott J, Lee C, Foster C, Manoranjan B, Pambid MR, Berns R, Fotovati A, Venugopal C, O’Halloran K, Narendran A, et al. Personalizing the treatment of pediatric medulloblastoma: Polo-like kinase 1 as a molecular target in high-risk children. Cancer research. 2013;73:6734–6744. doi: 10.1158/0008-5472.CAN-12-4331. [DOI] [PubMed] [Google Scholar]
- Wang L, Brugge JS, Janes KA. Intersection of FOXO- and RUNX1-mediated gene expression programs in single breast epithelial cells during morphogenesis and tumor progression. Proceedings of the National Academy of Sciences of the United States of America. 2011;108:E803–812. doi: 10.1073/pnas.1103423108. [DOI] [PMC free article] [PubMed] [Google Scholar]
- Witt O, Milde T, Deubzer HE, Oehme I, Witt R, Kulozik A, Eisenmenger A, Abel U, Karapanagiotou-Schenkel I. Phase I/II intra-patient dose escalation study of vorinostat in children with relapsed solid tumor, lymphoma or leukemia. Klinische Padiatrie. 2012;224:398–403. doi: 10.1055/s-0032-1323692. [DOI] [PubMed] [Google Scholar]
- Zhang X, Tang N, Hadden TJ, Rishi AK. Akt, FoxO and regulation of apoptosis. Biochimica et biophysica acta. 2011;1813:1978–1986. doi: 10.1016/j.bbamcr.2011.03.010. [DOI] [PubMed] [Google Scholar]
- Zhao X, Liu Z, Yu L, Zhang Y, Baxter P, Voicu H, Gurusiddappa S, Luan J, Su JM, Leung HC, Li XN. Global gene expression profiling confirms the molecular fidelity of primary tumor-based orthotopic xenograft mouse models of medulloblastoma. Neuro-oncology. 2012;14:574–583. doi: 10.1093/neuonc/nos061. [DOI] [PMC free article] [PubMed] [Google Scholar]
Associated Data
This section collects any data citations, data availability statements, or supplementary materials included in this article.