

Abstract
Gas embolotherapy is achieved by locally vaporizing microdroplets through acoustic droplet vaporization (ADV), which result in bubbles that are large enough to occlude blood flow directed to tumors. Endothelial cells, lining blood vessels, can be affected by these vaporization events leading to cell injury and cell death. An idealized monolayer of endothelial cells was exposed to ADV using a 3.5 MHz transducer and dodecafluoropentane droplets. Treatments included insonation pressures that varied from 2 to 8 MPa (rarefactional), and pulse lengths that varied from 4 to 16 input cycles. The generated bubble cloud was directly dependent on pressure, but not on pulse length. Cellular damage increased with increasing bubble cloud size, but was limited to the bubble cloud area. These results suggest that vaporization near the endothelium may impact the vessel wall, an effect that could be either deleterious or beneficial depending on the intended overall therapeutic application.
Keywords: gas embolotherapy, acoustic droplet vaporization, endothelial cells, bioeffects
Introduction
Acoustic droplet vaporization (ADV) is capable of transforming superheated microdroplets into bubbles that are up to 150 times larger—in volume—than their original size (Bull 2005; Bull 2007; Kripfgans et al. 2000; Wong and Bull 2011). This dramatic change in size will provide enough volume for occlusion of small blood vessels supplying tumors, having the potential to be applied as a therapy through tissue starvation. This rapid volume change could also lead to significant cell injury due to the generation of high pressures and shear stresses during bubble conversion and expansion inside blood vessels (Kripfgans et al. 2000; Kripfgans et al. 2004; Qamar et al. 2010; Qamar et al. 2012; Ye and Bull 2004; Ye and Bull 2006). Bubble expansion resulting from ADV inside tubes has been previously investigated, but it was not until recently that the effects of the liquid consumption phase were investigated (Qamar et al. 2010; Qamar et al. 2012). Experimental evidence that the droplet interface begins to expand before the phase change is complete was obtained through ultra-high-speed imaging and was the motivation for these new theoretical (Qamar et al. 2010) and computational (Qamar et al. 2012) studies. These studies described the evolution of a droplet undergoing ADV inside a rigid tube, from the liquid consumption phase to bubble expansion. The results showed the existence of a critical droplet size below which the bubble evolution is highly oscillatory, whereas a damped evolution is observed otherwise. Three bubble growth regimes with particularly high pressures in the early stage of bubble evolution were also observed. With these new studies, shear stresses were found to be dependent on the initial droplet size, but were significantly lowered (by five orders of magnitude) when compared to those reported in earlier studies, which considered the phase transition to occur prior to the expansion (Ye and Bull 2004; Ye and Bull 2006). Nonetheless, calculated pressures were still far above those found physiologically. More recently, a few studies focused on the phase transition stage of acoustic droplet vaporization providing a possible explanation in regards to the mechanism (Li et al. 2014; Shpak et al. 2013a; Shpak et al. 2013b; Shpak et al. 2014). These studies provided extensive experimental data along with numerical models that described three distinct regimes present in droplet vaporization (Shpak et al. 2013a) and how the ultrasound wave is distorted and refocused inside the droplet (Li et al. 2014; Shpak et al. 2014). This refocusing event caused by higher harmonics was shown to be responsible for the generation of large local negative pressures. These local pressures (a nearly six-fold increase from incident pressure) inside the droplet would then be able to induce a cavitation-like event (i.e. nucleation site) leading to the phase change and subsequent bubble expansion, but could also be the source of local cell injury.
Droplet concentration, droplet size, relative location inside the blood vessel and also the selection of acoustic parameters could determine the range of bioeffects associated with ADV and consequently their clinical relevance and potential application. The high probability of these events due to droplet concentration in conjunction with high pressures and shear stresses generated during vaporization and bubble expansion could translate to a high risk of affecting the endothelium, for example. As thousands of these microdroplets of various sizes will circulate the bloodstream spanning the entire cross section of a blood vessel it will be possible for vaporization events to occur at or near the vessel wall (Figure 1). The relative size of the ultrasound (US) beam to the diameter of the blood vessel under treatment will likely determine the extent of the damage, making the walls of smaller vessels more susceptible to ADV events. Not only will these events be important as the bubbles expand, but also after they have reached their final size, providing cavitation nuclei (Hilgenfeldt et al. 1998; Khismatullin 2004; Minnaert 1933; Plesset and Prosperetti 1977) capable of inducing a number of bioeffects on tissue. However, if under control these effects could aid in a number of applications that can be synergistic with vessel occlusion, such as cellular permeability and local occlusion through thrombosis.
Figure 1.
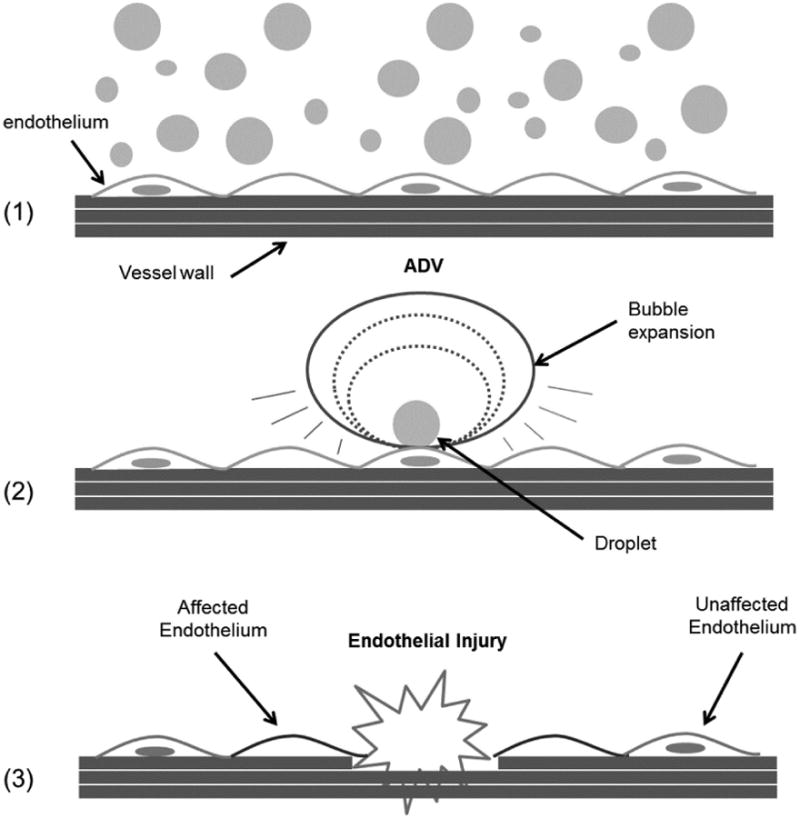
Droplets of various sizes flow inside the blood vessel (1) until an ultrasound beam triggers ADV that may occur near or at the vessel wall (2) impacting endothelial cells and ultimately important vessel functions (3). Note: droplet in (2) is the source of the final bubble pointed by the arrow.
Another important consideration preceding vaporization is the ability of the droplets to extravasate in some regions of the vascular tree into the interstitial space. This of course, will be dependent on their size and the relative permeability of the endothelium across the vasculature. For example, endothelium of large arteries and that of the brain is much less permeable than the endothelium of capillaries and post capillary venules (Ryan 1988). In addition, tumor vasculature is abnormally more permeable than normal vasculature (Jain and Stylianopoulos 2010; Siemann 2011). Particles greater than 3 nm will not able to passively cross endothelial junctions in continuous endothelium; however particles as large as a few micrometers are able to cross the discontinuous walls of tumor vasculature (Jain and Stylianopoulos 2010; Mehta and Malik 2006). This distinctive characteristic of the vascular endothelium along with an appropriate selection of droplet sizes may influence the accumulation of droplets; an outcome that could be beneficial for the local delivery of drug-loaded droplets to tumors.
In this work, ADV events close to an idealized endothelial monolayer are investigated using a 3.5 MHz transducer and a suspension of perfluorocarbon droplets. Other parameters like rarefactional pressure and pulse length are varied, while droplet concentration is held constant. Resulting bubble clouds are recorded to observe localization of the damage, while fluorescence microscopy is used to quantify the bioeffects from a cellular standpoint. With this in vitro study we intend to provide the first insights in bioeffects of ADV on endothelial cells, perhaps corresponding to a worst case scenario, in which the cells are directly in contact with the cell surface in the absence of flow. It is of particular interest to characterize the direct effects of ADV while finding those acoustic parameters that would allow us to perform significant ADV with minimal damage to the endothelium as well as understanding the underlying mechanism of cellular injury.
Materials and Methods
Cell Culture
Primary human umbilical vein endothelial cells (HUVEC) were cultured and supplemented with EGM-2 cell media (Lonza Clonetics™; Walkersville, MD). These cells were incubated at 37°C in a humidified environment and 5% CO2. Cells were grown in culture flasks for one passage and then transferred to OptiCell™ culture chambers (Nalgene Nunc International; Rochester, NY) previously coated with fibronectin (Ca. No. 354008, BD Biosciences; San Diego, CA) prior to US experiments. The cells were grown to ∼90% confluence and only passages one through four were used in these experiments.
Droplets
Albumin-coated droplets with a DDFP core were obtained from the Department of Radiology at the University of Michigan, Ann Arbor. The droplet solution was made following a procedure described elsewhere (Kripfgans et al. 2000). Briefly, droplets were made by combining 750 μL of 4 mg/mL (BSA) bovine serum albumin (Sigma Aldrich, St Louis, MO), dissolved in normal saline (0.9% w/v, Hospira Inc., Lake Forest, IL), and 250 μL of perfluoropentane (C5F12, CAS Number 678-26-2), Strem Chemicals, Inc., Newburyport, MA). While in an ice bath the two phases were emulsified via sonication using a tapered microtip accessory (model 450, 20 kHz, 3.2 mm diameter, Branson Ultrasonics, Danbury, CT) operating at 125 W/cm2 for 30 seconds in continuous mode. Droplets were counted and sized using a Coulter counter (Multisizer III, Beckman Coulter, Inc., Fullerton, CA, USA) with a 50 μm aperture (Figure 2).
Figure 2.
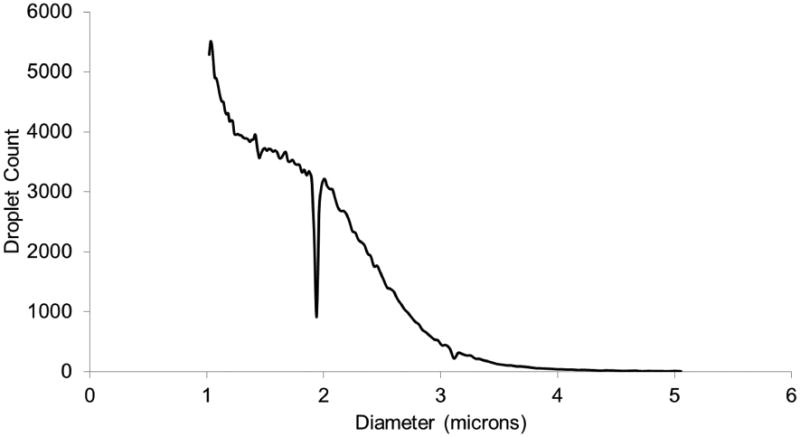
The droplet distribution was obtained using a Coulter counter and plotted as total number of droplets versus diameter (microns). The mean droplet diameter is 1.6 ± 0.5 μm with less than 2% (by number) of the droplets larger than 3 μm.
Ultrasound Setup
A schematic of the setup is provided in Figure 3. All experiments were conducted in a tank containing degassed, deionized water maintained at 37°C. The tank was made from acrylic with a polystyrene window at the bottom that provided a clearer view of the ADV process. Six pegs located around the polystyrene window were used to slide an OptiCell™ chamber and hold it in place. The tank was placed on top of an inverted microscope (Nikon Eclipse TE2000-S, Nikon Instruments, Inc., USA) to observe and record the ADV events and for fluorescence microscopy. A single-element, 3.5-MHz transducer (A381S, 1.9 cm-diameter, 3.81 cm-focal length, Olympus Panametrics-NDT, Waltham, MA) was micropositioned and focused at a 40° angle to the bottom membrane of the OptiCell™ located at the bottom of the tank. The transducer was placed at an angle to minimize standing waves from the bottom of the tank. The transducer was calibrated using an in-house designed fiber-optic probe hydrophone (Parsons et al. 2006) and had a -6dB beamwidth of 1 mm (Figure 4). The US pulses were generated using two function generators. A primary function generator (HP-3314, Hewlett Packard) was used to produce a signal while a secondary function generator (33120A, Agilent Technologies; Palo Alto, CA) was used as a gate. The output signal was then amplified using a power amplifier (-60 dB, GA 2500A, Ritec Inc.; Warwick, RI) whose output was connected to the single-element transducer. All the signals were monitored using an oscilloscope (WaveSurfer 44Mxs, LeCroy; Chestnut Ridge, NY).
Figure 3.
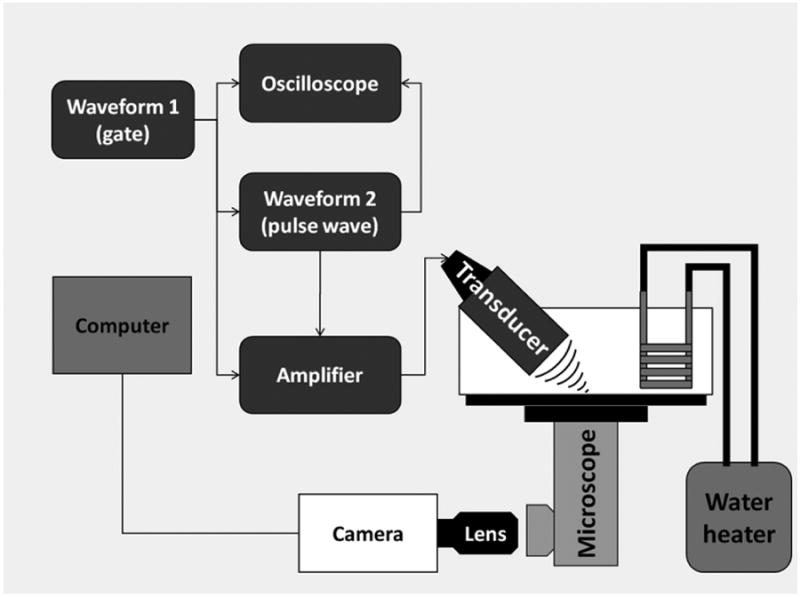
Ultrasound setup. A single element transducer is placed at an angle focused at the bottom of an OptiCell™ culture chamber. ADV events are recorded using a camera attached to an inverted microscope.
Figure 4.
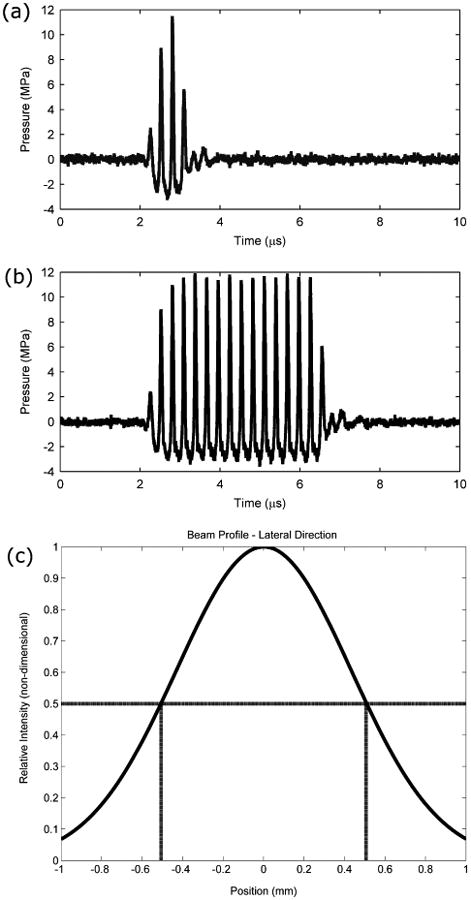
Ultrasound pulse for the 3.5 MHz transducer with a 4 (a) and 16 (b) input cycle. The y-axis shows pressure at the focus of the transducer. Note that the output signal shows one less cycle compared to the input due to ring-up/ring down artifacts. A normalized plot (Gaussian fit) of the ultrasound intensity (pressure) in the lateral direction is shown in (c). Dashed lines correspond to the -6 dB beamwidth.
Exposure Protocol
The cell media was replaced with fresh, warm (37°C) media prior to the experiments. A volume of 100 μL of a solution containing 108 droplets per mL was added to the 10-mL cell culture chamber to produce a final concentration of 106 droplets per mL. This concentration yielded an approximate 10:1 droplet to cell ratio. For in vitro purposes, smaller ratios may not be able to produce quantifiable results, while much larger ratios may not be clinically relevant. A similar ratio was used in a previous study of gene delivery to cells using microbubbles (Rahim et al. 2006). The OptiCell™ was gently tilted side to side to evenly distribute the droplets over the cell monolayer. The OptiCell™ was then submerged inside the tank and left for 2 minutes to equilibrate and for the droplets to settle to the bottom of the chamber. An OptiCell™ chamber was divided into a grid that consisted of 13 rows and 9 columns. Each grid cell within the grid was roughly 0.5 cm × 0.5 cm containing the -6 dB beamdwidth for uniform treatment. The entire grid accounted for 13 different experimental groups and at most, 9 different replicates. These 13 experimental groups contained all combinations of pressure and pulse length including a treatment with 0 MPa to observe the effects of droplets alone. A second OptiCell™ chamber was used and divided in the same way to perform a control experiment that included the same treatments, but without droplets. Both OptiCells™ were seeded using the same cell density and kept until they reached ∼90% confluence. Each grid cell in the culture chamber was exposed to only one pressure and pulse length combination. All treatments were randomly selected inside the chamber to minimize uncontrollable sources of error like local differences in cell density. Comparisons between the control and experimental groups were used to identify the effects caused by ADV including those caused by either US alone or droplets alone. A motorized stage (Proscan II, Prior Scientific; Rockland, MA) mounted onto the inverted microscope was used to move the tank along with the OptiCell™ to the specific area for treatment. The transducer was moved away from previously formed bubble clouds to avoid any “shadowing” effects. PNPs ranged from 0 to 8 MPa in increments of 2 MPa, while pulse length was varied as 4, 8 or 16 input cycles.
It has been shown that ADV is a threshold phenomenon (Kripfgans et al. 2000). This threshold was optically obtained by observing consistent vaporization as the acoustic pressure and pulse length were increased. DDFP droplets have minimal acoustic scattering compared to gas bubbles so treatments below the threshold along with that at 0 MPa served to investigate the effect of droplets alone. Input cycles correspond to the initial number input into the system and was used as a nominal value. However, due to ring-up/ring-down characteristics of the transducer, the actual number of cycles was 3, 7 and 15 (Figure 4 (a) and (b)), which corresponded to pulse durations of 0.86 μs, 2 μs and 4.29 μs, respectively. The upper limit of the pressure range selected corresponded to the saturation pressure of the transducer, while the cycles corresponded to a range that has been previously used in our lab for in vivo experiments (Samuel et al. 2012). The bubble clouds from ADV were recorded using a camera (CoolSNAP ES, Roper Scientific Photometrics; Tucson, AZ) mounted into the inverted microscope and MetaMorph Premier (Molecular Devices, Sunnyvale, CA). Upon completion of the treatments, the chambers were immediately taken out of the tank for fluorescence staining.
Fluorescence Microscopy
The cell media was carefully withdrawn from the culture chambers using a 10 mL syringe. The cell culture was rinsed 2× with phosphate buffered saline (PBS) containing 2% bovine serum albumin to remove any excess droplet solution. One mL of a solution containing nucleic acid stain Hoechst 33342 (Ca. No. H3570, Molecular Probes®, Life Technologies™, Carlsbad, CA) and ethidium homodimer-1 (EthD-1, Ca. No. L-3224 (component B) Molecular Probes®, Life Technologies™, Carlsbad, CA) was added to the culture chamber and supplemented with 9 mL of culture media to yield a final concentration of 3 μM for both dyes. OptiCells™ were incubated for 30 minutes at 37°C in the dark. Following incubation the staining solution was withdrawn; the OptiCells™ were rinsed with PBS and fixed in 4% paraformaldehyde for 15 minutes at room temperature. After fixation, the OptiCells™ were rinsed 2× and stored in HEPES with sodium azide at 8°C. This procedure was carried out for both the control and experimental culture chambers.
Each area exposed to ADV was examined using a 4× magnification objective (Plan Fluor, Nikon; Melville, MA). A fluorescence image consisting of a Hoechst stained (total cell count) frame and an EthD-1 stained (dead cell count) frame was obtained for each area and recorded using MetaMorph Premier (Molecular Devices, Sunnyvale, CA). In a different experiment a 2 μM solution of calcein AM (Ca. No. L-3224 (component A) Molecular Probes®, Life Technologies™, Carlsbad, CA) was used to stain the cytoplasm of the cells.
Image Processing
The collected images were post processed using Adobe Photoshop CS5.1 (Adobe Systems Inc., San Jose, CA) to create overlays using the frames previously obtained. Bubble cloud and damage area images acquired during a preliminary study (calcein stained) were overlaid for qualitative purposes. Once images were acquired, an edge detection tool was used to select the bubble cloud from the brightfield image; this selection was cropped and then manually added as a second layer onto the fluorescence image until the edges of both the damage area and the bubble cloud were matched. Fluorescence images used for quantifying number of cells (Hoechst and EthD-1 stained) were obtained at the same coordinates using an automated stage and overlaid as layers. Individual frames of cells were transferred to ImageJ (U. S. National Institutes of Health, Bethesda, Maryland) for image processing that included binary conversion and particle count using the “Analyze Particles” tool to count cell nuclei.
Statistics
Each treatment consisted of between 6 and 9 replicates. R (The R Project for Statistical Computing) and Minitab 16 (Minitab Inc., State College, PA) were used to carry out the statistical analysis. Statistical significance of effects was assessed by performing a general regression analysis as well as a Dunnet's test to compare individual experimental groups to our control. P-values below 0.05 were considered statistically significant throughout the experiments.
Results
Bubble cloud and localized damage
Once above threshold, the size of the bubble cloud generated by ADV increased with pressure (Figure 5), but was not affected by the pulse length. The results are summarized in Figure 6, where the bubble cloud area (BCA) was plotted against peak-negative pressure (PNP) for the three different pulse lengths. Preliminary experiments showed damaged areas as stained with fluorescent dye calcein and EthD-1 after ADV was performed. These areas were inspected and overlaid using the corresponding bubble clouds to evaluate the localization of the damage. Qualitative observations of these images showed that the impact of ADV was highly localized as damage zones corresponded to an area that was almost equal in size to that of the bubble cloud (Figure 7). In addition, viable cells were observed inside the vaporization area.
Figure 5.
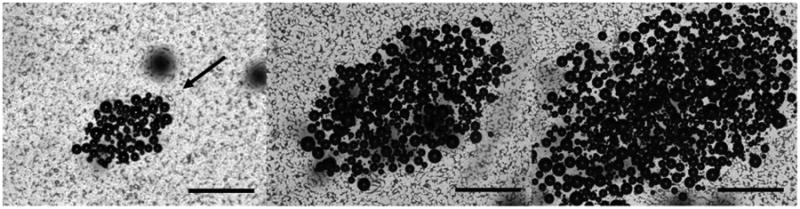
Bubble clouds as generated during ADV at (from left to right) 4 MPa, 6 MPa and 8 MPa and 4 cycles. The US beam travels from NE to SW (arrow). The scale bar is 500 μm.
Figure 6.
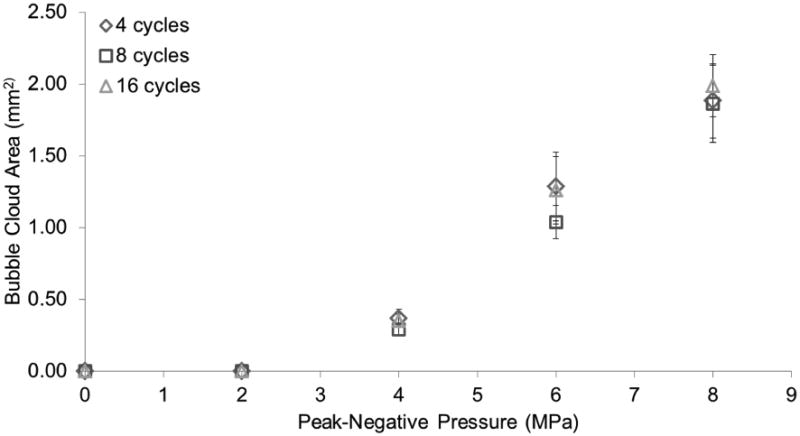
Bubble cloud area versus peak-negative pressure (MPa). Vaporization (ADV) threshold is at 4 MPa, 4 cycles. Error bars correspond to one standard deviation (n=8). Significant differences found across pressures (p<0.05), but not across cycles (p>0.05).
Figure 7.
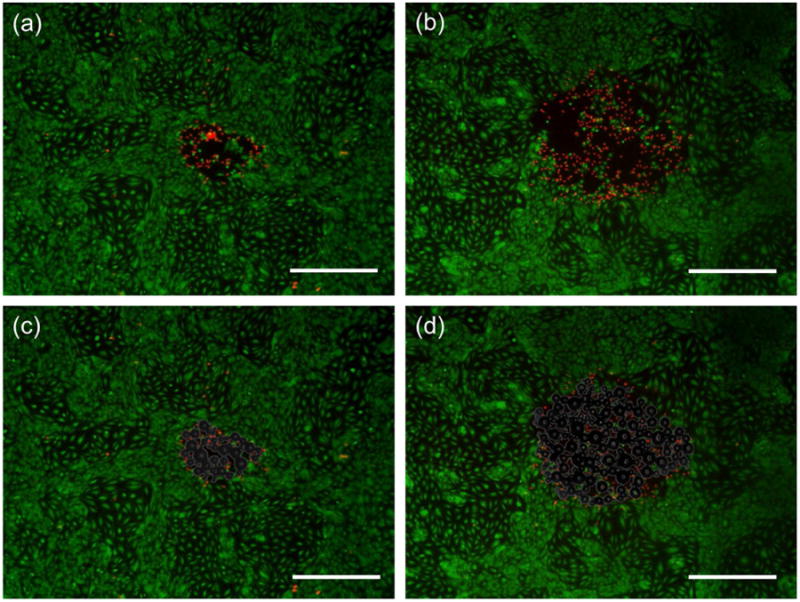
Endothelial cells stained with fluorescent dye calcein (green. live cells) and EthD-1 (red, dead cells) after ADV at 3.5 MPa (a) and 4.5 MPa (b). By creating an overlay of the images containing the bubble clouds (c and d) generated during ADV we can see that the damage zones are practically the size of said bubble cloud. Note that a few cells inside this damage zones have survived ADV. The scale is 500 μm.
Cell attachment
To quantify the number of endothelial cells (EC) in each grid cell a region of interest (ROI) equal to 1.7 mm by 2.2 mm (actual image size) was used. This area corresponded to an area greater than the maximum BCA achieved (∼2 mm2). Cellular damage was no greater than this area so an underestimation of statistics was not expected. Choosing a larger area may increase the signal-to-noise ratio for images with lesser degree of damage (smaller BCAs), but it would at the same time underestimate that of the images with greater damage. The total number of cells from each ROI in the control group as well as those treated with pressures below threshold was used to determine differences in cell density within and between culture chambers. This number not only helped determine initial cell density for both chambers, but also the number of cells that were killed and sheared-off during ADV and as a consequence, washed away from the chamber during rinsing steps. Notice that in Figure 8 that although Hoechst stains all cells (blue stain); there are areas where cells have been detached from the chamber floor. The total number of cells between treatments in the control group, which included all treatments without droplets, was not significantly different. Forty-five randomly selected grid cells, which corresponded to those treatments below threshold in the experimental group, were used to account for its initial cell density. These were not significantly different when compared to our control chamber. This result showed that the same order of cell density was found in both chambers prior to the experiments. This cell density or total cell count was used to obtain a cell fraction defined as the ratio of the (total) cell count in each experimental case and the total cell count in our control (0 MPa, no droplets). These results were plotted against each treatment.
Figure 8.
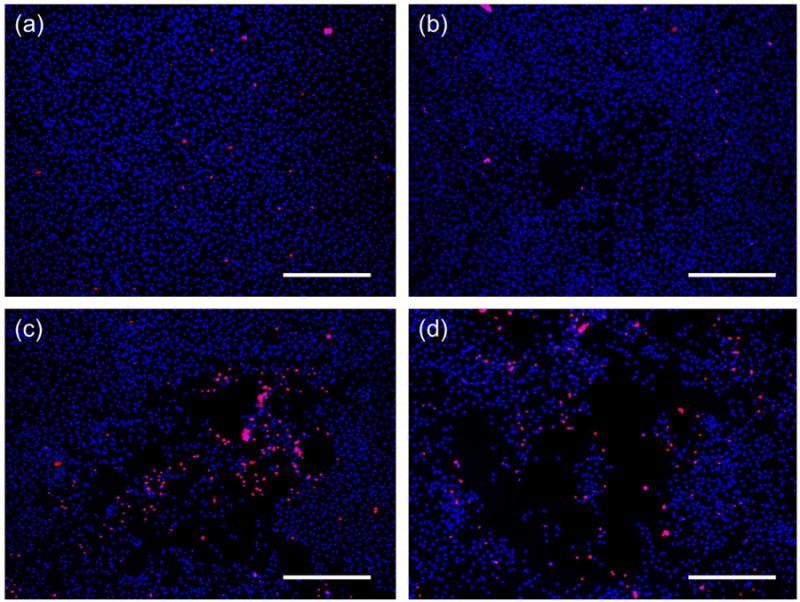
Representative images depicting cell damage after ADV compared to a control (a). Cell death (red stain) as well as sheared off cells (empty spaces in the center) increase with pressure: 4MPa (b), 6 MPa (c) and 8 MPa (d). The ultrasound pulse consisted of 8 cycles. Cells were stained with nuclei acids Hoechst (all cells) and EthD-1 (dead cells). The scale bar is 500 μm.
According to the statistical analysis, pressure was a significant factor, but pulse length was not. However, a two-way interaction effect was also found significant. Major and significant differences were found when the pressure-pulse length combination was greater or equal to 6 MPa and 4 cycles (Figure 9). These pressures were responsible for the creation of larger bubble clouds and as a consequence, larger damage areas. Significant differences in the total number of cells when compared to our control (1.00) ranged from an average of 0.20 to 0.47 cell fraction reduction when the pressure-pulse length combination was increased from 6 MPa and 4 cycles to 8 MPa and 8 cycles, respectively. For those areas treated with 4 MPa and pressures below threshold there were no significant differences when compared to the control group.
Figure 9.
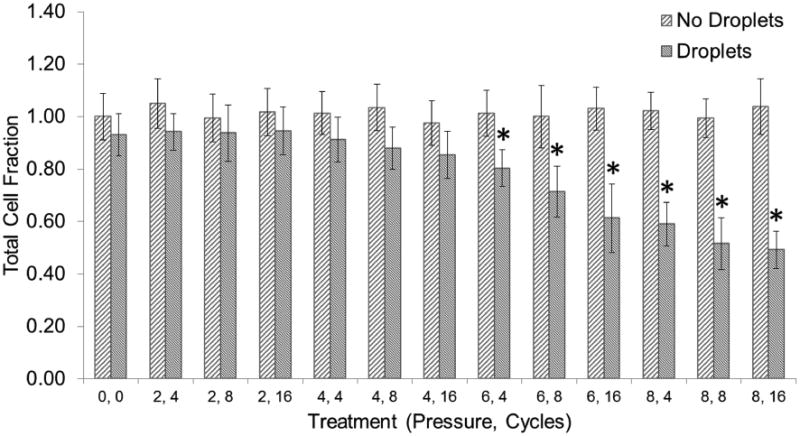
The total cell fraction corresponds to the total number of cells in each treatment divided by the total number of cells in our control (0 MPa, 0 cycles, no droplets). Each treatment is described by a peak-negative pressure (MPa) and a number of cycles. Vaporization (ADV) threshold is at 4 MPa, 4 cycles. Asterisks (*) denote treatments that are significantly different from the control (p<0.05). Error bars correspond to one standard deviation (n=8).
Cell Death
The number of dead cells was also obtained for both the control and experimental groups. No significant differences were found across treatments in the control group. Cell death was approximately 1% of the total cell count. In the experimental group pressure was found to be a significant factor, whereas cycles were not. However, an interaction effect was found to be significant as well. Cell death was no higher than 5% of the total cell count in the experimental group, but was found to be significantly different when compared to the control group at a pressure-pulse length combination of 6 MPa and 8 cycles or higher (Figure 10).
Figure 10.
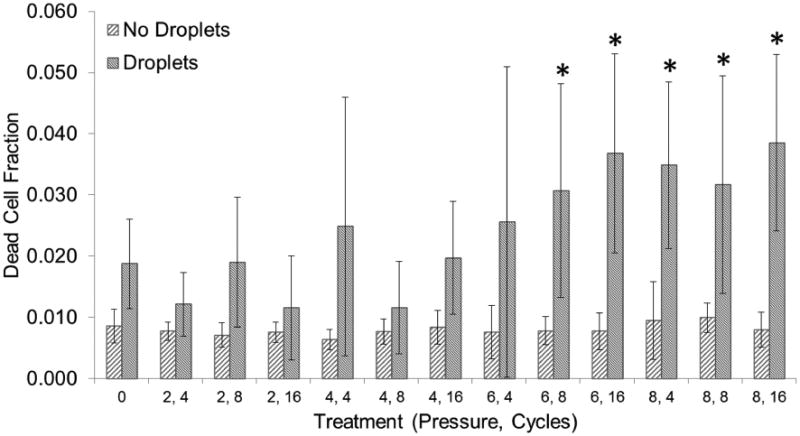
The dead cell fraction corresponds to the total number of dead cells in each treatment divided by the total number of cells in our control (0 MPa, 0 cycles, no droplets). Each treatment is described by a peak-negative pressure (MPa) and a number of cycles. Vaporization (ADV) threshold is at 4 MPa. Asterisks (*) denote treatments that are significantly different from the control (p<0.05). Error bars correspond to one standard deviation (n=8).
Additional Experiments
Another experiment was carried out following the procedure aforementioned using pressure as the only dependent variable in increments of 1 MPa. Pulse length was not a significant factor in the first experiment and as such was kept constant at 8 cycles. Cell attachment and viability was not significantly affected in the control group as observed in the first experiment. A pressure greater or equal to 6 MPa was found to be significant for the experimental group (Figure 11). These results were consistent with the previous experiment as the same level of TCF was observed. Cell death was still kept at near 1% of the total cell count for the control group and near 5% for the experimental group (Figure 12). However, cell death was significantly different between the control and experimental group for all treatments. A third data set was used to compare interplate variability and hence the reproducibility of this experiment. This is consistent with other studies in which triplicates of experiments with OptiCells were used (Phillips et al. 2011; Rahim et al. 2006). TCF results from three experiments were plotted (Figure 13) and were not found to be significantly different (p > 0.05). DCF results however, were significantly different (p < 0.05).
Figure 11.
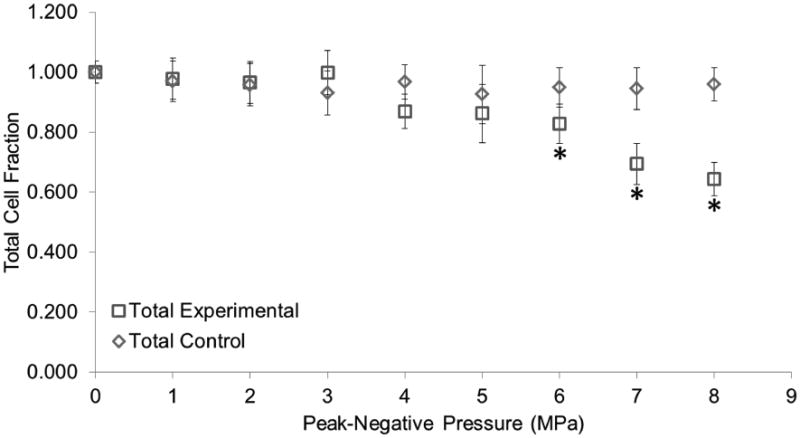
Total cell fraction as a function of peak negative pressure. The total cell fraction corresponds to the total number of cells in each treatment divided by the total number of cells in our control (0 MPa, no droplets). Vaporization (ADV) threshold is at 4 MPa. Asterisks (*) denote treatments that are significantly different from the control (p<0.05). Error bars correspond to one standard deviation (n=8).
Figure 12.
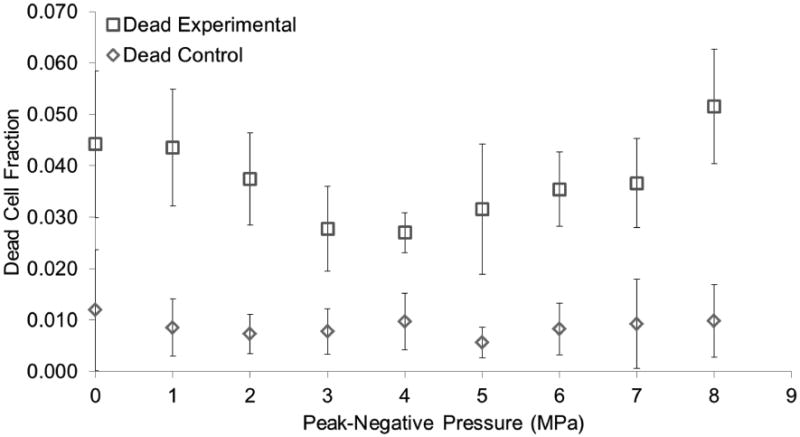
Dead cell fraction as a function of peak negative pressure. The dead cell fraction corresponds to the total number of dead cells in each treatment divided by the total number of cells in our control. Vaporization (ADV) threshold is at 4 MPa. Significant differences (p<0.05) from our control were found for all treatments. Error bars correspond to one standard deviation (n=8).
Figure 13.
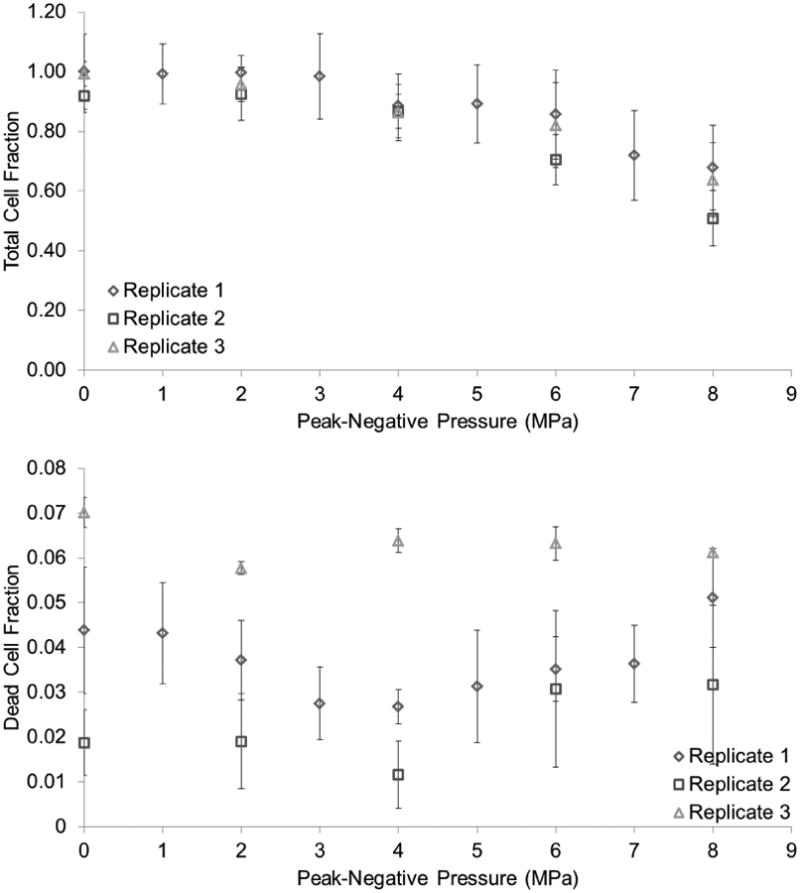
Replicates from three independent experiments showed that TCF was not significantly different (p > 0.05) across OptiCells™; however DCF was found to be significant (p < 0.05). Data was normalized using their corresponding control.
Discussion
The present study shows the effects of ADV on an EC monolayer. To the best of our knowledge this is the first study that shows the ADV-endothelial interaction under acoustic conditions relevant to gas embolotherapy. The main findings of this work are the dependency of BCA and cell detachment to PNP at a given frequency and droplet concentration. Both BCA and cell detachment increase with an increase in PNP. The increase in BCA can be explained by the Gaussian-shaped spatial distribution of pressure of the US beam. As the pressure is increased beyond threshold a larger fraction of the maximum or saturation area will appear allowing more droplets to be enclosed by it. This increase in BCA could explain the increase in cell detachment as more droplets were enclosed (and vaporized) under the beam area as the pressure was increased. For three independent experiments, the same level of TCF was found, ruling out effects on cell attachment due to differences in cell populations. Interestingly, cell death did not behave as such. Cell death was found to be significant only above a certain pressure-pulse length combination for one experiment. This might indicate that a threshold phenomenon may be responsible for this effect. However, a second and third experiment did not support this hypothesis as cell death was significantly different across all treatments containing droplets when compared to the control group. This discrepancy was expected as those cells that were both dead and detached could not be accounted for after rinsing steps during fluorescence had taken place.
Another important finding of this work is the lack of an effect due to pulse length for bubble cloud formation. However, in theory, one effective cycle above threshold should be sufficient to trigger vaporization, while subsequent cycles of the pulse would be responsible for driving the previously formed bubbles. Hence, the lack of dependency on this parameter was no surprise. Other studies (Fabiilli et al. 2009; Lo et al. 2007) have shown similar trends in which pulse length had no effect on the ADV threshold, especially for pulse lengths under 1000 μs. However, these studies did not address the size of the bubble cloud. If bubbles were formed with one cycle, then cell damage may be affected by pulse length as cells will be exposed to other mechanical events aside ADV, as for example, bubble oscillations or even inertial cavitation. Interestingly, cell damage (detachment and death) was not affected by pulse length. An explanation for these results may be that cell injury happens during the first cycle(s) of the US pulse when the bubbles are initially created. This event may be so violent that cells are sheared off (and potentially killed) almost immediately from the insonated area and as a result, subsequent bubble oscillations will take place in a previously depleted area and thus will have no effect.
A two-way interaction effect was found to be significant between pulse lengths and PNP. The relevance of this interaction effect falls under the definition non-additive effects. In other words, a change in one variable does not yield a proportional (additive) effect in the response when a second variable is kept constant, but rather it may subdue or amplify such effects. For example, pulse length was doubled each time, but the total number of dead or detached cells did not respond proportionally. Notion of this interaction effect may confirm that it is in fact a portion of the US pulse responsible for the observed effects as damage did not respond proportionally to an increase in the pulse length. In other words, the first few cycles of the US pulse (and not the whole pulse) were responsible for most (if not all) of the damage. However, we do not discard the possibility of damage associated with extra cycles if cells do remain attached.
No depletion or significant cell death was observed in any of the controls indicating that it is indeed, an US-droplet and/or US-bubble interaction, the cause of these bioeffects. Generation of high pressures and shear stresses during phase transition and bubble expansion may have been responsible for injuring, killing or even weakening the anchor created between the cells and the fibronectin coating the culture chamber. Values of pressures and shear stresses have been previously reported in computational studies (Qamar et al. 2010; Qamar et al. 2012; Shpak et al. 2014; Ye and Bull 2004; Ye and Bull 2006) and have considerably exceeded those encountered physiologically. Cell detachment was also reported in an earlier study (Fabiilli et al. 2010) in which Chinese hamster ovarian cells were exposed to ADV for the delivery of a chemotherapy agent using dual phase microdroplets. Cell detachment was also thought to be caused by high fluid velocities (shear) generated by the rapid phase transition and bubble expansion processes or inertial cavitation during ADV.
The area depleted of cells was optically compared to the BCA generated during ADV by overlaying both images. It was observed that the affected area was less than or equal to the BCA. This matching of areas is another important finding of this work because it demonstrates that the cell damage is limited by the size of the bubble cloud as it is observed by the absence of detached or dead cells beyond the BCA emphasizing localization of damage. This result hints yet another explanation of the mechanism of cell injury in which the droplet's albumin shell may play an important role. The EC surface contains a number of albumin-binding proteins that have been described previously and are believed to induce endocytosis (Ghinea et al. 1989; Siddiqui et al. 2004; Vogel et al. 2001). Hence, it is plausible to state that the albumin shell covering the surface of the droplets may have stimulated an endocytosis pathway leading to attachment or partial transport of some droplets inside the ECs putting these at risk of direct ADV events capable of affecting vital organelles and the cell membrane.
Cell death was evaluated by the uptake of EthD-1, a cell-impermeant nucleic acid stain that produces a bright red fluorescence on damaged or dead cells. Cell death is a naturally occurring phenomenon mediated either by a necrotic or apoptotic pathway, so the presence of dead cells in our controls was expected. Therefore, a normalized dead cell count was used to estimate the percentage of cells affected by ADV. This was achieved by obtaining the ratio of the number of dead cells for each experimental case over that of our control. In one experiment, dead cell fractions were found to be significantly different from our control when the pressure-pulse length combination was 6 MPa and 8 cycles or higher, but kept below 5%. However, on a second and third experiment cell death was found to be significantly different from our control, for which it was maintained at 1 %. Although the experimental groups exhibited a significant increase in cell death it was still maintained at less than 10%. We believe that a phenomenon described here as a rolling “sticky ball” may have been partially responsible for this increase in cell death. This mechanism may involve droplets (sticky balls) rolling down the cell monolayer (mainly during the removal of these from the culture chamber), constantly attaching and detaching from the ECs and possibly breaking off the cell membrane.
Error in the measurement of the dead cell count, quantified as one standard deviation from our mean for each case was rather high for all treatments containing droplets. This observation led us to comment on another event capable of causing an increase in cell death. As mentioned earlier, ADV and IC are both threshold phenomena, but it was shown in an earlier study that IC is also a probabilistic event (Fabiilli et al. 2009). Thus, cell injury during ADV may be probabilistic as well. Therefore small error bars should be found at pressures where IC is very unlikely or very likely to happen (low and high pressures respectively). Conversely, higher error should be present at mid-range pressures where IC is equally bound to occur or not. Unfortunately, our data showed no evidence of this, as there was high error for all treatments.
In the vasculature, ECs sense shear stresses and other mechanical stimuli and through mechanotransduction can change their morphology and alter important intra or intercellular signaling cascades to meet metabolic needs (Sumpio et al. 2002). Some examples of altered endothelial functions include the upregulation of growth factors, cytoskeletal reorganization and increased permeability. However, if these stresses are increased (or decreased) beyond physiological conditions EC functions could be impaired resulting in endothelial dysfunction or cell death (Park et al. 2011). From a physiological perspective, impairment of endothelial functions could be of great concern and even pathological if they are not identified promptly and controlled (Sumpio et al. 2002). Risks of thrombus formation, fat accumulation, and atherosclerosis are major consequences of endothelial dysfunction to name a few. However, it is pertinent to point out that loss of normal endothelial functions will not necessarily translate to undesired effects. As a cancer treatment, gas embolotherapy could potentially benefit from some of these effects providing yet additional mechanisms to aid in the eradication of the cancerous tissue, which is the ultimate goal of any cancer therapy. Damage to the endothelium could induce thrombosis at the site of vaporization providing additional occlusion to those affected vessels without further vaporization. Controlled impairment of endothelial functions like permeability could also aid in the delivery of drugs or other substances. Several studies (Juffermans et al. 2009; Meijering et al. 2007; Mukherjee et al. 2000) have confirmed this by showing an increase in the uptake of different molecular species when ECs were exposed to US in the presence of contrast agents. More importantly, ADV was also proved to provide similar effects in cell permeability (Fabiilli et al. 2010). In other words, if controlled, not only will ADV provide an embolus to a specific location in the vasculature, but could also provide a mechanism for local drug delivery following occlusion given that cell viability can be sustained.
It is imperative to emphasize to the reader that the aforementioned results were obtained in a controlled in vitro experiment and that in vivo situations are difficult to mimic. An idealized monolayer of ECs supported by fibronectin was used when in actuality the endothelium is supported by an extracellular matrix composed of a mesh of different molecular components with different mechanical properties. HUVECs are commonly used cells in this field; however it is worth mentioning that the cellular response from ECs may vary depending on their origin as well as their initial pathological state in the vascular tree (Kumar et al. 1987). In addition, these experiments only accounted for damage to the endothelium when ADV happened directly over a cell monolayer and probably represent a worst case scenario that may occur during treatment. However, effects of vaporization proximity to the monolayer are still unknown, but a work in progress. Longer pulses or the inclusion of pulse repetition frequency (PRF) may be needed in clinical practice to increase the number of vaporized droplets in the vasculature and increase the probability of occlusion. Other parameters like droplet to cell ratio and droplet size are believed to affect the degree of damage and should also be studied.
Conclusion
Direct bioeffects of ADV on ECs have been investigated in vitro using a 3.5 MHz transducer. This is perhaps, the first insight into ADV-endothelial interactions using a monolayer of ECs, DDFP microdroplets and focused US. It was found that BCA and cell attachment were affected when the insonation pressure was increased above threshold in a dose dependent manner. Significant damages were observed if pressures are near or above 6 MPa. Pulse length had no effect, however an interaction between pulse length and PNP was significant. Cell death may not be a reliable metric of bioeffects for this study since dead cells that had been detached could not be accounted for. Although the mechanism of damage is not well understood, it was observed that said damage was highly localized. Damage to the endothelium could induce thrombosis at the site of vaporization providing additional occlusion to those affected vessels. Controlled impairment of endothelial functions like permeability could also aid in the delivery of drugs or other substances that will need to cross the endothelial barrier during treatments. These results may suggest that with appropriate selection of acoustic parameters and blood vessels, damage can be controlled and used to further expand gas embolohterapy and its applications.
Acknowledgments
This work has been supported by NIH grant R01EB006476.
Footnotes
Publisher's Disclaimer: This is a PDF file of an unedited manuscript that has been accepted for publication. As a service to our customers we are providing this early version of the manuscript. The manuscript will undergo copyediting, typesetting, and review of the resulting proof before it is published in its final citable form. Please note that during the production process errors may be discovered which could affect the content, and all legal disclaimers that apply to the journal pertain.
References
- Bull JL. Cardiovascular bubble dynamics. Crit Rev Biomed Eng. 2005;33:299–346. doi: 10.1615/critrevbiomedeng.v33.i4.10. [DOI] [PubMed] [Google Scholar]
- Bull JL. The application of microbubbles for targeted drug delivery. Expert Opin Drug Deliv. 2007;4:475–493. doi: 10.1517/17425247.4.5.475. [DOI] [PubMed] [Google Scholar]
- Fabiilli ML, Haworth KJ, Fakhri NH, Kripfgans OD, Carson PL, Fowlkes JB. The role of inertial cavitation in acoustic droplet vaporization. IEEE Trans Ultrason Ferroelectr Freq Control. 2009;56:1006–17. doi: 10.1109/TUFFC.2009.1132. [DOI] [PMC free article] [PubMed] [Google Scholar]
- Fabiilli ML, Haworth KJ, Sebastian IE, Kripfgans OD, Carson PL, Fowlkes JB. Delivery of chlorambucil using an acoustically-triggered perfluoropentane emulsion. Ultrasound Med Biol. 2010;36:1364–75. doi: 10.1016/j.ultrasmedbio.2010.04.019. [DOI] [PMC free article] [PubMed] [Google Scholar]
- Ghinea N, Eskenasy M, Simionescu M, Simionescu N. Endothelial albumin binding proteins are membrane-associated components exposed on the cell surface. J Biol Chem. 1989;264:4755–8. [PubMed] [Google Scholar]
- Hilgenfeldt S, Lohse D, Zomack M. Response of bubbles to diagnostic ultrasound: a unifying theoretical approach. Eur Phys J B. 1998;4:247–255. [Google Scholar]
- Jain RK, Stylianopoulos T. Delivering nanomedicine to solid tumors. Nat Rev Clin Oncol Nature Publishing Group. 2010;7:653–664. doi: 10.1038/nrclinonc.2010.139. [DOI] [PMC free article] [PubMed] [Google Scholar]
- Juffermans LJM, van Dijk A, Jongenelen CAM, Drukarch B, Reijerkerk A, de Vries HE, Kamp O, Musters RJP. Ultrasound and microbubble-induced intra- and intercellular bioeffects in primary endothelial cells. Ultrasound Med Biol. 2009;35:1917–27. doi: 10.1016/j.ultrasmedbio.2009.06.1091. [DOI] [PubMed] [Google Scholar]
- Khismatullin DB. Resonance frequency of microbubbles: effect of viscosity. J Acoust Soc Am. 2004;116:1463–73. doi: 10.1121/1.1778835. [DOI] [PubMed] [Google Scholar]
- Kripfgans OD, Fabiilli ML, Carson PL, Fowlkes JB. On the acoustic vaporization of micrometer-sized droplets. J Acoust Soc Am. 2004;116:272–81. doi: 10.1121/1.1755236. [DOI] [PubMed] [Google Scholar]
- Kripfgans OD, Fowlkes JB, Miller DL, Eldevik OP, Carson PL. Acoustic droplet vaporization for therapeutic and diagnostic applications. Ultrasound Med Biol. 2000;26:1177–1189. doi: 10.1016/s0301-5629(00)00262-3. [DOI] [PubMed] [Google Scholar]
- Kumar S, West DC, Ager A. Heterogeneity in endothelial cells from large vessels and microvessels. Differentiation. 1987;36:57–70. doi: 10.1111/j.1432-0436.1987.tb00181.x. [DOI] [PubMed] [Google Scholar]
- Li DS, Kripfgans OD, Fabiilli ML, Brian Fowlkes J, Bull JL. Initial nucleation site formation due to acoustic droplet vaporization. Appl Phys Lett. 2014;104:063703. doi: 10.1063/1.4864110. [DOI] [PMC free article] [PubMed] [Google Scholar]
- Lo AH, Kripfgans OD, Carson PL, Rothman ED, Fowlkes JB. Acoustic droplet vaporization threshold: effects of pulse duration and contrast agent. IEEE Trans Ultrason Ferroelectr Freq Control. 2007;54:933–46. doi: 10.1109/tuffc.2007.339. [DOI] [PubMed] [Google Scholar]
- Mehta D, Malik AB. Signaling mechanisms regulating endothelial permeability. Physiol Rev. 2006;86:279–367. doi: 10.1152/physrev.00012.2005. [DOI] [PubMed] [Google Scholar]
- Meijering BDM, Henning RH, Van Gilst WH, Gavrilovic I, Van Wamel A, Deelman LE. Optimization of ultrasound and microbubbles targeted gene delivery to cultured primary endothelial cells. J Drug Target. 2007;15:664–71. doi: 10.1080/10611860701605088. [DOI] [PubMed] [Google Scholar]
- Minnaert M. Philos Mag Ser. Vol. 16. Taylor & Francis; 1933. XVI. On musical air-bubbles and the sounds of running water; pp. 235–248. 7. [Google Scholar]
- Mukherjee D, Wong J, Griffin B, Ellis SG, Porter T, Sen S, Thomas JD. Ten-fold augmentation of endothelial uptake of vascular endothelial growth factor with ultrasound after systemic administration. J Am Coll Cardiol. 2000;35:1678–86. doi: 10.1016/s0735-1097(00)00575-1. [DOI] [PubMed] [Google Scholar]
- Park J, Fan Z, Deng CX. Effects of shear stress cultivation on cell membrane disruption and intracellular calcium concentration in sonoporation of endothelial cells. J Biomech. 2011;44:164–9. doi: 10.1016/j.jbiomech.2010.09.003. [DOI] [PMC free article] [PubMed] [Google Scholar]
- Parsons JE, Cain CA, Fowlkes JB. Cost-effective assembly of a basic fiber-optic hydrophone for measurement of high-amplitude therapeutic ultrasound fields. J Acoust Soc Am. 2006;119:1432–40. doi: 10.1121/1.2166708. [DOI] [PubMed] [Google Scholar]
- Phillips LC, Klibanov AL, Wamhoff BR, Hossack JA. Localized ultrasound enhances delivery of rapamycin from microbubbles to prevent smooth muscle proliferation. J Control Release. 2011;154:42–9. doi: 10.1016/j.jconrel.2011.04.020. [DOI] [PMC free article] [PubMed] [Google Scholar]
- Plesset MS, Prosperetti A. Bubble Dynamics and Cavitation. Annu Rev Fluid Mech Annual Reviews. 1977;9:145–185. 4139 El Camino Way, P.O. Box 10139, Palo Alto, CA 94303-0139, USA. [Google Scholar]
- Qamar A, Wong ZZ, Fowlkes JB, Bull JL. Dynamics of acoustic droplet vaporization in gas embolotherapy. Appl Phys Lett. 2010;96:143702. doi: 10.1063/1.3376763. [DOI] [PMC free article] [PubMed] [Google Scholar]
- Qamar A, Wong ZZ, Fowlkes JB, Bull JL. Evolution of acoustically vaporized microdroplets in gas embolotherapy. J Biomech Eng. 2012;134:031010. doi: 10.1115/1.4005980. [DOI] [PMC free article] [PubMed] [Google Scholar]
- Rahim A, Taylor SL, Bush NL, ter Haar GR, Bamber JC, Porter CD. Physical parameters affecting ultrasound/microbubble-mediated gene delivery efficiency in vitro. Ultrasound Med Biol. 2006;32:1269–79. doi: 10.1016/j.ultrasmedbio.2006.04.014. [DOI] [PubMed] [Google Scholar]
- Ryan US. Endothelial Cells. Vol. 3. CRC Press; [Google Scholar]
- Samuel S, Duprey A, Fabiilli ML, Bull JL, Fowlkes JB. In vivo microscopy of targeted vessel occlusion employing acoustic droplet vaporization. Microcirculation. 2012;19:501–9. doi: 10.1111/j.1549-8719.2012.00176.x. [DOI] [PMC free article] [PubMed] [Google Scholar]
- Shpak O, Kokhuis TJ, Luan Y, Lohse D, de Jong N, Fowlkes B, Fabiilli M, Versluis M. Ultrafast dynamics of the acoustic vaporization of phase-change microdroplets. J Acoust Soc Am. 2013a;134:1610–21. doi: 10.1121/1.4812882. [DOI] [PubMed] [Google Scholar]
- Shpak O, Stricker L, Versluis M, Lohse D. The role of gas in ultrasonically driven vapor bubble growth. Phys Med Biol. 2013b;58:2523–35. doi: 10.1088/0031-9155/58/8/2523. [DOI] [PubMed] [Google Scholar]
- Shpak O, Verweij M, Vos HJ, de Jong N, Lohse D, Versluis M. Acoustic droplet vaporization is initiated by superharmonic focusing. Proc Natl Acad Sci U S A. 2014;111:1697–702. doi: 10.1073/pnas.1312171111. [DOI] [PMC free article] [PubMed] [Google Scholar]
- Siddiqui SS, Siddiqui ZK, Malik AB. Albumin endocytosis in endothelial cells induces TGF-beta receptor II signaling. Am J Physiol Lung Cell Mol Physiol. 2004;286:L1016–26. doi: 10.1152/ajplung.00356.2003. [DOI] [PubMed] [Google Scholar]
- Siemann DW. The unique characteristics of tumor vasculature and preclinical evidence for its selective disruption by Tumor-Vascular Disrupting Agents. Cancer Treat Rev. 2011;37:63–74. doi: 10.1016/j.ctrv.2010.05.001. [DOI] [PMC free article] [PubMed] [Google Scholar]
- Sumpio BE, Riley JT, Dardik A. Cells in focus: endothelial cell. Int J Biochem Cell Biol. 2002;34:1508–12. doi: 10.1016/s1357-2725(02)00075-4. [DOI] [PubMed] [Google Scholar]
- Vogel SM, Minshall RD, Pilipović M, Tiruppathi C, Malik AB. Albumin uptake and transcytosis in endothelial cells in vivo induced by albumin-binding protein. Am J Physiol Lung Cell Mol Physiol. 2001;281:L1512–22. doi: 10.1152/ajplung.2001.281.6.L1512. [DOI] [PubMed] [Google Scholar]
- Wong ZZ, Bull JL. J Drug Deliv Sci Technol. Vol. 21. Editions de santé; 2011. Vascular bubbles and droplets for drug delivery; pp. 355–367. [Google Scholar]
- Ye T, Bull JL. Direct numerical simulations of micro-bubble expansion in gas embolotherapy. J Biomech Eng. 2004;126:745–59. doi: 10.1115/1.1824131. [DOI] [PubMed] [Google Scholar]
- Ye T, Bull JL. Microbubble expansion in a flexible tube. J Biomech Eng. 2006;128:554–63. doi: 10.1115/1.2206200. [DOI] [PubMed] [Google Scholar]