

Abstract
Bioinorganic canon states that active-site thiolate coordination promotes rapid electron transfer (ET) to and from type 1 copper proteins. In recent work, we have found that copper ET sites in proteins also can be constructed without thiolate ligation (called “type zero” sites). Here we report multifrequency electron paramagnetic resonance (EPR), magnetic circular dichroism (MCD), and nuclear magnetic resonance (NMR) spectroscopic data together with density functional theory (DFT) and spectroscopy-oriented configuration interaction (SORCI) calculations for type zero Pseudomonas aeruginosa azurin variants. Wild-type (type 1) and type zero copper centers experience virtually identical ligand fields. Moreover, O-donor covalency is enhanced in type zero centers relative that in the C112D (type 2) protein. At the same time, N-donor covalency is reduced in a similar fashion to type 1 centers. QM/MM and SORCI calculations show that the electronic structures of type zero and type 2 are intimately linked to the orientation and coordination mode of the carboxylate ligand, which in turn is influenced by outer-sphere hydrogen bonding.
Introduction
Copper coordination complexes are intrinsically poor electron transfer (ET) agents, owing primarily to unfavorable reorganization energies (λ) associated with CuII/I structural rearrangements during redox cycling. Such ET behavior is exemplified by the coordination complex [Cu(phen)2]2+ (phen = 1,10-phenanthroline), with λ= 2.4 eV.1 Nature has overcome this problem to allow copper to perform redox functions in living systems: type 1 sites in proteins have dramatically lowered λ's (~ 0.6–0.8 eV),2 with self-exchange ET rate constants as much as ~ 106 higher than those of CuII/I model complexes.
Both the physical and chemical properties of type 1 (blue) copper proteins have been extensively investigated.3 The minimal conserved inner coordination sphere of blue copper consists of two histidine nitrogens and a cysteine thiolate ligand (Figure 1a). Often there are weaker axial interactions involving either a methionine thioether or a glutamine amide (at the “south pole”); and in a few cases an additional axial interaction with a glycine backbone carbonyl is encountered (at the “north pole”). The overall coordination geometry within the family of type 1 copper sites varies from trigonal bipyramidal to pseudotetrahedral.3c Outer-sphere coordination involving a hydrogen bonding network formed between backbone amides and a cysteine thiolate (“the rack”) is largely responsible for the low reorganization energies associated with the high ET reactivity of these proteins.4
Figure 1.

Sequential perturbations to type 1 WT azurin (a, PDBID: 4AZU) giving rise to type zero copper. The C112D variant (b, PDBID: 3FQY) binds Cu in the type 2 mode with essentially planar equatorial coordination. Removal of “south pole” axial ligation via the subsequent M121L mutation gives rise to the pseudotetrahedral type zero site (c, PDBID: 3FPY). Oxygen atoms are red, nitrogen atoms are blue, and sulfur atoms are yellow. Inner-sphere coordination is indicated by black dashed lines, outer-sphere coordination is indicated by red dashed lines.
Blue copper proteins exhibit an intense (ε ~ 5000 M−1cm−1) absorption band near 16,000 cm−1. While the origin of this band was a topic of extensive debate, it was assigned in 1976 to a ligand to metal charge transfer (LMCT) transition from the cysteine thiolate to CuII.5 The transition is unusual as the orbitals involved are π-bonding and π-antibonding combinations of sulfur 3p and Cu 3dx2−y2, not the corresponding σ-components.3d The π-antibonding combination is singly occupied (e.g. the SOMO) in the electronic ground state. Importantly, this π-covalency has been shown by Solomon and coworkers to be particularly high.6 Thus, according to the accepted interpretation, only approximately 40% copper d-character remains in the SOMO, which accounts for the remarkably small 63/65Cu electron-nuclear hyperfine couplings (60<Az<285MHz) in the signature EPR spectra of type 1 proteins.6–7
The high ET reactivity of type 1 copper is attributable in large measure to S-Cu covalency, which originates from efficient overlap between energetically well-matched thiolate and copper d-orbitals that is enforced by the rack. In addition to lowering λ, the rack also specifically orients the cysteine sidechain, which in turn leads to exceptionally strong electronic coupling between the protein and the copper, thereby enhancing ET through the S-Cu bond.8 This enhanced coupling is particularly important for multidomain copper proteins such as the multicopper oxidases and nitrite reductases, where type 1 copper sites are directly linked to catalytic sites through short peptide segments involving the cysteine thiolate.9
We have generated a series of hard-ligand, high-potential copper sites in variants of the cupredoxin azurin from Pseudomonas aeruginosa (Figure 1b,c).10 Among these constructs we unexpectedly observed cases (C112D/M121X (X = L, F, I) azurins) featuring small Cu hyperfine splittings in EPR spectra together with accelerated ET activities.11 Since these properties are rare for copper complexes, we proposed in our initial report that they should be referred to as “type zero” sites in order to distinguish them from type 1 centers. We proceeded to demonstrate that the enhanced ET properties are associated with low λ values12 owing to site rigidity conferred by the same hydrogen bond network found in the wild-type (WT) protein.
We have performed electronic structure calculations that show clearly that outer-sphere interactions enforce the electronic structure of type zero copper centers. Moreover, we have found that the rack enhances delocalization of the unpaired Cu electron over the sidechain of the O-donating aspartate (D112), partially restoring the electronic structure that gives rise to the remarkably high ET reactivity of type 1 copper centers.
Materials and Methods
All buffers were prepared with 18.2 MΩ Milli-Q water. C112D and C112D/M121X (X = L, F) azurins were prepared as described previously.11
Multifrequency CW EPR Spectroscopy
Samples for CW EPR were prepared in 50 mM HEPES pH 7.0 containing 50% glycerol. S-band and Q-band spectra were measured using a Bruker ESP-300E spectrometer with an S-band loop-gap resonator (Bruker design ER4118SPT with custom improvements) or a Bruker Q-band cavity (ER5106QT), both with Bruker flexline support and an Oxford Instruments helium cryostat (CF935). Microwave frequencies were measured with a Hewlett-Packard frequency counter (HP5352P), and the field control was calibrated with a Bruker NMR field probe (ER035M). The spectra were simulated on the basis of a spin-Hamiltonian description of the electronic ground state with S = ½:
| (1) |
Anisotropy in g⊥(namely, the degree of rhombicity) was quantified as Rg according to Eq. (2):13
| (2) |
Magnetic Circular Dichroism Spectroscopy
Samples for MCD were prepared by adding glycerol to ~50% to C112D and C112D/M121X (X = L, F) azurins in 100 mM HEPES, pH 7.0. Proteins were added to MCD cells and repeatedly frozen at 77 K until optically transparent samples were achieved. MCD spectra were obtained at liquid He temperatures (5 and 10 K) on a Jasco J-715 (200–1060 nm) with an extended S-20 and S-1 photomultiplier tube (Hammamatsu). The J-500C spectrometer was equipped with an Oxford Instruments SM4-11 T superconducting magnet/cryostat. Spectra were recorded at ±1, ±3, ±5, and ±7 T.
Nuclear Magnetic Resonance Spectroscopy
Samples for NMR spectroscopy were prepared in 50 mM HEPES pH 7.0 buffer in either 10 or 100% D2O as required for each experiment, and concentrated to 400 – 500 μl of 2 – 3 mM protein. NMR experiments were carried out on a Bruker Avance II NMR Spectrometer operating at a frequency of 600.13 MHz (1H frequency) using a triple-resonance (TXI) probehead. 1H spectra were recorded using the sequence zgprPASE14 consisting of a π/2 detection pulse preceded by two pre-saturation pulses (a selective pulse on the water signal and a shorter one over the diamagnetic region) on a spectral window of ca. 100 kHz and with a total recycle time of ca. 150 ms. Saturation transfer difference experiments were performed on samples containing both the oxidized and the reduced forms of the protein (10 to 30% of reduced protein obtained by addition of suitable substoichiometric amounts of sodium ascorbate). All of these spectra were acquired using the experimental scheme reported by Banci et al,15 irradiating the hyperfine-shifted resonance of interest for ca. 50 ms at a power of ca. 1 mW, and with a total recycle time of ca. 300 ms.
Calculation of Coupling Constants
The hyperfine electron–nucleus coupling constant, A/ℏ, can be obtained directly from the contact chemical shift of the corresponding resonance according to the following equation:16
| (3) |
γ is the nuclear gyromagnetic ratio, kB is the Boltzmann's constant, is the average of the g-values, μB is the Bohr magneton, S is the electronic spin (½ in this case), T is the absolute temperature and δcon is the contact chemical shift. The contact chemical shift in turn can be calculated from the observed chemical shift:17
| (4) |
In this work, δdia values were obtained from saturation transfer experiments, whereas the pseudocontact shifts were estimated from EPR data according to equation (5):17
| (5) |
μ0 is the vacuum permeability, r is the copper–nucleus distance, θ is the angle between the gz and the vector r and g∥ and g⊥ are the parallel and perpendicular g-values, respectively.
Computational Methods
Calculations were performed using the ORCA quantum chemistry suite.18 Calculations were based on the following X-ray structures: 4AZU = WT, 3FQY = C112D, 3FPY = C112D/M121L, 3FQ2 = C112D/M121F. For calculations involving X-ray structures, hydrogen atoms were added and their geometries optimized. We also performed QM/MM calculations using the ORCA/Gromacs interface.19 The QM region in the QM/MM calculations comprised the Cu ligands as well as residues 47, 114, and 121; thus outer-sphere coordination is explicitly included (Figure S1). QM and MM regions were partitioned such that that amide groups replaced amino termini. Electrostatic embedding was used throughout. Geometries were optimized in the presence of protein point charges (~2 × 10⁴) and solvation that included ~2600 water molecules. Optimizations used the BP86 functional20 in conjunction with the scalar relativistically recontracted versions of the def2-SV(P) basis set.21 All geometry optimizations incorporated scalar relativistic effects using the 0th order regular approximation (ZORA).22 The overall models were minimized using the steepest descent algorithm with the QM region fixed. The minimized geometries were equilibrated by performing classical molecular dynamics (MD) simulations for 100 ps. Finally, the relaxed geometries were used in QM/MM calculations.
The B3LYP functional23 was used for EPR calculations. The CP(PPP)24 basis was used for Cu. The EPR-II basis25 was selected for nitrogen and oxygen atoms, the IGLO-II basis26 for sulfur atoms, and the def2-SV(P) was used to treat the remaining atoms. For all EPR calculations, scalar relativistic ZORA single point calculations were performed, employing a model potential derived for atomic ZORA calculations.22 In these calculations, the basis sets were decontracted. The integration accuracy for Cu was additionally increased and three steep s-functions with exponents 3, 9, and 27 times larger than the exponent of the steepest s-function in the CP(PPP) basis set were added.
EPR properties were predicted using coupled perturbation Kohn-Sham theory for the g-tensor27 and the spin-orbit coupling (SOC) operator was treated by the spin-orbit mean-filed (SOMF) approximation.28 Fermi contact terms and spin-dipole contributions to the hyperfine coupling contributions were obtained as expectation values over the B3LYP ground state spin density. First-order hyperfine coupling constants were calculated for 1H and 14N, while spin-orbit contributions were taken into account for Cu.29 Isotropic Fermi contact terms were used to approximate NMR contact shifts using experimental g values and Eq. (1). XAS spectra were calculated according to a previously established time-dependent DFT (TDDFT) protocol.30 TDDFT calculations were initiated starting from converged B3LYP/SV(P) single-point solutions as described above.
Spectroscopy-oriented configuration interaction (SORCI) calculations31 were performed as described previously to predict LF excitation energies.32 These calculations were performed on small, ~35 atom active site models to achieve realistic computational expense. The MCD spectra were computed by the explicit treatment of spin–orbit coupled (SOC) and spin–spin coupled (SSC) N-electron states. Calculations were performed over a CAS(9,5) complete active space. The def2-SV(P) basis set was used for all atoms except for Cu and ligated heteroatoms, which used the def2-TZVPP and def2-TZVP(-f) bases, respectively. As described elsewhere in detail, individual selection was used in order to ease the computational burden.31 The size of the first-order interacting space was reduced with a threshold Tsel= 10−6 Eh. A further approximation involves reduction of the reference space through another selection–all initial references that contribute less than a second threshold (Tpre= 10−5) to the zeroth order states are rejected from the reference space. The initial orbitals for the first step of the SORCI procedure were taken from quasi-restricted orbitals33 that were further subjected to Pipek-Mezey localization34 in order to arrive at a reference space that can be rationally chosen.
Results and Analysis
Origin of type zero EPR properties
The narrow, 300 MHz Az together with a highly anisotropic g⊥ and the absence of a strong LMCT band in the visible region are the spectroscopic signatures of type zero copper sites.11 These features reflect the electronic structure common to these sites, which is intimately linked to its electron transfer properties. Hence, understanding these spectroscopic features in detail is imperative for arriving at an experimentally substantiated bonding description. To this end, it is useful to recall the ligand field model for the calculation of relevant EPR parameters.
The copper d-based molecular orbitals are written as:
| (6a) |
| (6b) |
| (6c) |
| (6d) |
| (6e) |
In the electronic ground state of CuII the ψx2−y2 orbital is singly occupied and all other MOs are doubly occupied. The α's measure the `covalent dilution' of the metal d-based orbitals with ligand orbitals ψL1 and metal-ligand overlap has been neglected. Due to perceived distortions from ideal axial symmetry, the formal angle β is used to describe the mixing that may occur between dx2−y2 and dz2 in the SOMO. Based on these MOs and approximating the ligand field excited states by single determinants obtained by promoting an electron from a doubly occupied MO to the SOMO, the g-values become (Eqs. 7a–7c):
| (7a) |
| (7b) |
| (7c) |
ζCu represents the one-electron quasi-atomic copper spin-orbit coupling (SOC) constant (usually taken to be 829 cm−1), The ΔE values are excitation energies involving the promotion of one electron between doubly-occupied copper d-based MOs and the dx2−y2-based SOMO. LFT can also be used to generate expressions for metal hyperfine coupling (Eqs. 8a–8c):
| (8a) |
| (8b) |
| (8c) |
Here is a quasi-atomic parameter that is often given the value 1187 MHz (396 × 10−4 cm−1). The parameter −Pdκ represents the isotropic Fermi contact (AzFC) term that is treated purely phenomenologically in ligand field theory. McGarvey has noted that attempts to correlate this term to have not been overwhelmingly successful.35 In fact, the spin-polarization mechanism is fairly complicated.36 The second term, which is proportional to the SOMO copper spin-population , represents the spin-dipolar (AzSD) contribution. The last entry, which is proportional to Pd Δg, is the orbital dipolar (AzOD) term. Note that for the OD part we have not considered a small term arising from the spin-dipolar interaction with the SOC. As argued previously,37 this term is proportional to the square of the total spin and hence should not be part of the HFC interaction in the usual spin Hamiltonian.
While not being quantitatively accurate,38 eqs. 7–8 highlight the key properties that need to be experimentally addressed using a battery of spectroscopic techniques. Rhombicity in the g-values will arise in this model from two sources: a) the anisotropy in the covalency (αxz ≠ αyz together with ΔEyz→x2−y2 ≠ ΔExz→x2−y2) and b) β values unequal to zero.
Eq. 8c offers several possible explanations for the low Azz that in part characterizes type zero copper proteins: i) a large, positive AzOD arising from low-lying LF excitations; ii) attenuation of AzFC and AzSD contributions from excessive delocalization of spin density over ligand nuclei (high active-site covalency, as in type 1 copper). iii) extensive mixing of dx2−y2 and dz2 orbitals. With increasing dz2 character comes additional 4pz mixing that will further reduce the hyperfine coupling.39
Of these possibilities iii) was dismissed on the basis of recent X-ray absorption measurements on type zero copper sites that demonstrate that this mechanism likely is not operative, just as it is not in blue copper.6b, 11 We will further analyze this point below.
Several spectroscopies were used in the present work to evaluate the aforementioned contributions to Azz. A combination of EPR and NMR techniques was employed to probe the electron delocalization onto the ligand framework in type zero sites. MCD was used to investigate low-lying LF excitations. Results from these measurements were than correlated with combined quantum mechanics/molecular mechanics (QM/MM) calculations that shed light on the unique geometric and electronic structures of type zero copper sites.
Multifrequency CW EPR Spectroscopy
Owing to the field dependence of EPR transitions arising from the principal components of the g-tensor, glassed solution spectra of C112D and C112D/M121X (X = L, F) azurins were recorded at S- (3.4 GHz) and Q-band (34 GHz) to supplement the X-band (9.5 GHz) data and thus to extract more precise values for the components of the spin Hamiltonian (Table 1). The three frequencies yielded slightly different sets of simulation parameters. However, S-band gives precise field-independent A-values and Q-band gives precise field-dependent g-values. Thus, reported A-values were extracted from S-band spectra, and g-values were extracted from Q-band spectra.
Table 1.
Anisotropic g- and A-values (MHz) for azurin variants derived from simulation of frozen solution multi-frequency (S-, X-, and Q-band) EPR spectra.
| gz | gy | gx | Rga | Az b | A N1,z | A N1,y | A N1,x | A N2,z | A N2,y | A N2,x | |
|---|---|---|---|---|---|---|---|---|---|---|---|
| C112D | 2.3088 | 2.0653 | 2.0589 | 0.11 | 471 | 24 | 28 | 28 | 33 | 37 | 37 |
| C112D/M121L | 2.3820 | 2.1172 | 2.0479 | 0.86 | 303 | 21 | 21 | 21 | 21 | 21 | 21 |
| C112D/M121F | 2.3831 | 2.0963 | 2.0571 | 0.53 | 309 | 22 | 20 | 20 | 22 | 20 | 20 |
| Wild-typec | 2.273 | 2.0568 | 2.0393 | 0.38 | 172 | 27 | 25 | 27 | 18 | 18 | 21 |
| CuCl42−,d | 2.232 | 2.049 | 2.049 | 0 | 490 | - | - | - | - | - | - |
The S-band EPR spectrum of C112D azurin contains resolved 14N superhyperfine coupling (SHC) in the gz region, in accord with previous observations (Figure 2a). Meanwhile, the Q-band spectrum of C112D azurin reveals a very slight anisotropy (Rg = 0.11) in g⊥. In contrast to C112D azurin, type zero C112D/M121X (X = L, F) proteins display no resolvable 14N SHC at S-band, consistent with a prior suggestion of attenuated Cu-N interaction in these cases (Figure 2b,c). Q-band spectra confirm the large g⊥-anisotropies in type zero proteins, with C112D/M121L having a larger anisotropy (Rg = 0.86) than C112D/M121F (Rg = 0.53). Extracted spin Hamiltonian parameters accord with values from earlier X-band studies.
Figure 2.

Multifrequency EPR spectra of (a) C112D, (b) C112D/M121L, and (c) C112D/M121F azurins. S- and X-band spectra have been aligned to showcase the 63,65Cu Az| splitting.
Magnetic Circular Dichroism Spectroscopy
MCD measurements were carried out with the aim of obtaining insight into the d-d excited states that are most relevant for the interpretation of the EPR parameters of type zero copper sites. It has been established that in MCD spectra, d-d transitions tend to be more intense than LMCT transitions.42 The electronic absorption spectra of C112D and C112D/M121X (X = L,F) azurins11, 43 reveal the presence of broad, asymmetric features. In all of these proteins, there is an intense shoulder ~1500 M−1cm−1 at 32,300 cm−1, while there are weaker (~100 M−1cm−1) absorption bands at lower energies. Gaussian deconvolutions of the UV/vis data including the near-infrared region provide evidence for two such bands for all three proteins (Figure 3, Table 2). MCD spectroscopy, being a signed quantity, is able to better resolve these latter bands and hence permits the assignment of spectral features to individual d-d excitations.
Figure 3.

UV/vis (black) and MCD (red) spectra of (a) C112D, (b) C112D/M121L, and (c) C112D/M121F azurins.Results of Gaussian deconvolutions of the UV/vis spectra are plotted in gray. MCD spectra were recorded at a magnetic field strength of 7 T at 5.3 K in 50 mM HEPES pH 7.0 containing 50% glycerol.
Table 2.
LF transitions in the optical spectra of C112D and C112D/M121X (X = L,F) azurins.
| Band | Energy (cm−1) | ε (M−1cm−1) | Assignment | |
|---|---|---|---|---|
| C112D | 2 | 12,200 | 50 | ψxz,yz → ψx2−y2 |
| 1 | 14,300 | 60 | ψxz,yz → ψx2−y2 | |
|
| ||||
| C112D/M121L | 2 | 9,200 | 50 | ψxz,yz → ψx2−y2 |
| 1 | 12,500 | 90 | ψxz,yz → ψx2−y2 | |
|
| ||||
| C112D/M121F | 2 | 9,200 | 40 | ψxz,yz → ψx2−y2 |
| 1 | 12,500 | 70 | ψxz,yz → ψx2−y2 | |
Intensity-normalized MCD spectra for the C112D and C112D/M121X (X = L,F) azurins are also presented in Figure 3, with features and assignments set out in Table 2. C112D azurin displays a negative absorption shaped feature at 14,700 cm−1 and weak positive feature to lower energy with an apparent maximum ~9,000 cm−1. The type zero azurins exhibit a pseudo A-term shaped feature with a positive peak at 10,000 cm−1 and a negative peak at 13,200 cm−1. All of these bands gain substantial MCD intensity relative to the 32,300 cm−1 shoulders, which is consistent with their assignment to LF and CT transitions, respectively. Importantly, all observed features are inversely proportional to temperature, thus classifying them as C-terms (Figure S1).
The C112D MCD spectrum closely resembles that reported for square-planar [CuCl4]2−,44 except that all transitions are shifted to lower energies than in CuCl42−. This result is not surprising in view of the similarity between the spin-Hamiltonian parameters of CuCl42− and C112D azurin. However, in the absence of π-donating ligands, we expect the quasi-degenerate ψxz,yz orbitals at lower energy in C112D azurin relative to [CuCl4]2−. Accordingly, the 12,200 and 14,700 cm−1 bands are tentatively assigned to transitions from ψxz,yz to ψx2−y2. The remaining LF transition from the dxy based MO into the SOMO should appear around 7000 cm−1, which lies outside our instrumental window.
The C112D/M121X (X = L,F) MCD spectra resemble that of type 1 copper.42 The pseudo-A feature is thus assigned to transitions from the ψxz,yz pair into ψx2−y2. Extending the comparison to the type 1 optical spectrum, we predict further transitions from ψxy and from ψz2 into ψx2−y2 near 8,000 and 4,000 cm−1, respectively. Unfortunately, these predictions place these bands outside our instrumental window. Support for our MCD assignments comes from SORCI MCD calculations (vide infra).
NMR Spectroscopy
The 1H NMR spectrum of oxidized C112D azurin is devoid of hyperfine-shifted resonances, indicative of a long electron relaxation time for CuII, which in turn is consistent with a type 2 copper center (τe ≥ 10−9 s).45 In contrast, several hyperfine-shifted resonances are observed outside the diamagnetic envelope in the 1H spectra of type zero C112D/M121L and C112D/M121F azurins (Figure 4a,b). Chemical shifts and linewidths for these resonances are similar to those reported for type 1 copper centers, particularly WT azurin46 (Figure 4c), suggesting τe ~ 10−10 s in type zero centers.45 All the hyperfine-shifted resonances in both type zero mutants followed a Curie temperature dependence. No other paramagnetically shifted signals were observed beyond the spectral window shown in Figure 4a,b.
Figure 4.

600 MHz1H NMR spectra of C112D/M121X(X = L, a; F, b) and WT (c) azurins recorded at 298 K in 50 mM HEPES pH 7.0 containing 10% D2O. Solvent-exchangeable resonances are marked with an asterisk. Insets show resonance b in C112D/M121L and C112D/M121F spectra when recorded in 100% D2O. FIDs were processed with a preexponential factor of 80 Hz.
Resonances a and c in type zero spectra were absent when recorded on a sample in 100% D2O, indicating that they correspond to solvent-exchangeable protons. These resonances may be assigned to the exchangeable Hε2's from either the H46 or H117 imidazole rings. Spectra in 100% D2O also revealed the presence of resonance b under the envelope of the exchangeable signals. Saturation transfer difference (STD) experiments were then carried out over a sample containing both the oxidized and the reduced forms of the protein. Irradiation of resonances b, d and e in 100% D2O yielded diamagnetic responses at 2.7, 8.6 and 7.2 ppm for C112D/M121L and 2.5, 8.7 and 7.3 ppm for C112D/M121F azurins (Table 3). Considering their linewidths and diamagnetic chemical shifts, resonances d and e were assigned to the carbon-attached Hδ2 protons from the histidine ligands46 (H46 and H117) and resonance b was assigned to the ßCH2 protons of residue D112 (here only one broad signal at 2.5 (C112D/M121L) or 2.7 ppm (C112D/M121F) is observed, which could either correspond to one or, more plausibly, both ß-protons). Resonances f (C112D/M121L) and g (C112D/M121F) could not been assigned by STD experiments due to off-resonance irradiation of the diamagnetic region. STD experiments in 90% H2O were unsuccessful in correlating resonances a and c to diamagnetic shifts.
Table 3.
Estimated pseudocontact and contact contributions and A/ħ values for the hyperfine-shifted 1H resonances in the NMR spectra of C112D/M121L, C112D/M121F and WT azurins.
| C112D/M121L azurin | ||||||
| Resonance | Assignment | δobs (ppm) | δdia (ppm) | δpc (ppm) | δ contact | A/ħ (MHz) |
| a | H46/117 Hε2 | 62 | 11.7a | −1 | 48 | 1.7 |
| b | D112 Hß1/2 | 52 | 2.7 | −3 | 52 | 1.8 |
| c | H46/117 Hε2 | 44 | 11.7a | −1 | 31 | 1.1 |
| d | H46/117 Hδ2 | 31 | 8.6/7.2 | −1 | 22–24 | 0.7–0.8 |
| e | H46/117 Hδ2 | 28 | 8.6/7.2 | −1 | 20–22 | 0.7 |
| f | ND | 20 | ND | ND | ND | ND |
| C112D/M121F azurin | ||||||
| Resonance | Assignment | δobs (ppm) | δdia (ppm) | δpc (ppm) | δ contact | A/ħ (MHz) |
| a | H46/117 Hε2 | 59 | 11.7a | −1 | 49 | 1.7 |
| b | D112 Hß1/2 | 59 | 2.5 | −3 | 60 | 2.1 |
| c | H46/117 Hε2 | 48 | 11.7a | −1 | 37 | 1.3 |
| d | H46/117 Hδ2 | 25 | 8.7/7.3 | −1 | 17–19 | 0.6 |
| e | H46/117 Hδ2 | 25 | 8.7/7.3 | −1 | 17–19 | 0.6 |
| g | ND | −5 | ND | ND | ND | ND |
| Wild-Type azurin b | ||||||
| Resonance | Assignment | δobs (ppm) | δdia (ppm) | δpc (ppm) | δ contact | A/ħ (MHz) |
| C112 Hß1/2 | 850 | 3.48 | −1.8/−0.3 | 850/800 | 28/27 | |
| C112 Hß2/1 | 800 | 2.91 | −0.3/−1.8 | 800/850 | 27/28 | |
| a | H117 Hδ2 | 54.0 | 6.91 | −1.1 | 48.2 | 1.6 |
| b | H46 Hδ2 | 49.1 | 5.92 | −1.3 | 44.5 | 1.5 |
| c | H117/46 Hε1 | 46.7 | 6.78/6.87 | −3.4/−4.5 | 43.3/30.6 | 1.5/1.0 |
| d | H46/117 Hε1 | 34.1 | 6.87/6.78 | −4.5/−3.4 | 31.7/44.4 | 1.1/1.5 |
| e | H117 Hε2 | 27 | 11.69 | NR | NR | NR |
| f | H46 Hε2 | 26.9 | 11.46 | −1.3 | 16.7 | 0.56 |
| g | N47 Hα | 19.9 | 4.71 | −0.3 | 15.5 | 0.52 |
Diamagnetic shifts taken from reference 46 for WT azurin.
Data taken from reference 46.
ND = not determined, NR = not reported
Pseudocontact and contact contributions to the shifts observed for the hyperfine-shifted resonances were estimated as indicated in the experimental section and are listed in Table 3. We observe an A/ħ ~ 2 MHz for the D112 βCH protons. Taking into account that these nuclei are four bonds from CuII, this value indicates there is substantial electron delocalization over the sidechain of residue 112 in type zero azurins, just as there is in type 1 copper centers. Delocalization onto histidine residues differs compared to that found for type 1 copper centers. It has been shown that hyperfine couplings for the solvent-exchangeable Hε2 protons are smaller than those for the carbon-attached protons in the blue copper proteins azurin, plastocyanin and stellacyanin.46 In the case of type zero centers, assigning resonances a and c to the Hε2 protons necessitates a roughly two-fold larger hyperfine shift compared to the histidine ring carbon protons. Thus, while electron delocalization over the histidines goes as Hδ2>Hε1>Hε2 for WT azurin, a different delocalization mechanism is operative in type zero systems.
The direct observation of hyperfine-shifted resonances in the NMR spectra of type zero azurins suggests the presence of a low-lying excited state that shortens τe in this center compared to that of type 2 copper. Moreover, the linewidths of the resonances here detected are comparable to, or even smaller than, those for WT azurin, suggesting that the first excited state in these centers is less than ca. 5,000 cm−1 from the ground state.
Calculations
For insight into the electronic structural origins of the spectroscopic features of the C112D and type zero azurins, we combined DFT and SORCI calculations of active-site regions of the C112D and C112D/M121X (X = L, F) proteins. The resulting electronic structure calculations were subsequently used to calculate EPR parameters as well as MCD and XAS spectra. To explore the sensitivity of these calculations to molecular structure, various QM/MM optimizations with different setups were performed (Figure S3, Table 4). The QM region included all inner-sphere ligand residues as well as outer-sphere residues N47/F114. For type zero proteins, the QM region also included aliphatic residues at position 121. Unconstrained optimizations led to unacceptably short Cu-O(G45) distances (~2.1 Å). Consequently, the crystallographically determined distances were imposed as constraints. Two sets of calculations were performed on each structure which constrained the Cu-Oδ2(D112) such that either mono- or bidentate coordination modes were obtained for the carboxylate ligand.
Table 4.
Experimental and calculated distances (Å) for C112D and C112D/M121X (X = L, F) azurins from X-ray and QM/MM structures.
| Cu-O(G45) | Cu-N(H46) | Cu-N(H117) | Cu-Oδ1(D112) | Cu-Oδ2(D112) | |
|---|---|---|---|---|---|
| C112D | |||||
| X-ray | 2.59 | 2.05 | 2.04 | 1.92 | 2.80 |
| Monodentate | 2.59a | 1.98 | 1.92 | 1.92a | 2.80a |
| Bidentate | 2.59a | 2.00 | 1.96 | 2.03 | 2.17 |
|
| |||||
| C112D/M121L | |||||
| X-ray | 2.35 | 1.94 | 2.04 | 1.92 | 3.42 |
| Monodentate | 2.35a | 1.95 | 1.95 | 1.97 | 3.31 |
| Bidentate | 2.35a | 2.00 | 2.00 | 2.00a | 2.35a |
|
| |||||
| C112D/M121F | |||||
| X-ray | 2.44 | 1.97 | 1.99 | 2.00 | 3.27 |
| Monodentate | 2.44a | 1.97 | 1.95 | 1.95 | 3.06 |
| Bidentate | 2.44a | 2.01 | 2.03 | 2.00a | 2.35a |
Interatomic distance constrained during QM/MM optimization.
For C112D azurin, QM/MM optimization of the active site results in bidentate coordination by the D112 carboxylate, as well as approximately equivalent Cu-N(H46/117) bond distances. Constraining the Cu-O(D112) distances to crystallographic values results in shortened Cu-N(H46/117) bonds with an energetic penalty of 18 kJ/mol relative to the unconstrained, decidedly bidentate D112 optimization. The opposite result is observed in optimizations of type zero azurins. Here, an unconstrained D112 maintains a monodentate coordination mode, with the free carboxylate oxygen more than 3 Å from the Cu. For both type zero azurins, the optimized Cu-N(H46/117) distances are approximately equivalent. Constraining the “free” carboxylate oxygen 2.35 Å from Cu again leads to extension of Cu-N(H46/117) distances and respective energetic destabilizations of 13 and 8 kJ/mol for the C112D/M121L and C112D/M121F proteins.
EPR parameters were calculated with the B3LYP functional for crystallographically determined and QM/MM optimized active sites of C112D and C112D/M121X (X = L,F) azurins (Table 5). In all cases gz is underestimated; however, this is typically observed in DFT calculations of EPR parameters.47 This underestimation of gz leads to a large error in the calculated Az values, owing to severely (as much as 30%) underestimated values for the orbital dipolar (OD) contribution. As a result, a correction is applied to Az to account this systematic underestimation (Eq. 9):48
| (9) |
Satisfactory reproduction of C11D EPR parameters is achieved using the bidentate QM/MM structure. The X-ray and monodentate QM/MM structures yield unacceptably large g⊥ anisotropies. For type zero proteins, the monodentate QM/MM and X-ray structures give reasonable agreement. Here, the g-shifts comprising g⊥ are overestimated, resulting in very large values of Ax and Ay.
Table 5.
Calculated g-values and Cu hyperfme coupling constants (in MHz).
| gx | gy | gz | Ax | Ay | Aza | |
|---|---|---|---|---|---|---|
| C112D | ||||||
| X-ray | 2.035 | 2.114 | 2.284 | −191 | 249 | 311 |
| Monodentate | 2.042 | 2.119 | 2.237 | −185 | 201 | 330 |
| Bidentate | 2.061 | 2.064 | 2.199 | 24 | 41 | −394 |
|
| ||||||
| C112D/M121L | ||||||
| X-ray | 2.085 | 2.123 | 2.357 | 117 | −129 | 182 |
| Monodentate | 2.075 | 2.136 | 2.323 | 133 | 183 | −151 |
| Bidentate | 2.071 | 2.100 | 2.248 | 31 | 180 | −255 |
|
| ||||||
| C112D/M121F | ||||||
| X-ray | 2.095 | 2.122 | 2.351 | 102 | 156 | 45 |
| Monodentate | 2.066 | 2.091 | 2.253 | 59 | 67 | −229 |
| Bidentate | 2.047 | 2.137 | 2.256 | −51 | 178 | −230 |
|
| ||||||
| Wild-Type | ||||||
| X-ray | 2.054 | 2.089 | 2.171 | 23 | 63 | −78 |
| QM/MM | 2.057 | 2.078 | 2.171 | 41 | 58 | −142 |
Az corrected for underestimated orbital dipolar contribution. See Ref 48.
Analysis of the hyperfine contributions allows further evaluation of the electronic structure calculations (Table 6). Notably, for all of the calculated electronic structures, Az trends according to experiment: type 1 < type zero < type 2. Moreover, the hyperfine parameters calculated for WT azurin closely match those reported for plastocyanin using a similar computational approach.48 Here, AzFC and AzSD are expected to be attenuated by the high Cu-S(Cys) covalency. For the C112D structure, calculations using the monodentate QM/MM structures produce values for both AzFC and AzOD that are unreasonably low given the absence of this Cu-S interaction. Moreover, the monodentate C112D electronic structure results in a positive value for AzSD; this necessitates substantial dz2 mixing (high formal angle ß) that is in conflict with the negligible experimental anisotropy in g⊥. In addition, the monodentate electronic structure carries a 3000 cm−1 penalty in total energy relative to the bidentate solution. For type zero proteins, the QM/MM structures generally give hyperfine parameters that are in better agreement with experiment than the crystal structures, although the parameters are largely indistinguishable between monodentate and bidentate models.
Table 6.
Calculated contributions to Az (in MHz)
| AzFC | AzSD | AzOD (corrected)a | AzOD (exp)b | Total | Total (exp) | |
|---|---|---|---|---|---|---|
| C112D | ||||||
| Monodentate | −65 | 328 | 67 | 330 | 471 | |
| Bidentate | −300 | −497 | 403 | −394 | ||
|
| ||||||
| C112D/M121L | ||||||
| Monodentate | −213 | −422 | 484 | −151 | 303 | |
| Bidentate | −253 | −487 | 485 | −255 | ||
|
| ||||||
| C112D/M121F | ||||||
| Monodentate | −282 | −476 | 529 | −229 | 309 | |
| Bidentate | −283 | −450 | 503 | −230 | ||
|
| ||||||
| Wild-Type | ||||||
| QM/MM | −210 | −373 | 441 | −142 | 172 | |
Considering the accuracy of both the g-tensor and hyperfine calculations, agreement is best using the bidentate C112D QM/MM structure and the monodentate type zero QM/MM structures. However, in the C112D case, the calculated structure differs significantly from experiment; in particular the distal carboxylate oxygen moves closer to the copper by ~0.6 Å in the calculations compared to the X-ray structure. In type zero cases the discrepancies between calculated and experimental structures are subtler. We note that the reported error in the crystallographic coordinates of all three proteins is on the order of 0.15 Å. This value includes the entire protein and need not necessarily apply to the metal binding sites.49 From spectroscopic and kinetics studies it was concluded that C112D/M121L azurin undergoes minimal structural rearrangement during redox cycling.12 However, C112D was shown experimentally to exhibit substantial structural perturbation upon reduction. The enhanced site rigidity of type zero proteins is borne out in the Debye-Waller (B) factors reported in the crystallographic analysis. Residue D112 for C112D azurin exhibits B values of 25–30 Å2, and C112D/M121L,F proteins have values of 14–18 and 18–22 Å2, respectively. Guided by this reasoning, it is not surprising that the monodentate QM/MM and X-ray diffraction models are in reasonable agreement for type zero proteins, while optimizations are more challenging for C112D azurin. As the QM/MM structure is probably the most realistic calculation that we are able to perform on this system, we have used the optimized monodentate C112D/M121L structure for all subsequent analyses. Likewise, the bidentate QM/MM structure was used as the basis for analysis of the C112D electronic structure. C112D/M121F represents an intermediate case; here, some structural perturbations are expected, owing to the observation of multiple F15 sidechain conformations.11 However, for consistency with the C112D/M121L analysis, we have used the monodentate QM/MM optimized C112D/M121F for subsequent discussion.
Löwdin analyses indicate 67% of the total unpaired spin population is on CuII in C112D azurin (Table 7). For C112D/M121X (X = L,F) proteins, these values are 64.3 and 68.1%, respectively. Orbital decomposition of the spin population over the Cu in C112D shows that it is principally relegated to Cu 3d. For type zero proteins, ~3% of the spin population resides in Cu 4p orbitals. Time-dependent DFT (TDDFT) calculations of the Cu K-edge XAS are in accord with this result (Figure S4).
Table 7.
Löwdin spin populations (%) of Cu and inner-sphere ligand atoms in QM/MM optimized C112D, C112D/M121L,F and WT azurins.a
| C112D | C112D/M121L | C112D/M121F | Wild-Type | |
|---|---|---|---|---|
| Cu (d) | 67.0 | 61.5 | 66.0 | 50.8 |
| Cu (p) | ~ 0 | 2.8 | 2.1 | ~0 |
| S (M121) | 1.8 | N/A | N/A | ~0 |
| S (C112) | N/A | N/A | N/A | 36.3 |
| Oε1 (D112) | 10.2 | 10.8 | 15.0 | N/A |
| Oε2 (D112) | 9.1 | ~0 | ~0 | N/A |
| Nδ1 (H46) | 7.1 | 5.1 | 4.7 | 4.0 |
| Nδ1 (H117) | 5.5 | 1.3 | 4.0 | 5.7 |
N/A: not applicable
The remaining 33% of the unpaired spin in C112D is primarily accounted for by summing the spin population over the coordinating atoms. This is not the case for type zero proteins. Summing spin populations over Cu and the directly coordinated atoms yields 81.5% of the unpaired spin for C112D/M121L and 91.8% of the unpaired spin for C112D/M121F.
Validation of these spin distributions is afforded by comparison of calculated ligand hyperfine constants to experimental data (Table 8). 13C and 14N hyperfine values for C112D and C112D/M121L,F azurin have recently been measured by Goldfarb and coworkers using pulsed W-band EPR techniques.50 Messerschmidt and coworkers have reported 13C/14N values for WT azurin.51 The agreement between theory and experiment is generally quite good, although some values are underestimated for the C112D/M121L protein. Notably, there is considerably more delocalization onto the D112 sidechain in type zero proteins relative to type 2 C112D azurin.
Table 8.
Isotropic hgand hypernne coupling constants (in MHz).
| C112D (QM/MM) |
C112D (Exp) |
C112D/M121L (QM/MM) |
C112D/M121L (Exp) |
C112D/M121F (QM/MM) |
C112D/M121F (Exp) |
Wild-Type (QM/MM) |
Wild-Type (Exp) |
|
|---|---|---|---|---|---|---|---|---|
| 13C | ||||||||
| 112 Cγ | −5.64 | 5.8 ± 0.4a | 6.9 | 9 ± 1a | −9 | 9 ± 1a | - | - |
| 112 Cß | −1.29 | ND | 4.4 | ND | 5.9 | ND | −8.2 | ND |
|
| ||||||||
| 14N | ||||||||
| H46 Nδ | 37 | 36.9 ± 0.8a | 22 | 27 ± 1a | 19.9 | 20 ± 0.5a | 19.8 | 18.1b |
| H46 Nε | 1.81 | 1.8a | 1.74 | 1.8–1.9a | 1.58 | 1.3–1.4a | 0.83 | 0.87b |
| H117 Nδ | 26.3 | 27.9 ± 0.8a | 3.15 | 18.5 ± 1a | 17 | 20 ± 0.5a | 27.2 | 25.1b |
| H117 Nε | 1.35 | 1.5a | 0.54 | 1.4–1.6a | 1.7 | 1.7–1.9a | 1.37 | 1.3b |
|
| ||||||||
| 1H | ||||||||
| D112 Hß1 | 5.45 | ND | −1.3 | 1.8 | −1.7 | 2.1 | 26.25 | 28/27c,d |
| D112 Hß2 | −0.56 | ND | −1.2 | 1.8 | −0.8 | 2.1 | 23.36 | 28/27c,d |
| H46 Hε2 | 1.47 | ND | 1.5 | 1.7/1.1d | 1.34 | 1.7/1.3d | 0.58 | 0.56c |
| H46 Hε1 | 1.46 | ND | 1.33 | ND | 1.25 | ND | 1.03 | 1.1/1.5c,d |
| H46 Hδ2 | 1.8 | ND | 0.25 | 0.7d | 0.0857 | 0.6d | 1.18 | 1.5c |
| H117 Hε2 | 0.89 | ND | 0.6 | 1.7/1.1d | 1.52 | 1.7/1.3d | 1.06 | ND |
| H117 Hε1 | 1.41 | ND | −0.0149 | ND | 0.0046 | ND | 1.33 | 1.5/1.0c,d |
| H117 Hδ2 | 1.52 | ND | −0.4554 | 0.7d | 1.86 | 0.6d | 1.14 | 1.6c |
Spectroscopy-oriented configuration interaction (SORCI) calculations further distinguish the electronic structure of C112D from that of type zero sites (Table 9). The agreement between calculated and experimental excitation energies is reasonably good with deviations between calculated vertical excitation energies and experimental band maxima on the order of 1000–2000 cm−1. Given all uncertainties in the experimental determination of the true vertical transition energy this is the type of agreement that good theoretical calculations typically are able to achieve.
Table 9.
SORCI + SOC calculated excited states (in cm−1).
| Excitation | C112Da | Exp. | C112D/M121Lb | Exp. | C112D/M121Fb | Exp. |
|---|---|---|---|---|---|---|
| ψxy → ψx2−y2 | 11780 | ND | 2440 | ND | 1520 | ND |
| ψz2 → ψx2−y2 | 12420 | ND | 5590 | ND | 5810 | ND |
| ψxz/yz → ψx2−y2 | 13940 | 12,200 | 7910 | 9200 | 7760 | 9,200 |
| ψxz/yz → ψx2−y2 | 15280 | 14,300 | 9030 | 12,500 | 8590 | 12,500 |
Bidentate structure.
Monodentate structure.
Ligand field excited states in the type 2 C112D protein are calculated to be higher in energy relative to those of the type zero C112D/M121L/F proteins. The calculated excitation energies appear to be slightly overestimated, while in type zero proteins they are slightly underestimated. The appearance of hyperfine-shifted signals in the NMR spectra of type zero proteins is in agreement with the prediction of low-lying (≤ 5000 cm−1) excited states. The lack of such signals in the C112D NMR spectrum accords with the higher energy excitations calculated for C112D azurin; and calculated MCD spectra (5 K, 7 T) agree qualitatively with experiment (Figure S5).
As described in original publication, the final step in the SORCI calculations is performed using approximate average natural orbitals (AANOs). These AANOs can be analyzed to visualize the excitation processes and assign the calculated transitions (Figure 5). As predicted by their EPR spectra, C112D and C112D/M121L,F azurins have electronic ground states where the singly occupied MO is ψx2−y2 In C112D azurin, this MO is of σ* character with respect to all four ligands in the equatorial plane. In type zero proteins, the SOMO (which we will take as ψx2−y2) is rotated such that Cu-N overlap is attenuated; predominantly Cu-O(D112) σ* character remains. This dramatic difference in the nature of the SOMO in the ground state plausibly explains the dramatically lower excitation energies when comparing type zero to type 2 sites. Moreover, it affords a mechanism consistent with the measured decrease in 14N hyperfine couplings on going from type 2 to type zero proteins. The ability of the type 0 copper site to delocalize over D112 remains and accounts for the observed anisotropic site covalency.
Figure 5.
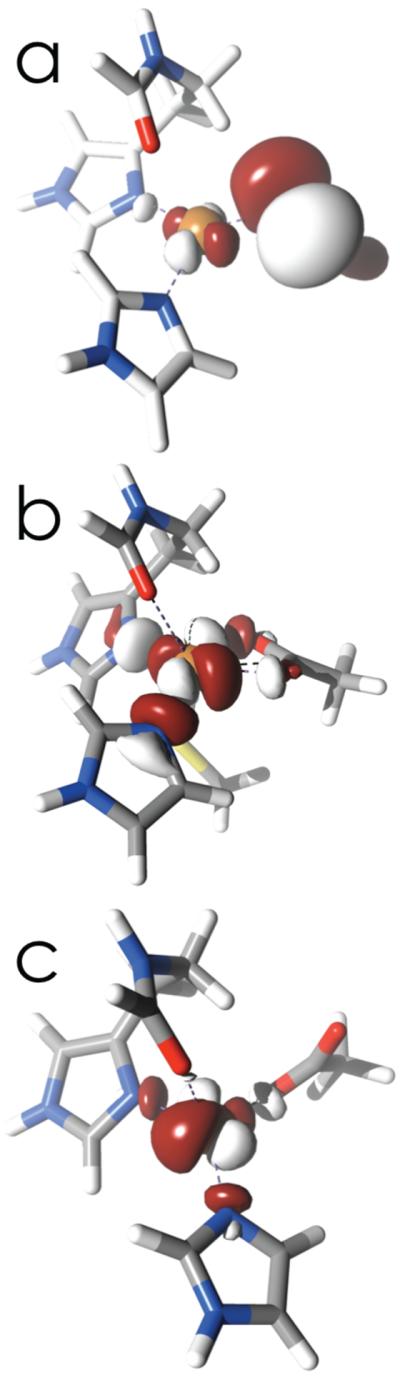
AANOs representing SOMOs of wild-type (a), C112D (b), and C112D/M121L (c) azurins.
This behavior is remarkably similar to the coupled distortion giving rise to the “green” type 1 site in nitrite reductases.52 Aside from dramatically attenuated S-Cu covalency, the SOMO of the C112D azurin is similar to wild-type (Figure 5). The two O-Cu σ interactions together are topologically equivalent to the S-Cu π interaction. In the type zero situation, the Cu-O(G45) distance shortens and the D112 carboxylate rotates by ~ 90°. In turn the SOMO rotates, allowing for but a single O-Cu σ interaction, symmetrically equivalent to the Cu-S σ interaction characteristic of “yellow” copper sites.
Quantizing about an axis in which the z-axis is taken as approximately the Cu-O(G45) vector and the x-axis as a bound Cu-O(D112) vector, the first excited states in C112D and C112D/M121L,F azurins feature predominantly ψxy SOMOs, while the next excited states have ψz2-based SOMOs. The two highest-lying states comprise SOMOs exhibiting substantial mixing between ψxz,yz orbitals. Thus in terms both of energetics and orbital ordering, the type zero ligand field is remarkably similar to that of type 1 copper, except that the ψx,y and ψz2 ordering is inverted.
Discussion
Electronic Structure of Type Zero Copper
A clearer picture of the electronic structure of type zero copper proteins has emerged from analysis of the combined spectroscopic and computational data. The MCD spectra show that type 1 and type zero coppers experience very similar ligand fields. Unfortunately, our MCD spectrometer was not able to monitor the two LF transitions below 9000 cm−1. However, paramagnetically shifted resonances in the NMR spectra of the C112D/M121L and C112D/M121F proteins reveal the presence of a low-lying excited state in type zero copper porteins, as reported for type 1 centers.46 No resonances were observed outside of the diamagnetic envelope in the C112D NMR spectrum, indicating that the lowest LF excitation is shifted to higher energy for this protein, which in turn is consistent with a slightly distorted square-planar CuII. Our mutireference ab initio SORCI calculations support this interpretation.
Within the LF framework for calculation of spin Hamiltonian parameters, the larger gz values for type zero proteins relative to C112D are readily explained by these lower LF excitation energies. However, the significant differences in Rg require more discussion. The MCD spectra reveal that ψxz,yz degeneracy is broken in the type zero proteins, immediately providing a mechanism for non-zero Rg. However, the two type zero proteins exhibit substantially different rhombicities. The ψxz,yz → ψx2−y2 excitation in each of the two type zero proteins has the same energy. Additionally, Cu-N(His) couplings are approximately equal. Together, these observations rule out differences in covalency along the x- and y- axes as the mechanism for different anisotropies in gx,y. Notably, the greater rhombicity of C112D/M121L relative to C112D/M121F arises because of both a smaller gx and a larger gy. Returning to Eqs. 7a and 7b, such a phenomenon is consistent with increased 3dz2 admixture into the ψx2−y2 SOMO. Note that dz2 mixing has previously been proposed as a mechanism for rhombicity in mononuclear copper sites.7 The EPR spectrum of the tetrahedral type 1 copper in stellacyanin features substantial Rg relative to that of plastocyanin and WT azurin. Here, strong interaction is observed between Cu and the axial glutamine.53 In type zero proteins, the Cu site adopts a pseudo-tetrahedral geometry due to the influence of the axial carbonyl from G45, resulting in a weakened ligand field relative to that of C112D azurin with its associated low excitation energies. These smaller energetic separations also promote 3dz2 admixture into the ψx2−y2 SOMO, giving rise to Rg> 0. Following Solomon,7 we estimate 1.6% dz2 (ß = 0.016) character in ψx2−y2 for C112D/M121L, and 0.6% dz2 character in ψx2−y2 (ß = 0.0057) for the C112D/M121F protein.
The 300 MHz Az in the type zero EPR spectrum arises due to multiple factors. The orbital dipolar contributions (PdΔgz, eq. 8c) to Az for C112D and C112D/M121L are 366 and 455 MHz, respectively. The 89 MHz difference in orbital dipolar contributions is insufficient to account for the 168 MHz difference between the Az values for these two proteins. DFT calculations indicate ~3% 4p character in the type zero SOMO, a result in accord with XAS data. This amount of 4p character can add or subtract ~30 MHz from the spin dipolar term (, eq. 8c), depending on whether the admixture comes from 4px,y or 4pz. Thus, 4p mixing cannot account for the residual discrepancy regardless of type. Solomon and coworkers have shown that the dominant effect leading to low Az values in type 1 copper proteins is attenuation of the spin-dipolar term by substantial delocalization of the unpaired electron over the C112 thiolate.6 Observation of substantial hyperfine coupling to Cß and the ßCH of D112 in type zero azurins indicates significant delocalization of the unpaired spin over this carboxylate ligand. DFT hyperfine calculations indicate smaller AzSD contributions in the type zero proteins relative to type 2. Predictably, the type zero AzSD contributions are larger than in type 1. The Fermi contact contributions are also calculated to be smaller in the type 1 and type zero proteins than for type 2. Thus, the weak type zero ligand field only accounts in part for the lower Az relative to C112D azurin. A ~80 MHz contribution also comes from delocalization of the unpaired spin over D112, which shrinks AzFC and AzSD.
Calculations are able to reproduce the spectroscopic features of C112D and C112D/M121L,F azurins with acceptable errors. However, the results are strongly dependent on the orientation of the D112 carboxylate. In bidentate coordination, the resulting electronic structure leads to calculated spectroscopic features that are in accord with experiment for C112D, but are grossly divergent with those observed for type zero copper sites. On the other hand, with monodentate D112 coordination, we are able to explain the spectroscopic properties of the C112D/M121L and C112D/M121F proteins. Clearly, the orientation of this residue tunes the electronic structure of a His-His-Asp copper binding site. Energetically, bidentate coordination is favored for C112D, while the opposite holds for type zero proteins. Here the rack is likely to be a contributing factor – an intact N47-D112-F114 hydrogen-bonding network confers enthalpic stabilization to the active site structure. Estimates for N-H•••O hydrogen bonding stabilization indicate that as much as 16 kJ/mol could be provided by the rack network.54 Solomon and coworkers have reported a corresponding CuII-thioether stabilization of 19 kJ/mol for the type 1 copper site of nitrite reductase.55 Thus, under the reasonable assumption that entropy differences between rack-bound/thioether-unbound and rack-unbound/thioether-bound configurations are negligible, enthalpic differences between type 2 and type zero azurins are controlled by residue 121. The balance must be delicate: in this model, the combined entropy reduction of coordination at M121 with a restored rack is enough to offset the enthalpic stabilization of M121 coordination.
ET Reactivity
We previously demonstrated that outer-sphere coordination tunes the reactivity of type zero copper sites by imposing geometric constraints during redox cycling, in turn leading to low reorganization energies.12 We have now shown that outer-sphere coordination defines the electronic structure of the site, with further consequences for ET reactivity. In our study of the ET properties of type zero copper, we were unable to adequately explain the slower ET between the C3/C26 disulfide and the copper center in C112D/M121L azurin as compared to C112D. The rates of ET from C3/C26 RSSR− to CuII at 298 K are 44 s−1 (wild-type)56, 61 s−1 (C112D/M121L), and 123 s−1 (C112D).12 The values of λ go as wild type ≲ C112D/M121L << C112D. On the basis of reorganization energy only, then, the opposite trend is expected. Our present study indicates slightly decreased coupling between Cu and the histidines ligands in type zero copper. More importantly, we have demonstrated via NMR spectroscopy that substantial unpaired spin is delocalized over D112, suggestive of stronger coupling between this residue and Cu, which introduces the possibility of ET pathway interference.8
In general, multiple (equally weighted) pathways will decrease donor-acceptor coupling. In C112D, the main route for electron transfer from C3/C26 RSSR− to Cu likely proceeds through H46, whereas in wild-type azurin, the strong coupling between Cu and C112 opens a second pathway.8, 57 This second pathway might introduce interference, leading to observed the 3-fold reduction in the RSSR− -> CuII ET rate between wild-type and C112D azurin.12 In C112D/M121L azurin, the shift of unpaired spin from H46/H117 toward D112 could restore some weight to this pathway. The weight of the Cu-112 interaction cannot be as large as in WT azurin, in accord with our analysis of the spin-Hamiltonian parameters (vide supra).
In the type zero proteins, the enhanced delocalization along D112 beyond the bound oxygen atom could arise because of favorable superexchange along the 112 sidechain, as has been previously suggested for type 1 proteins.58 A qualitative estimate of the magnitude of this superexchange may be afforded by inspecting sidechain coplanarity. Such variations in linker conformation are known to profoundly affect donor-acceptor electronic coupling.59 In type 1 proteins, the S-Cß-Cα-N dihedrals are ~ 0°. Along D112, the analogous superexchange path involves the O-Cγ-Cß-Cα dihedral. For C112D azurin, this dihedral is 40°; for C112D/M121L it is 7°. The principal difference is the rotation about Cγ enforced by the rack. Thus, the rack could enhance electronic coupling between residue 112 and Cu in type zero proteins in a way that is similar to type 1 centers. A systematic study correlating donor-acceptor coupling in copper proteins to amino acid dihedrals would further assess the importance of outer-sphere control over ET reactivity.
Conclusions
Through a combination of spectroscopic and computational investigations we have demonstrated that type zero copper possesses many hallmarks of a “hard-ligand” type 1 site. MCD and NMR spectra indicate very similar ligand fields in type zero and type 1 proteins. The final observed Az values for type zero copper centers are small because the low-lying excited states lead to large g-shifts that in turn impart large orbital dipolar contributions to the metal hyperfine coupling that can not be “overridden” by the covalently damped spin-dipolar contributions. QM/MM calculations suggest that the electronic structures and ET reactivities of type 1 and type zero sites are highly dependent on the orientation of sidechain 112. This orientation is, in turn, controlled by the N47/F114 hydrogen bond network in both proteins. Thus, outer-sphere coordination not only is responsible for the observed low λ values, but also profoundly affects the spectroscopic properties of these active sites, as well as their electronic coupling to the protein matrix.
Supplementary Material
Figure 6.

SORCI calculated excited states for C112D, C112D/M121L, C112D/M121F, and wild-type azurins. States are labeled by the AANOs that predominantly represent the location of the unpaired electron. States that are heavily mixed by configuration interaction are indicated by boxes surrounding relevant singly occupied MOs.
Acknowledgements
We thank Eckhard Bill and Andreas Göbels for assistance with MCD data collection. The NMR spectrometer in Rosario was purchased with funds from ANPCyT and CONICET. AJV thanks ANPCyT for funding (PICT 2007-0314). AJV is staff member of CONICET and an HHMI International Scholar, and MEZ is recipient of a doctoral fellowship from CONICET. MS was supported by Alexander von Humboldt and K.S. Krishnan Research Associateship fellowships for funding. Financial support of this work by the SFB 624 (`Template Effects') and the Max-Planck-Society is also gratefully acknowledged. KML, JHR, and HBG were supported by NIH DK019038 and Stanford GCEP.
Footnotes
Supporting Information Available: EPR experimental conditions, QM/MM partitioning, MCD spectra, QM/MM site geometries, XAS data, calculated MCD spectra, and all input coordinates. This material is available free of charge via the internet at http://www.pubs.acs.org.
References
- 1.Augustin MA, Yandell JK. Inorg. Chem. 1979;18:577–583. [Google Scholar]
- 2.Di Bilio AJ, Hill MG, Bonander N, Karlsson BG, Villahermosa RM, Malmstrom BG, Winkler JR, Gray HB. J. Am. Chem. Soc. 1997;119:9921–9922. [Google Scholar]
- 3.(a) Colman PM, Freeman HC, Guss JM, Murata M, Norris VA, Ramshaw JAM, Venkatappa MP. Nature. 1978;272:319–324. [Google Scholar]; (b) Nar H, Messerschmidt A, Huber R, Vandekamp M, Canters GW. J. Mol. Biol. 1991;221:765–772. doi: 10.1016/0022-2836(91)80173-r. [DOI] [PubMed] [Google Scholar]; (c) Andrew CR, Sanders-Loehr J. Acc. Chem. Res. 1996;29:365–372. [Google Scholar]; (d) Solomon EI. Inorg. Chem. 2006;45:8012–8025. doi: 10.1021/ic060450d. [DOI] [PubMed] [Google Scholar]; (e) Holwerda RA, Wherland S, Gray HB. Annu. Rev. Biophys. Bio. 1976;5:363–396. doi: 10.1146/annurev.bb.05.060176.002051. [DOI] [PubMed] [Google Scholar]; (f) Farver O, Pecht I. Coord. Chem. Rev. 2011;255:757–773. [Google Scholar]; (g) Gray HB, Winkler JR. Biochim. Biophys. Acta. 2010;1797:1563–1572. doi: 10.1016/j.bbabio.2010.05.001. [DOI] [PubMed] [Google Scholar]
- 4.(a) Yanagisawa S, Banfield MJ, Dennison C. Biochemistry-Us. 2006;45:8812–8822. doi: 10.1021/bi0606851. [DOI] [PubMed] [Google Scholar]; (b) Malmstrom BG. Eur. J. Biochem. 1994;223:711–718. doi: 10.1111/j.1432-1033.1994.tb19044.x. [DOI] [PubMed] [Google Scholar]
- 5.(a) Solomon EI, Hare JW, Dooley DM, Dawson JH, Stephens PJ, Gray HB. J. Am. Chem. Soc. 1980;102:168–178. [Google Scholar]; (b) Solomon EI, Hare JW, Gray HB. Proc. Natl. Acad. Sci. USA. 1976;73:1389–1393. doi: 10.1073/pnas.73.5.1389. [DOI] [PMC free article] [PubMed] [Google Scholar]
- 6.(a) George SJ, Lowery MD, Solomon EI, Cramer SP. J. Am. Chem. Soc. 1993;115:2968–2969. [Google Scholar]; (b) Shadle SE, Pennerhahn JE, Schugar HJ, Hedman B, Hodgson KO, Solomon EI. J. Am. Chem. Soc. 1993;115:767–776. [Google Scholar]
- 7.Gewirth AA, Cohen SL, Schugar HJ, Solomon EI. Inorg. Chem. 1987;26:1133–1146. [Google Scholar]
- 8.Regan JJ, Dibilio AJ, Langen R, Skov LK, Winkler JR, Gray HB, Onuchic JN. Chem. Biol. 1995;2:489–496. doi: 10.1016/1074-5521(95)90266-x. [DOI] [PubMed] [Google Scholar]
- 9.(a) Kosman D. J. Biol. Inorg. Chem. 2010;15:15–28. doi: 10.1007/s00775-009-0590-9. [DOI] [PubMed] [Google Scholar]; (b) Solomon EI, Augustine AJ, Yoon J. Dalton Trans. 2008:3921–3932. doi: 10.1039/b800799c. [DOI] [PMC free article] [PubMed] [Google Scholar]; (c) Solomon EI, Sundaram UM, Machonkin TE. Chem. Rev. 1996;96:2563–2606. doi: 10.1021/cr950046o. [DOI] [PubMed] [Google Scholar]
- 10.Lancaster KM, Yokoyama K, Richards JH, Winkler JR, Gray HB. Inorg. Chem. 2009;48:1278–1280. doi: 10.1021/ic802322e. [DOI] [PMC free article] [PubMed] [Google Scholar]
- 11.Lancaster KM, George SD, Yokoyama K, Richards JH, Gray HB. Nature Chem. 2009;1:711–715. doi: 10.1038/nchem.412. [DOI] [PMC free article] [PubMed] [Google Scholar]
- 12.Lancaster KM, Farver O, Wherland S, Crane EJ, Richards JH, Pecht I, Gray HB. J. Am. Chem. Soc. 2011;133:4865–4873. doi: 10.1021/ja1093919. [DOI] [PMC free article] [PubMed] [Google Scholar]
- 13.Hitchman MA, Olson CD, Belford RL. J. Chem. Phys. 1969;50:1195–1203. [Google Scholar]
- 14.Bondon A, Mouro C. J. Magn. Reson. 1998;134:154–157. doi: 10.1006/jmre.1998.1523. [DOI] [PubMed] [Google Scholar]
- 15.Banci L, Bertini I, Luchinat C, Piccioli M, Scozzafava A, Turano P. Inorg. Chem. 1989;28:4650–4656. [Google Scholar]
- 16.Mcconnell HM, Chesnut DB. J. Chem. Phys. 1958;28:107–117. [Google Scholar]
- 17.Bertini I, Luchinat C. NMR of Paramagnetic Substances. Elsevier; Amsterdam: 1996. [Google Scholar]
- 18.Neese F, Becker U, Ganyushin D, Liakos DG, Kossmann S, Petrenko T, Riplinger C, Wennmohs F. ORCA, 2.7.0. University of Bonn; Bonn: 2009. [Google Scholar]
- 19.(a) Berendsen HJC, van der Spoel D, van Drunen R. Comput. Phys. Commun. 1995;91:43–56. [Google Scholar]; (b) Van Der Spoel D, Lindahl E, Hess B, Groenhof G, Mark AE, Berendsen HJC. J. Comput. Chem. 2005;26:1701–1718. doi: 10.1002/jcc.20291. [DOI] [PubMed] [Google Scholar]; (c) Lindahl E, Hess B, van der Spoel D. J. Mol. Model. 2001;7:306–317. [Google Scholar]; (d) Hess B, Kutzner C, van der Spoel D, Lindahl E. J. Chem. Theory Comput. 2008;4:435–447. doi: 10.1021/ct700301q. [DOI] [PubMed] [Google Scholar]
- 20.(a) Becke AD. Phys. Rev. A. 1988;38:3098–3100. doi: 10.1103/physreva.38.3098. [DOI] [PubMed] [Google Scholar]; (b) Perdew JP, Yue W. Phys. Rev. B. 1986;33:8800–8802. doi: 10.1103/physrevb.33.8800. [DOI] [PubMed] [Google Scholar]
- 21.(a) Weigend F, Ahlrichs R. Phys. Chem. Chem. Phys. 2005;7:3297–3305. doi: 10.1039/b508541a. [DOI] [PubMed] [Google Scholar]; (b) Pantazis DA, Chen X-Y, Landis CR, Neese F. J. Chem. Theory Comput. 2008;4:908–919. doi: 10.1021/ct800047t. [DOI] [PubMed] [Google Scholar]
- 22.(a) van Lenthe E, van der Avoird A, Wormer PES. J. Chem. Phys. 1998;108:4783–4796. [Google Scholar]; (b) van Wullen C. J. Chem. Phys. 1998;109:392–399. [Google Scholar]
- 23.(a) Becke AD. J. Chem. Phys. 1993;98:1372–1377. [Google Scholar]; (b) Lee CT, Yang WT, Parr RG. Phys. Rev. B. 1988;37:785–789. doi: 10.1103/physrevb.37.785. [DOI] [PubMed] [Google Scholar]; (c) Stephens PJ, Devlin FJ, Chabalowski CF, Frisch MJ. J. Phys. Chem. 1994;98:11623–11627. [Google Scholar]
- 24.(a) Neese F. Inorg. Chim. Acta. 2002;337:181–192. [Google Scholar]; (b) Sinnecker S, Slep LD, Bill E, Neese F. Inorg. Chem. 2005;44:2245–2254. doi: 10.1021/ic048609e. [DOI] [PubMed] [Google Scholar]
- 25.Barone V. In: Recent Advances in Density Functional Methods, Part I. Chong DP, editor. World Scientific; Singapore: 1996. [Google Scholar]
- 26.Kutzelnigg W, Fleischer U, Schindler M. NMR Basic Princ. Progr. 1990;23:165–262. [Google Scholar]
- 27.Neese F. J. Chem. Phys. 2001;115:11080–11096. [Google Scholar]
- 28.Neese F. J. Chem. Phys. 2005;122:034107/1–13. doi: 10.1063/1.1829047. [DOI] [PubMed] [Google Scholar]
- 29.Neese F. J. Chem. Phys. 2003;118:3939–3948. [Google Scholar]
- 30.DeBeer George S, Petrenko T, Neese F. J. Phys. Chem. A. 2008;112:12936–12943. doi: 10.1021/jp803174m. [DOI] [PubMed] [Google Scholar]
- 31.Neese F. J. Chem. Phys. 2003;119:9428–9443. [Google Scholar]
- 32.Neese F. Magn. Reson. Chem. 2004;42:S187–S198. doi: 10.1002/mrc.1456. [DOI] [PubMed] [Google Scholar]
- 33.Neese F. J. Am. Chem. Soc. 2006;128:10213–10222. doi: 10.1021/ja061798a. [DOI] [PubMed] [Google Scholar]
- 34.Pipek J, Mezey PG. J. Chem. Phys. 1989;90:4916–4926. [Google Scholar]
- 35.McGarvey BR. J. Phys. Chem. 1967;71:51–66. [Google Scholar]
- 36.(a) Munzarová M, Kaupp M. J. Phys. Chem. A. 1999;103:9966–9983. [Google Scholar]; (b) Munzarová ML, Kubácek P, Kaupp M. J. Am. Chem. Soc. 2000;122:11900–11913. [Google Scholar]
- 37.Neese F, Solomon EI. Interpretation and Calculation of Spin-Hamiltonian Parameters in Transition Metal Complexes. In: Miller JS, Drillon M, editors. Magnetism: Molecules to Materials IV. Wiley-VCH; Weinheim: 2003. pp. 345–466. [Google Scholar]
- 38.(a) Smith DW. J. Chem. Soc. A. 1970:3108–&. [Google Scholar]; (b) Ammeter J. Chimia. 1968;22:469–&. [Google Scholar]; (c) Ammeter J, Gunthard HH. J. Chem. Phys. 1972;57:3852–&. [Google Scholar]; (d) Kuska HA, Rogers MT. In: Spectroscopy in Inorganic Chemistry. Rao CNR, Ferraro JR, editors. Vol. 2. Academic Press; New York: 1971. p. 175. [Google Scholar]
- 39.Sharnoff M. J. Chem. Phys. 1964;41:2203. [Google Scholar]
- 40.Coremans JWA, Poluektov OG, Groenen EJJ, Canters GW, Nar H, Messerschmidt A. J. Am. Chem. Soc. 1994;116:3098–3101. [Google Scholar]
- 41.Antholine WE, Hanna PM, McMillin DR. Biophys. J. 1993;64:267–272. doi: 10.1016/S0006-3495(93)81363-8. [DOI] [PMC free article] [PubMed] [Google Scholar]
- 42.Gewirth AA, Solomon EI. J. Am. Chem. Soc. 1988;110:3811–3819. [Google Scholar]
- 43.Mizoguchi TJ, Di Bilio Angel J., Gray Harry B., Richards John H. J. Am. Chem. Soc. 1992;114:10076–10078. [Google Scholar]
- 44.Dick A, Rahemi H, Krausz ER, Hanson GR, Riley MJ. J. Chem. Phys. 2008;129:2145051–2145058. doi: 10.1063/1.3033367. [DOI] [PubMed] [Google Scholar]
- 45.Kroes SJ, Salgado J, Parigi G, Luchinat C, Canters GW. Journal of Biological Inorg. Chem. 1996;1:551–559. [Google Scholar]
- 46.Bertini I, Fernández CO, Karlsson B. G. r., Leckner J, Luchinat C, Malmström BG, Nersissian AM, Pierattelli R, Shipp E, Valentine JS, Vila AJ. J. Am. Chem. Soc. 2000;122:3701–3707. [Google Scholar]
- 47.(a) Neese F. J. Biol. Inorg. Chem. 2006;11:702–711. doi: 10.1007/s00775-006-0138-1. [DOI] [PubMed] [Google Scholar]; (b) Neese F. Prediction of electron paramagnetic resonance g values using coupled perturbed Hartree?Fock and Kohn?Sham theory. Vol. 115. AIP; 2001. pp. 11080–11096. [Google Scholar]
- 48.Sinnecker S, Neese F. J. Comput. Chem. 2006;27:1463–1475. doi: 10.1002/jcc.20426. [DOI] [PubMed] [Google Scholar]
- 49.Guss JM, Bartunik HD, Freeman HC. Acta Cryst. B. 1992;48:790–811. doi: 10.1107/s0108768192004270. [DOI] [PubMed] [Google Scholar]
- 50.Potapov A, Lancaster KM, Richards JH, Gray HB, Goldfarb D. Inorg. Chem. 2012;51:4066–4075. doi: 10.1021/ic202336m. [DOI] [PMC free article] [PubMed] [Google Scholar]
- 51.Coremans JWA, Poluektov OG, Groenen EJJ, Canters GW, Nar H, Messerschmidt A. J. Am. Chem. Soc. 1997;119:4726–4731. [Google Scholar]
- 52.LaCroix LB, Shadle SE, Wang Y, Averill BA, Hedman B, Hodgson KO, Solomon EI. J. Am. Chem. Soc. 1996;118:7755–7768. [Google Scholar]
- 53.Hart PJ, Eisenberg D, Nersissian AM, Valentine JS, Herrmann RG, Nalbandyan RM. Protein Sci. 1996;5:2175–2183. doi: 10.1002/pro.5560051104. [DOI] [PMC free article] [PubMed] [Google Scholar]
- 54.Wendler K, Thar J, Zahn S, Kirchner B. J Phys. Chem. A. 2010;114:9529–9536. doi: 10.1021/jp103470e. [DOI] [PubMed] [Google Scholar]
- 55.Ghosh S, Xie X, Dey A, Sun Y, Scholes CP, Solomon EI. Proc. Natl. Acad. Sci. USA. 2009;106:4969–4974. doi: 10.1073/pnas.0900995106. [DOI] [PMC free article] [PubMed] [Google Scholar]
- 56.Farver O, Pecht I. Proc. Natl. Acad. Sci. USA. 1989;86:6968–6972. doi: 10.1073/pnas.86.18.6968. [DOI] [PMC free article] [PubMed] [Google Scholar]
- 57.Solomon E, Lowery M. Science. 1993;259:1575–1581. doi: 10.1126/science.8384374. [DOI] [PubMed] [Google Scholar]
- 58.Han J, Adman ET, Beppu T, Codd R, Freeman HC, Huq L, Loehr TM, Sanders-Loehr J. Biochemistry. 1991;30:10904–10913. doi: 10.1021/bi00109a014. [DOI] [PubMed] [Google Scholar]
- 59.(a) Issa JB, Krogh-Jespersen K, Isied SS. J. Phys. Chem. C. 2010;114:20809–20812. [Google Scholar]; (b) Sachs SB, Dudek SP, Hsung RP, Sita LR, Smalley JF, Newton MD, Feldberg SW, Chidsey CED. J. Am. Chem. Soc. 1997;119:10563–10564. [Google Scholar]
Associated Data
This section collects any data citations, data availability statements, or supplementary materials included in this article.