Abstract
Skeletal muscle exhibits broad functional diversity, despite its inherent length and velocity constraints. The observed variation in morphology and physiology is assumed to have evolved to allow muscle to operate at its optimal length and velocity during locomotion. Here, we used the variation in optimum lengths and velocities that occurs with muscle activation level to experimentally test this assumption. Muscle ergometry and sonomicrometry were used to characterize force–length and power–velocity relationships, and in vivo operating lengths and velocities, at a range of activation levels. Operating lengths and velocities were mapped onto activation level specific force–length and power–velocity relationships to determine whether they tracked changing optima. Operating velocities decreased in line with decreased optimal velocities, suggesting that optimal velocities are always used. However, operating lengths did not change with changing optima. At high activation levels, fibres used an optimal range of lengths. However, at lower activation levels, fibres appeared to operate on the ascending limb of sub-maximally activated force–length relationships. This suggests that optimal lengths are only used when demand is greatest. This study provides the first mapping of operating lengths to activation level-specific optima, and as such, provides insight into our assumptions about the factors that determine muscle performance during locomotion.
Keywords: force–length, force–velocity, recruitment, locomotion
1. Introduction
Skeletal muscle exhibits broad diversity in function. It provides the mechanical output for everything from running and breathing, to rapid escape responses during swimming, power demanding take-off flight, and complex movements of soft bodies. This diversity in function is achieved despite the use of a common molecular mechanism of force generation, which imposes inherent constraints on performance. The cyclical formation of cross-bridges between the overlapping contractile proteins actin and myosin generates a force that acts to shorten the muscle cell (fibre). The requirement for overlap between actin and myosin results in a force–length relationship where force varies with length, and maximum force is produced at intermediate lengths [1]. The cyclical formation and detachment of cross-bridges results in a force–velocity relationship where force declines with increasing velocity, and maximal power is only generated at intermediate velocities [2,3].
The observed variation in morphology and physiology is thought to underpin muscle's ability to achieve such diverse functions using a common, constrained, mechanism of force generation. Muscles vary in fibre orientation [4–6], connective tissues arrangements [7–9], and intrinsic cross-bridge cycling rates of their fibres [10,11]. For example, fibres are oriented parallel to the long axis of the muscle to function as uniaxial work producers in the bird pectoralis [12]; but perpendicular, parallel and oblique to the long axis to function as a muscular hydrostat in cephalopod tentacles [4]. Fibres terminate in a connective tissue network to accommodate the biaxial loading of the diaphragm during breathing [8] and are arranged in series with long compliant tendons to decouple the rate of joint movement from that of muscle shortening in anuran jumping [9]. Fast fibres, with high cross-bridge cycling rates are thought to be used during escape responses in fish, while slow fibres are used during steady swimming [10]. Such variation in muscle morphology and physiology ultimately broadens the functional range of muscles.
Many studies have also suggested that such variation in morphology and physiology not only allow muscle to achieve a diversity of functions, but also enables it to perform optimally during locomotion [7,10,13–24]. The observed alignment between the operating lengths and velocities used in vivo, and the optimal lengths and velocities for force and power production determined in maximally activated muscle in vitro, supports this assumption. The presence of fast and slow fibres in fish are thought to enable optimal velocities to be used across a range of locomotor modes [10,18]. Similarly, the highly compliant muscle seen in the hindlimbs of jumping anurans is thought to allow muscles to use optimal lengths despite having to undergo large strains [7,23]. However, to the authors' knowledge, no studies have used experimental manipulations of muscle optima to explicitly test this assumption. Here we use the change in optimum lengths and velocities that occurs with activation level [25–28] as an experimental manipulation to determine whether muscles always perform optimally during locomotion.
Muscle activation level is modulated by varying the number of active motor units and motor neuron firing rate [29,30], to meet the mechanical demands of the task being performed. Activation level has been observed to vary as a function of speed during locomotion [31–33], substrate type during feeding [34] and gas composition during breathing [35]. Hence, if muscles always perform optimally, operating lengths and velocities should change with activation level in order to track the changes that occur in optima [25–29]. This study aims to determine the operating lengths and velocities used in vivo at a range of activation levels, and to map these to activation level-specific force–length and power–velocity relationships. If muscles always perform optimally during locomotion, we would predict that operating lengths would increase, and operating velocities decrease, with increasing activation level in order to track activation level-related changes in optima. This study is the first to directly map the in vivo operating lengths and velocities used at a range of activation levels to activation level-specific force–length and power–velocity relationships. As such, it not only provides the first experimental test of the assumption that muscles operate optimally, but will also provide new insight into factors that have shaped muscle function across an animal's performance range.
2. Material and methods
In order to map muscle operating parameters to activation level-specific muscle properties, we varied muscle activation level in vivo and in vitro, in the cane toad plantaris muscle. Operating lengths and velocities were determined in vivo, and force–length and power–velocity relationships characterized in vitro, at a range of these activation levels. Muscle activation level may be defined as the number of active motor units, and the frequency of action potentials they receive. However, as our ability to directly manipulate and quantify this is somewhat limited, we used the best proxy methods available. In vivo, activation level was manipulated by eliciting hops of different distances. Electromyography (EMG) was used to confirm that muscle activity varied with hop distance, and then hop distance used as proxy measure of activation level. In vitro, activation level was manipulated by varying stimulation voltage [27,28,36], and the isometric force produced using a given stimulus, relative to that produced in response to a supra-maximal stimulus, used as a proxy measure of activation level.
The cane toad plantaris provided a suitable system in which to map operating lengths and velocities to activation level-specific optima. These terrestrial toads use repeated hops, of varying distance, as a means of locomotion and the plantaris muscle makes a major contribution to hopping in anurans [37]. Seventeen cane toads (Rhinella marina) were purchased from herpetological vendors. Individuals were housed in small groups in glass terraria, and fed vitamin-enriched crickets bi-weekly. Room temperature was maintained at 25°C.
Seventeen plantaris muscles from 13 cane toads were used to determine the effect of activation level on the force–length and power–velocity relationships in vitro. The plantaris muscle and sciatic nerve were isolated and the muscle instrumented with sonomicrometry transducers (1 mm diameter; Sonometrics Inc., London, Ontario, Canada) to allow measurement of fibre lengths. The distal end of the muscle was connected to an ergometer (310 B-LR, Aurora Scientific Inc., Ontario, Canada) using a custom clamp (force–length experiment) or Kevlar thread (power–velocity experiment). This allowed measurement of muscle force and muscle length. A nerve cuff was placed around the sciatic nerve and the preparation was immersed in oxygenated Ringer's solution at room temperature [28]. The nerve was stimulated (0.2 ms square wave pulses at 100 Hz for 400 ms; Grass S48 stimulator, Grass medical instruments, Quincy, MA, USA) at different voltages to elicit maximal (3 V) and a range of sub-maximal (0.4–1 V) tetanic contractions. Muscle force, and muscle and fibre lengths were logged at 5000 Hz (National Instruments AD board (NI USB-6212); Igor Pro 6.31, Wavemetrics Inc., Lake Oswego, OR, USA). Muscle length, fibre length and muscle mass were measured at the end of each experiment, and peak isometric stress determined from peak isometric force produced in the maximally activated condition [38].
The effect of activation level on the force–length relationship was determined using a series of fixed-end contractions, elicited at a range of lengths, using the above stimulation conditions. Maximum active force and fibre length were determined during each contraction, and peak force (F0) and optimum length (L0) calculated. All data were normalized to maximally activated peak force (F0max) and optimum length (L0max) [28]. The effect of activation level on the power–velocity relationship was determined using a series of after-loaded isotonic contractions. This allowed contractions to be elicited at a range of velocities, using the above stimulation conditions. Force was allowed to rise to a pre-defined level between 0.1 and 0.9 of F0 and the muscle allowed to shorten so as to maintain constant force. Velocity (V in fibre lengths per second [L0max s−1]) was calculated, and a composite force–velocity relationship plotted for all data and a linear-hyperbolic equation fitted [27,39]. The power–velocity relationship was calculated from this. Linear mixed effect models, with individual included as a random factor, were used to determine whether there was an effect of activation level on optimum length and the power–velocity relationship.
Four cane toads were used to determine in vivo operating lengths and velocities. A sub-set of these data [23] and corresponding methods have been published previously [23,40]. Implanted sonomicrometry and fine-wire bipolar electromyography (EMG) electrodes were used to measure fibre length and electrical activity during hops of different distances. Following recovery from implantation, treadmill hopping bouts were elicited, sonomicrometry and EMG data logged at 4000 Hz (National Instruments AD board (NI USB-6212); Igor Pro 6.31, Wavemetrics Inc., Lake Oswego, OR, USA), and the bouts imaged at 400 frames per second (Miro 120 high-speed camera; Vision Research, NJ, USA). Data were synchronized using a common external trigger. The five longest hops, the five shortest hops and the five hops centred on the median value were analysed for each individual. Mean values of integrated EMG activity (normalized to the peak value recorded in that muscle), initial fibre length, final fibre length, average shortening velocity and take-off time [the time from onset of EMG (signal exceeds baseline mean + 2 s.d.) activity to take-off] were determined. Linear mixed effect models, with individual included as a random factor, were used to determine whether there was an effect of hop distance on each of these parameters.
3. Results
The effect of activation level on force–length and power–velocity relationships was determined in vitro in cane toad plantaris muscles, using four different stimulation voltages. The effect of activation level on muscle operating lengths and velocities was determined in cane toads in vivo, using three different hop distances. (Raw in vivo and in vitro force, length, power, and velocity data at a range of activation levels can be found in the electronic supplementary material.) In vivo operating lengths and velocities were mapped to activation level-specific force–length and power–velocity relationships. All data are presented as mean ± s.e.m. The relevant morphological and contractile properties of the animals and muscles used are given in table 1.
Table 1.
Animal and muscle properties.
| animal mass (g) | 114.6 ± 13.7 (n = 17) |
| muscle mass (g) | 0.9 ± 0.1 (n = 21) |
| fibre length (mm) | 14.7 ± 0.4 (n = 21) |
| peak isometric stress (N cm−2)a | 27.5 ± 1.6 (n = 17) |
aPeak isometric stress was determined from peak isometric force produced under maximally activated conditions condition, fibre length and muscle mass.
In vitro, relative forces of 1.0 (n = 11), 0.68 ± 0.05 (n = 6), 0.40 ± 0.02 (n = 7) and 0.20 ± 0.02 (n = 4) were achieved in force–length experiments (figure 1) and 1.0 (n = 6), 0.63 ± 0.02 (n = 5), 0.43 ± 0.03 (n = 4) and 0.14 ± 0.03 (n = 3) in power–velocity experiments (figure 2). There was a significant effect of relative force on both optimum length (p < 0.01; figure 1), and the power–velocity relationship (p < 0.001; figure 2). Optimum length increased with decreasing relative force so that the optimum length (L0) in the lowest relative force condition was 1.3 times longer than the optimum length in the maximal (L0max) condition (figure 1). Maximum power decreased from 129.9 W kg−1 in the maximal condition, to 8.4 W kg−1 in the lowest relative force condition (figure 2). The velocity at which maximum power was produced decreased from 2.2 L0max s−1 in the maximally active condition, to 0.7 L0max s−1 in the lowest relative force condition (figure 2).
Figure 1.
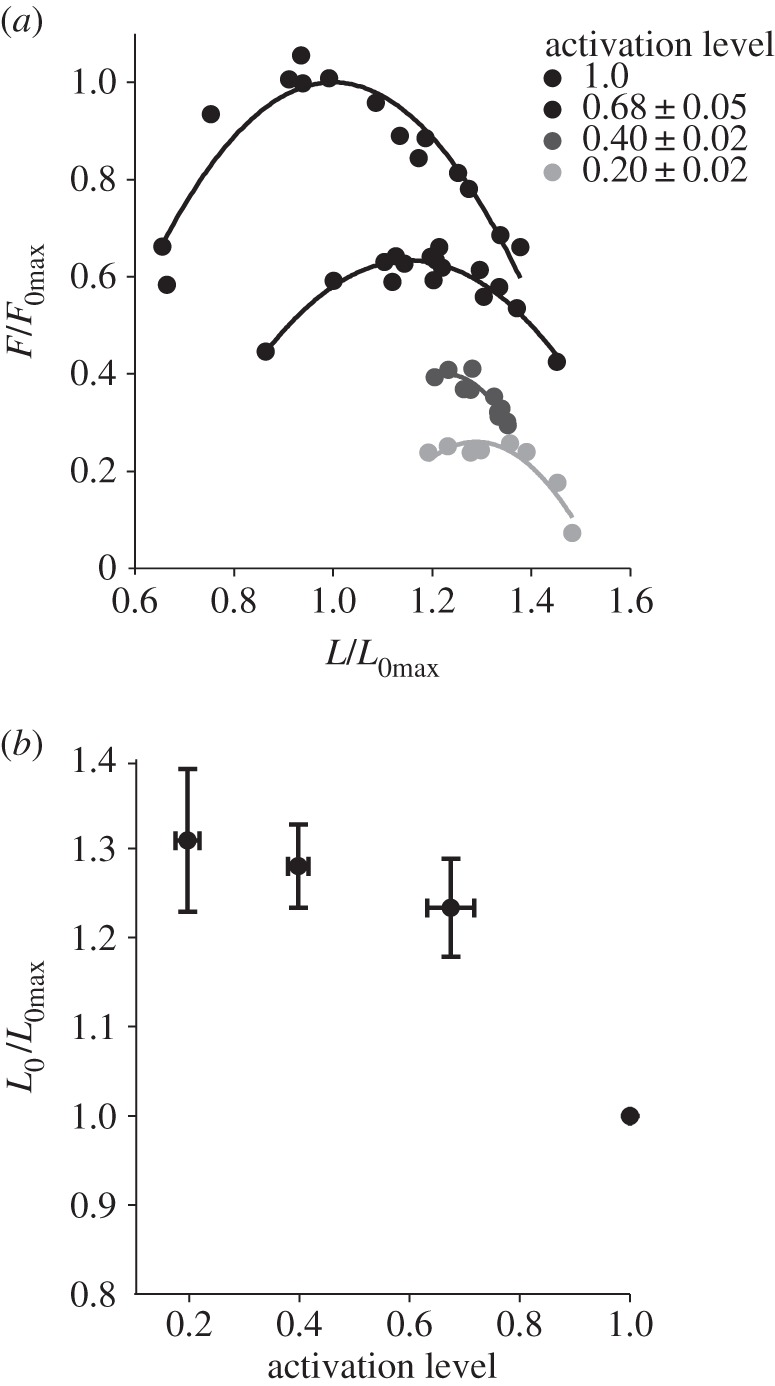
The effect of activation level, on the force–length relationship. Sample force–length curves at all relative force levels are shown (a). From these relationships, optimum length (L0/L0max) and activation level (F0/F0max) were determined for each stimulus condition (b). There was a significant effect of activation level (F0/F0max) on optimum length (p < 0.01) (b). n = 11, 6, 7 and 4.
Figure 2.
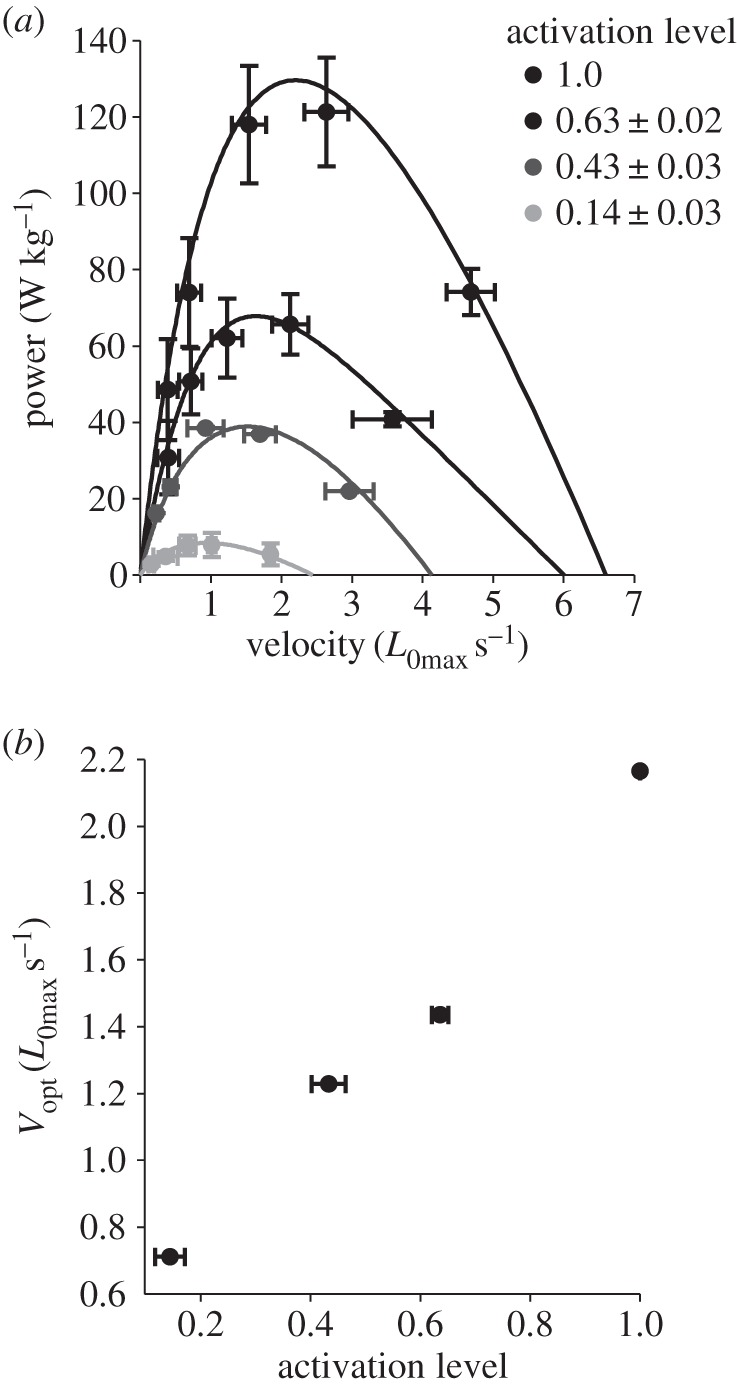
The effect of activation level on the power–velocity relationship. Power–velocity curves at all relative force levels are shown (a). From these relationships, optimal velocity (Vopt) was determined. There is a significant effect of relative force on the power–velocity relationship (p < 0.001) (b); optimal velocity decreased with decreasing activation level (c). n = 6, 5, 4 and 3.
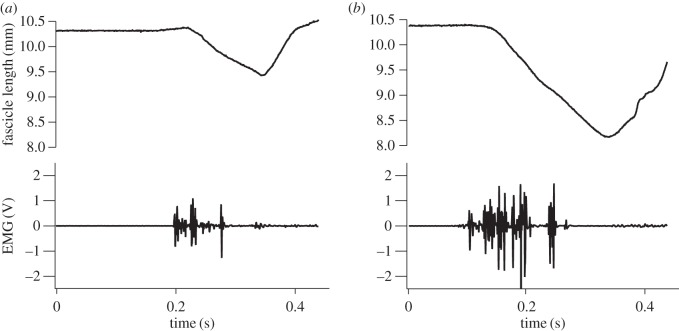
In vivo fibre lengths and EMG were measured during hops of different distances (figure 3). Hop distances of 13.2 ± 0.39 cm to 35.2 ± 0.10 cm were achieved (figure 4). While it was not possible to quantify activation level as directly as during in vitro contractions, there was a significant relationship between hop distance and EMG intensity (p < 0.001; figure 4b), suggesting that hop distance provided a good proxy of activation level. There was a significant effect of hop distance on final (p < 0.001; figure 4c), but not initial length (p = 0.14; figure 4c). Initial length was around 1.14 L0max for all hop distances, while final fibre length increased from 0.89 L0max (n = 4) in the longest hops, to 1.05 L0max (n = 4) in the shortest hops (figure 4c). There was also a significant effect of hop distance on shortening velocity (p < 0.005; figure 4d) with shortening velocity decreasing from 1.7 ± 0.2 L0max s−1 in the longest hops to 0.7 ± 0.03 L0max s−1 in the shortest hops (figure 4d).
Figure 3.
Representative traces of muscle fibre lengths and muscle activation during a short (a) and long (b) hop. Data are shown from the same individual and highlight the increase in fibre length changes and EMG intensity with increasing hop distance.
Figure 4.
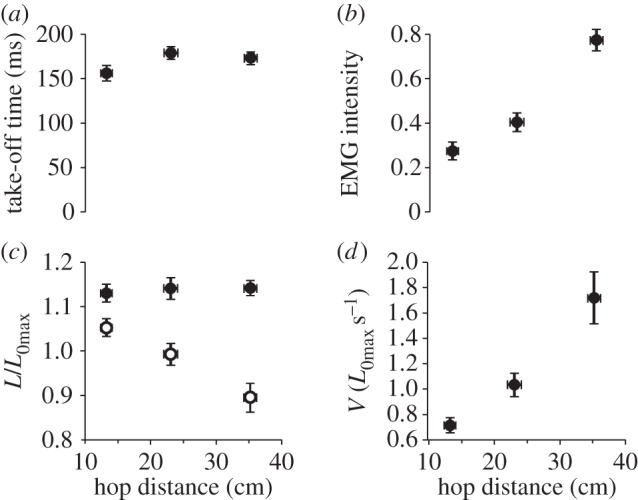
The effect of hop distance on take-off time (a), EMG intensity (b), fibre lengths (c) and fibre velocities (d). There was no effect of hop distance on take-off time, the time from EMG onset to take-off (p = 0.25) (a). EMG intensity increased with increasing hop distance (p < 0.001) (b). There was no effect of hop distance on initial fibre length (p = 0.14) (c; filled circles), however, final fibre length decreased with increasing hop distance (p < 0.001) (c; open circles). Shortening velocity increased with increasing hop distance (p < 0.005) (d).
A comparison of force–length relationships and operating lengths showed that the initial lengths in the longest hops corresponded to the descending limb of the maximally activated force–length curve, and that the final lengths corresponded to the ascending limb (figure 5). Hence, as has been demonstrated previously [7,23], muscle fibres shortened over the plateau of the maximally activated force–length relationship during the longest hops. However, while force–length curves underwent large shifts to the right with decreasing activation level (figure 1), initial operating lengths did not change (figure 4c). Hence during shorter hops, fibres are likely to have started on, and shortened down, the ascending limb of sub-maximally activated force–length relationships (figure 5). A comparison of power–velocity relationships and muscle operating velocities showed that the shortening velocity in the longest hops is closely aligned with the optimal velocity in maximally activated muscle (figure 6), and that the decrease in optimum velocity with decreasing activation level was closely matched by the decrease in operating velocity with decreasing hop distance (figure 6).
Figure 5.
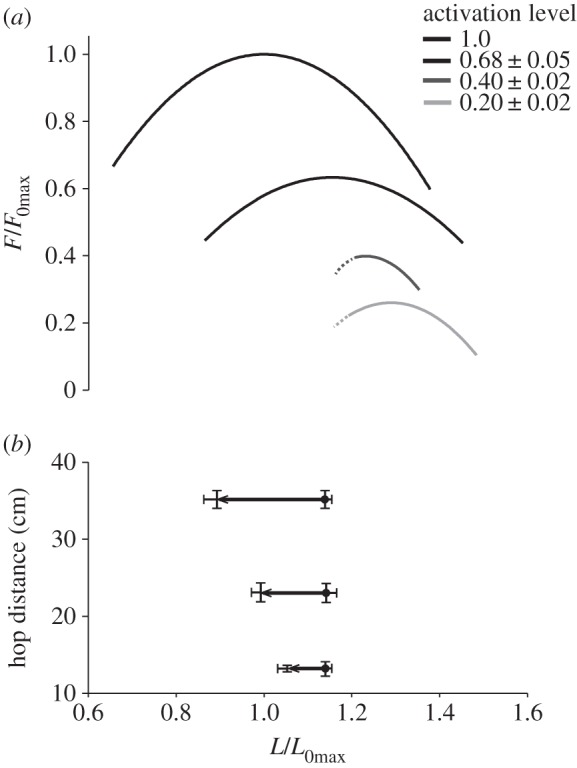
The relationship between muscle operating lengths and force–length relationships. The effect of activation level on the force–length relationship is shown (a). Initial operating lengths (circle), final operating lengths (arrow) and the resultant muscle shortening, are shown as a function of hop distance and aligned with the force–length relationship (b). In the longest hops (b) muscles shortened over the plateau of the maximally activated force–length relationship (a). In shorter hops (b), muscles operated on the ascending limb of sub-maximally activated force–length relationships (a).
Figure 6.
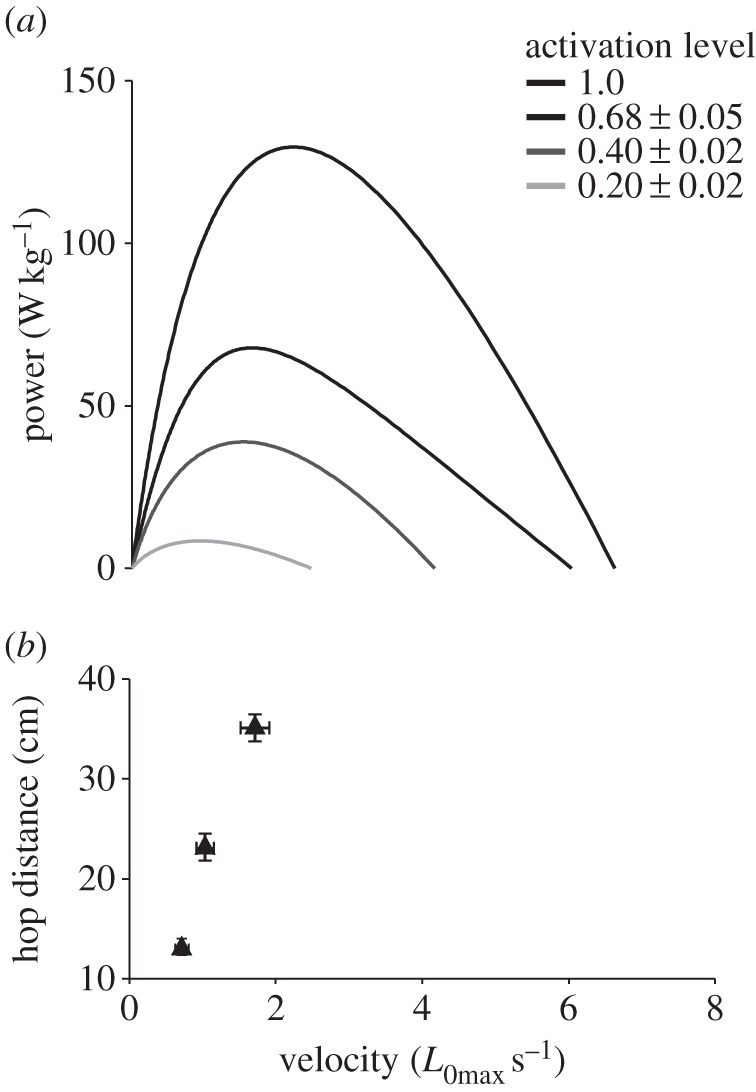
The relationship between muscle operating velocities and the power–velocity relationship. The effect of activation level on the power–velocity relationship is shown (a). Operating velocities are shown as a function of hop distance and aligned with the power–velocity relationship. Operating velocities decrease with decreasing hop distance (b), tracking the decrease in optimum velocity with decreasing activation level (a).
4. Discussion
In this study, we determined in vivo operating lengths and velocities, and the in vitro force–length and power–velocity relationships, at a range of activation levels. Measurements of EMG intensity and relative force determined that manipulating hop distance and stimulation voltage elicited the required change in activation level. There were significant effects of activation level on the operating lengths and velocities used in vivo and the force–length and power–velocity relationships determined in vitro.
In vitro, optimum length increased, and optimal shortening velocity decreased, with decreasing activation level. The effects of activation level on the force–length and power–velocity relationships are likely a result of the previously described effect of compliance in force transmission pathways [28], and resistance to muscle shortening [27]. In vivo, fibres started at the same length irrespective of activation level, but shortened less, and at a lower velocity, at lower activation levels (figures 5 and 6). The effects of activation level on operating lengths and velocities are likely a consequence of the starting position of the hindlimb, and the work requirements of the jump. Before a hop is initiated, the hindlimb is always fully flexed. Hence, there is no effect of activation level on initial length. During take-off, the plantaris shortens and does work and the limb extends. Shorter hops require less work, hence, less muscle shortening, longer final lengths and less limb extension. The lower shortening velocity at lower activation levels is likely a consequence of less muscle shortening in the absence of a change in time to take-off (figure 4a); the muscle shortens less over the same time period and so has a lower velocity.
Operating lengths and velocities, and force–length and power–velocity relationships, were determined at a range of activation levels in order to test the hypothesis that operating parameters track changes in optima with changing activation levels, and so to determine the validity of the assumption that muscles always perform optimally during locomotion. In order to do this, we must map operating lengths and velocities to activation level-specific force–length and force–velocity relationships. While these data provide the opportunity to do this, the use of different proxy methods to manipulate and quantify activation level means that we cannot entirely match in vivo and in vitro conditions and the highest activation levels achieved in vivo are likely not maximal [41]. However, the wide range of activation levels studied in vitro will have spanned the entire range of activation levels observed in vivo, and the selection of the longest hops for each individual will have ensure the highest possible in vivo activation level. Hence, this system allows us to cautiously draw conclusions about the effect of activation level on operating parameters, and the assumption the muscles always operate optimally.
The hypothesis that operating lengths and velocities would change with activation level, in order to track changing optima, was only partially supported. Operating velocities tracked optimal velocity and decreased with decreasing activation level. However, while operating lengths during the longest hops (at the highest activation level) traversed the plateau of the maximally activated force–length relationship, muscle fibres appeared to operate on the ascending limb of sub-maximally activated force–length relationship during shorter hops (figure 5). Hence, while muscle fibres always operate close to optimal velocities, they appear only to be able to operate close to optimal lengths at high activation levels.
The physical constraints of this system may have prevented muscle operating lengths from tracking changes in optima with activation level. The highly flexed position of the limb at the beginning of all hops may mean that it is not possible to increase initial length in order operate on the plateau of sub-maximally activated force–length relationships. Therefore, we suggest that when the locomotor system is constrained and muscles are unable to track changing optima, the system is tuned to maximize performance when the mechanical demands are greatest. It should be noted that in more anatomically complex systems, performing more nuanced tasks, there may be greater scope to change operating lengths with activation level. It has been suggested that the shifts in operating lengths observed during cycling could potentially allow muscles to track change in optimum length with activation level [42]. However, the finding, in this simple system at least, that operating lengths do not change with activation level leads us to question the validity of the assumption that muscles always operate optimally during locomotion.
The inability of muscle fibres to increase operating lengths with decreasing activation level will reduce the force muscle can produce for a given activation level. However, as the plantaris muscles of anurans tend to operate at long lengths relative to the maximally activated force–length curve (figure 5) [7,23], they will still be able to produce significant force at the point on the curve at which they operate. Many other muscles operate at shorter lengths, corresponding to the ascending limb of the maximally activated force–length relationship [43–47]. Hence, if we extrapolate the findings of this study to those systems, muscles would be unable to produce significant force at low activation levels. This seems unlikely. There may be less effect of activation level on optimum lengths in other systems, or they may have greater scope to vary operating lengths [42]. However, it is possible, particularly in more anatomically complex systems, that the effect of activation level on the force–length relationship can be modulated in vivo. We have suggested previously that the effectiveness of muscle force transmission pathways contributes to the shift in the force–length relationship [28]. Hence if force transmission pathways can be modulated in vivo, the effect of activation level on the force–length relationship may be reduced. The active stretch of the muscle that commonly occurs before shortening [48] may increase passive force [49] and therefore force transmission. Factors such as external loading by bodyweight and co-contraction of antagonistic muscles may limit muscle shortening compared to the in vitro condition and modulate the effect of activation level on the force–length relationship. Developing deeper insight into the in vivo contribution of co-contraction, muscle tone or history-dependent force enhancement, will greatly improve our understanding of the force–length relationship and the mapping between in vivo and in vitro conditions.
5. Conclusion
This study provides a novel comparison of in vivo operating lengths and velocities to optimum lengths and velocities across activation levels, and so enables the first experimental test of the assumption that muscles always function optimally during locomotion. These results show that while operating velocities likely change to track changing optima, operating lengths do not. Hence, muscles do not appear to always operate optimally in vivo. We suggest that muscle performs optimally when possible, but that when optimal performance cannot be achieved across an animal's entire locomotor range, the system is tuned to maximize performance when demand is greatest. The comparison of in vivo muscle function and optima across activation levels presented here prompt further questions about the determinants and modulation of operating lengths and velocities, and the ability of muscle to adapt to changing optima.
Supplementary Material
Acknowledgements
The authors would like to thank Emily Abbott, Neil Larson, Pooja Rana and Juliana Vanni for assistance with data collection and analysis, and Rich Marsh and Tom Roberts for insightful discussion.
Ethics
Animals were housed and handled in accordance with the US Public Health Service Policy for the humane care and use of laboratory animals and all protocols were approved by the UC Irvine Institutional Animal Care and Use Committee.
Authors' contributions
N.C.H. and E.A. devised experiments and collected and analysed data. N.C.H. drafted the article, and both authors reviewed and approved the final version.
Competing interests
The authors declare no conflicting interests
Funding
This study was funded by NIH grant no. AR055295 and NSF grant no. 1436476.
References
- 1.Gordon AM, Huxley AF, Julian FJ. 1966. The variation in isometric tension with sarcomere length in vertebrate muscle fibres. J. Physiol. 184, 170–192. ( 10.1113/jphysiol.1966.sp007909) [DOI] [PMC free article] [PubMed] [Google Scholar]
- 2.Hill AV. 1938. The heat of shortening and the dynamic constants of muscle. Proc. R. Soc. Lond. B 126, 136–195. ( 10.1098/rspb.1938.0050) [DOI] [Google Scholar]
- 3.Caiozzo VJ. 2002. Plasticity of skeletal muscle phenotype: mechanical consequences. Muscle Nerve 26, 740–768. ( 10.1002/mus.10271) [DOI] [PubMed] [Google Scholar]
- 4.Kier WM, Smith KK. 1985. Tongues, tentacles and trunks: the biomechanics of movement in muscular-hydrostats. Zoo. J. Linn. Soc. 83, 307–324. ( 10.1111/j.1096-3642.1985.tb01178.x) [DOI] [Google Scholar]
- 5.Alexander RM. 2002. Principles of animal locomotion. Princeton, NJ: Princeton university press. [Google Scholar]
- 6.Daley MA, Biewener AA. 2003. Muscle force–length dynamics during level versus incline locomotion: a comparison of in vivo performance of two guinea fowl ankle extensors. J. Exp. Biol. 206, 2941–2958. ( 10.1242/jeb.00503) [DOI] [PubMed] [Google Scholar]
- 7.Azizi E, Roberts TJ. 2010. Muscle performance during frog jumping: influences of elasticity on muscle operating lengths. Proc. R. Soc. B 277, 1523–1530. ( 10.1098/rspb.2009.2051) [DOI] [PMC free article] [PubMed] [Google Scholar]
- 8.Boriek AM, Zhu D, Zeller M, Rodarte JR. 2001. Inferences on force transmission from muscle fiber architecture of the canine diaphragm. Am. J. Physiol. Regul. Integr. Comp. Physiol. 280, R156–R165. [DOI] [PubMed] [Google Scholar]
- 9.Roberts TJ, Azizi E. 2011. Flexible mechanisms: the diverse roles of biological springs in vertebrate movement. J. Exp. Biol. 214, 353–362. ( 10.1242/jeb.038588) [DOI] [PMC free article] [PubMed] [Google Scholar]
- 10.Rome LC, Funke RP, Alexander RMcN, Lutz G, Aldridge H, Scott F, Freadman M. 1988. Why animals have different fiber types. Nature 335, 824–827. ( 10.1038/335824a0) [DOI] [PubMed] [Google Scholar]
- 11.Schiaffino S, Reggiani C. 2011. Fiber types in mammalian skeletal muscle. Physiol. Rev. 91, 1447–1531. ( 10.1152/physrev.00031.2010) [DOI] [PubMed] [Google Scholar]
- 12.Askew GN, Marsh RL. 2002. The mechanical power output of the pectoralis muscle of the blue-breasted quail (Coturnix chinensis): the in vivo length cycle and its implications for muscle performance. J. Exp. Biol. 204, 3587–3600. [DOI] [PubMed] [Google Scholar]
- 13.Alexander RMCN. 1969. The orientation of muscle fibres in the myomeres of fishes. J. Mar. Biol. Assoc. 49, 263–289. ( 10.1017/S0025315400035906) [DOI] [Google Scholar]
- 14.Rome LC, Sosnicki AA. 1991. Myofilament overlap in swimming carp. II. Sarcomere length changes during swimming. Am. J. Physiol. 260, C289–C296. [DOI] [PubMed] [Google Scholar]
- 15.Carrier DR, Gregersen CS, Silverton NA. 1998. Dynamic gearing in running dogs. J. Exp. Biol. 201, 3185–3195. [DOI] [PubMed] [Google Scholar]
- 16.Lutz GJ, Rome LC. 1994. Built for jumping: the design of the frog muscular system. Science 263, 370–372. ( 10.1126/science.8278808) [DOI] [PubMed] [Google Scholar]
- 17.Lutz GJ, Rome LC. 1996. Muscle function during jumping in frogs. II. Mechanical properties of muscle: implications for system design. Am. J. Physiol. 271, C571–C578. [DOI] [PubMed] [Google Scholar]
- 18.Rome LC. 1998. Some advances in integrative muscle physiology. Comp. Biochem. Physiol. B 120, 51–72. ( 10.1016/S0305-0491(98)00023-6) [DOI] [PubMed] [Google Scholar]
- 19.Alexander RMcN. 2000. Optimization of muscles and movements for performance or economy of energy. Neth. J. Zool. 50, 101–112. ( 10.1163/156854200505892) [DOI] [Google Scholar]
- 20.Burkholder TJ, Lieber RL. 2001. Sarcomere length operating range of vertebrate muscles during movement. J. Exp. Biol. 204, 1529–1536. [DOI] [PubMed] [Google Scholar]
- 21.Azizi E, Brainerd EL, Roberts TJ. 2008. Variable gearing in pennate muscles. Proc. Natl Acad. Sci. USA 105, 1745–1750. ( 10.1073/pnas.0709212105) [DOI] [PMC free article] [PubMed] [Google Scholar]
- 22.Medler S, Hulme K. 2009. Frequency dependent power output and skeletal muscle design. Comp. Biochem. Physiol. A 152, 407–417. ( 10.1016/j.cbpa.2008.11.021) [DOI] [PubMed] [Google Scholar]
- 23.Azizi E. 2014. Locomotor function shapes the passive mechanical properties and operating lengths of muscle. Proc. R. Soc. B 281, 20132914 ( 10.1098/rspb.2013.2914) [DOI] [PMC free article] [PubMed] [Google Scholar]
- 24.Wakeling JM, Blake OM, Wong I, Rana M, Lee SM. 2011. Movement mechanics as a determinant of muscle structure recruitment and coordination. Phil. Trans. R. Soc. B 366, 1554–1564. ( 10.1098/rstb.2010.0294) [DOI] [PMC free article] [PubMed] [Google Scholar]
- 25.Rack PMH, Westbury DR. 1969. The effects of length and stimulus rate on tension in the isometric cat soleus muscle. J. Physiol. 204, 443–460. ( 10.1113/jphysiol.1969.sp008923) [DOI] [PMC free article] [PubMed] [Google Scholar]
- 26.Brown IE, Cheng EJ, Loeb GE. 1999. Measured and modeled properties of mammalian skeletal muscle. II. The effects of the stimulus frequency on force–length and force–velocity relationships. J. Mus. Res. Cell Motil. 20, 627–643. ( 10.1023/A:1005585030764) [DOI] [PubMed] [Google Scholar]
- 27.Holt NC, Wakeling JM, Biewener AA. 2014. The effect of fast and slow motor unit activation on whole-muscle mechanical performance: the size principle may not pose a mechanical paradox. Proc. R. Soc. B 281, 20140002 ( 10.1098/rspb.2014.0002) [DOI] [PMC free article] [PubMed] [Google Scholar]
- 28.Holt NC, Azizi E. 2014. What drives activation-dependent shifts in the force–length curve? Biol. Lett. 10, 20140651 ( 10.1098/rsbl.2014.0651) [DOI] [PMC free article] [PubMed] [Google Scholar]
- 29.Adrian ED, Bronk DW. 1929. The discharge of impulses in motor nerve fibres. Part II. The frequency of discharge in reflex and voluntary contractions. J. Physiol. 67, 119–151. ( 10.1113/jphysiol.1929.sp002557) [DOI] [PMC free article] [PubMed] [Google Scholar]
- 30.Liddell EGT, Sherrington CS. 1925. Recruitment and some other factors of reflex inhibition. Proc. R. Soc. Lond. B 97, 488–518. ( 10.1098/rspb.1925.0016) [DOI] [Google Scholar]
- 31.Gorassini M, Eken T, Bebbett DJ, Kiehn O, Hultborn H. 2000. Activity of hindlimb motor units during locomotion in the conscious rat. J. Neurophysiol. 83, 2002–2011. [DOI] [PubMed] [Google Scholar]
- 32.Hodson-Tole EF, Wakeling JM. 2007. Variation in motor unit recruitment patterns occur within and between muscles in the running rat (Rattus norvegicus). J. Exp. Biol. 210, 2333–2345. ( 10.1242/jeb.004457) [DOI] [PubMed] [Google Scholar]
- 33.Morris CR, Askew GN. 2010. The mechanical power output of the pectoralis muscle of cockatiel (Nymphicus hollandicus): the in vivo muscle length trajectory and activity patterns and their implications for power modulation. J. Exp. Biol. 213, 2770–2780. ( 10.1242/jeb.035691) [DOI] [PubMed] [Google Scholar]
- 34.Vervuert I, Brussow N, Bochnia M, Cuddeford D, Coenen M. 2013. Electromyographic evaluation of masseter muscle activity in horses fed (i) different types of roughage and (ii) maize after different hay allocations. J. Anim. Physiol. Anim. Nut. 97, 515–521. ( 10.1111/j.1439-0396.2012.01292.x) [DOI] [PubMed] [Google Scholar]
- 35.Seven YB, Mantilla CB, Sieck GC. 2014. Recruitment of rat diaphragm motor units across motor behaviours with different levels of diaphragm activation. J. Appl. Physiol. 117, 1308–1316. ( 10.1152/japplphysiol.01395.2013) [DOI] [PMC free article] [PubMed] [Google Scholar]
- 36.Henneman E, Somjen G, Carpenter DO. 1965. Excitability and inhibitability of motoneurons of different sizes. J. Neurophysiol. 28, 599–620. [DOI] [PubMed] [Google Scholar]
- 37.Astley HC, Roberts TJ. 2014. The mechanics of elastic loading and recoil in anuran jumping. J. Exp. Biol. 217, 4372–4378. ( 10.1242/jeb.110296) [DOI] [PubMed] [Google Scholar]
- 38.Mendez J, Keys A. 1960. Density and composition of mammalian muscle. Metab. Clin. Exp. 9, 184–188. [Google Scholar]
- 39.Marsh RL, Bennett AF. 1986. Thermal dependence of contractile properties of skeletal muscle from the lizard Sceloporous occidentalis with comments on methods for fitting and comparing force–velocity curves. J. Exp. Biol. 126, 63–77. [DOI] [PubMed] [Google Scholar]
- 40.Azizi E, Abbott EM. 2013. Anticipatory motor patterns limit muscle stretch during landing in toads. Biol. Lett. 9, 20121045 ( 10.1098/rsbl.2012.1045) [DOI] [PMC free article] [PubMed] [Google Scholar]
- 41.Strojnik V. 1995. Muscle activation level during maximal voluntary effort. Eur. J. App. Physiol. Occ. Ther. 72, 144–149. ( 10.1007/BF00964129) [DOI] [PubMed] [Google Scholar]
- 42.Austin N, Nilwick R, Herzog W. 2010. In vivo operational fascicle lengths of vastus lateralis during sub-maximal and maximal cycling. J. Biomech. 43, 2394–2399. ( 10.1016/j.jbiomech.2010.04.016) [DOI] [PubMed] [Google Scholar]
- 43.Herzog W, Leonard TR, Renaud JM, Wallace J, Chaki G, Bornemisza S. 1992. Force–length properties and functional demands of cat gastrocnemius, soleus and plantaris muscles. J. Biomech. 11, 1329–1335. ( 10.1016/0021-9290(92)90288-C) [DOI] [PubMed] [Google Scholar]
- 44.Maganaris CN. 2001. Force–length characteristics of in vivo human skeletal muscle. Acta Physiol. Scand. 172, 279–285. ( 10.1046/j.1365-201x.2001.00799.x) [DOI] [PubMed] [Google Scholar]
- 45.Carr JA, Ellerby DJ, Marsh RL. 2011. Differential segmental strain during active lengthening in a large biarticular thigh muscle during running. J. Exp. Biol. 20, 3386–3395. ( 10.1242/jeb.050252) [DOI] [PMC free article] [PubMed] [Google Scholar]
- 46.Rubenson J, Pires NJ, Loi HO, Pinniger GJ, Shannon DG. 2012. On the ascent: the soleus operating length is conserves to the ascending limb of the force–length curve across gait mechanics in humans. J. Exp. Biol. 215, 3539–3551. ( 10.1242/jeb.070466) [DOI] [PubMed] [Google Scholar]
- 47.Arnold EM, Hamner SR, Seth A, Millard M, Delp SL. 2013. How muscle fiber lengths and velocities affect muscle force generation as humans walk and run at different speeds. J. Exp. Biol. 216, 2150–2160. ( 10.1242/jeb.075697) [DOI] [PMC free article] [PubMed] [Google Scholar]
- 48.Bobbert MF, Mackay M, Schinkelshoek D, Huijing PA, van Ingen Schnau GJ. 1986. Biomechanical analysis of drop and countermovement jumps. Eur. J. Appl. Physiol. 54, 566–573. ( 10.1007/BF00943342) [DOI] [PubMed] [Google Scholar]
- 49.Herzog W. 2005. Force enhancement following stretch of activated muscle: critical review and proposal for mechanisms. Med. Biol. Eng. Comp. 43, 173–180. ( 10.1007/BF02345951) [DOI] [PubMed] [Google Scholar]
Associated Data
This section collects any data citations, data availability statements, or supplementary materials included in this article.


