Abstract
Early detection of cancer is key to reducing morbidity and mortality. Morphological and chemical biomarkers presage the transition from normal to cancerous tissue. We have developed a noninvasive imaging system incorporating optical coherence tomography (OCT) and fluorescence lifetime imaging microscopy (FLIM) into a single optical system for the first time, in order to acquire both sets of biomarkers. OCT can provide morphological images of tissue with high resolution, while FLIM can provide biochemical tissue maps. Coregistered OCT volumes and FLIM images have been acquired simultaneously in an in vivo hamster cheek pouch model of oral cancer. The OCT images indicate morphological biomarkers for cancer including thickening of the epithelial layer and loss of the layered structure. The FLIM images indicate chemical biomarkers including increased nicotinamide adenine dinucleotide and reduced collagen emission. While both sets of biomarkers can differentiate normal and cancerous tissue, we believe their combination will enable the discrimination of benign lesions possessing some of the indicated biomarkers, e.g., scarring or inflammation.
Keywords: Cancer diagnosis, fluorescence lifetime imaging microscopy (FLIM), molecular imaging, multimodality imaging, optical coherence tomography (OCT)
I. Introduction
EARLY detection of neoplastic changes in the oral cavity holds great promise for improving survival rates and the quality of life of survivors. Currently, the diagnosis of oral epithelial cancers is performed through direct or endoscopic visual inspection followed by biopsy. Since visual inspection is subjective and early precancers are often not detectable under visual inspection, multiple biopsies have to be taken to increase the likelihood of finding a cancerous lesion. Therefore, techniques that can diagnose oral epithelial precancer and cancer with higher accuracy than visual inspection alone are needed to guide tissue biopsy.
Optical imaging is particularly well suited for imaging many of the epithelial tissues of the body including the oral cavity. The high-spatial resolution of optical imaging could make possible the diagnosis of neoplastic lesions, while they are still in the submillimeter range in size and highly treatable. Both biochemical and morphological changes accompany the transition from normal tissue to neoplastic tissue. Yet the optical techniques, heretofore investigated as potential screening and diagnostic tools for cancer, have largely concentrated on detecting one or the other, principally because of the fundamental lack of optical imaging modalities that readily provide both types of information.
Cancer diagnosis in the oral cavity can be particularly challenging. Benign lesions due to burning or biting, for instance, can mimic the structural changes in cancer development. Similarly, the biochemical changes due to benign causes, such as inflammation can sometimes mimic those from cancer. Hence, both structural and biochemical markers for oral cancer when considered separately can be prone to false positives.
We propose to simultaneously collect morphological and biochemical information by combining two well-developed optical imaging techniques: optical coherence tomography (OCT) and fluorescence lifetime imaging (FLIM). Since OCT and FLIM measure different tissue characteristics (structural and biochemical, respectively), we hypothesize that their synergy will increase the sensitivity and specificity for detecting early epithelial cancer, compared to each modality applied independently. The ultimate goal of this line of research is to develop a novel optical imaging technology for noninvasive optical biopsy in oral cancer. Such a technology may serve as a diagnostic and monitoring tool, a screening tool, a guide to standard biopsy and surgical intervention, and a tool for quantitative evaluation of therapeutic response.
Recent research in OCT turned to simultaneous collection of biochemical information via fluorescence imaging or spectroscopy in order to increase the specificity and sensitivity for diagnosing epithelial cancer and precancer. Wang et al. [1] have combined OCT and fluorescence imaging in an effort to diagnose early bladder cancer in a rat model. They used 5-aminolevulinic acid hydrochloride (5-ALA) to induce production of protoporphyrin IX in bladder cancerous lesions, and the fluorescence from protoporphyrin IX was imaged in excised whole bladders to identify suspect regions to be imaged with OCT. Combining the fluorescence and OCT structural information significantly improved their sensitivity and specificity to 100% and 81%, respectively.
Barton et al. developed a miniature endoscope for simultaneous OCT and laser-induced autofluorescence measurements and used it in an effort to diagnose colon cancer in a murine model [2]. They reported that the OCT images show significant changes in mucosal layer thickness and loss of visibility of tissue boundary lines between healthy and diseased tissue. Similarly, the laser-induced fluorescence spectra of healthy and diseased tissue were distinguishable by the emission at 405 and 680 nm.
In this letter, we present preliminary results on the simultaneous morphological and biochemical in vivo characterization of normal and cancerous epithelial tissue using a novel multimodal OCT–FLIM imaging system.
II. Methods
A. Multimodal OCT–FLIM Imaging System
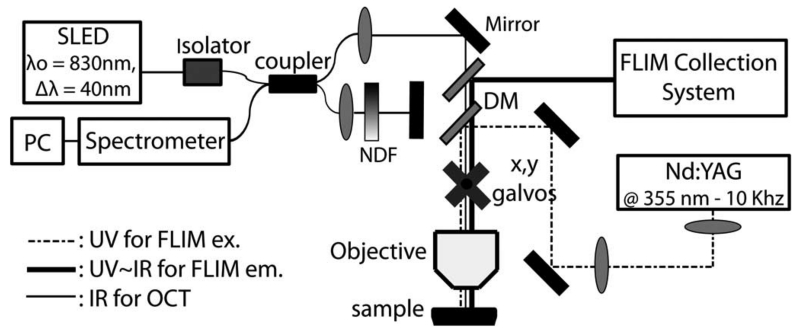
We have recently reported on a novel multimodal optical imaging system capable of acquiring simultaneously coregistered OCT and FLIM images of biological tissue [3], shown schematically in Fig. 1. The Fourier-domain OCT module was built around a custom-designed high-speed spectrometer (bandwidth of 102 nm and lines rates of up to 59 kHz). A 40-nm bandwidth superluminescent LED (SLED) (Exalos, EXS8410–2413) centered at 830 nm provided an axial resolution of 7.6 μm for OCT. The objective lens (EC-plan Neofluar 5×/.16, Zeiss) provided 10 μm lateral resolution for OCT and 100 μm for FLIM. Lateral OCT and FLIM, beam scanning was accomplished using a set of galvo mirrors (beam aperture 10 mm, 6230 H, Cambridge). The FLIM module excited and collected the fluorescence decay signal pixel-by-pixel coincident with OCT A-line collection. Each 2-D FLIM image had a corresponding coregistered OCT volume.
Fig. 1.
Multimodal optical system for simultaneous coregistered OCT and FLIM imaging of biological tissue. NDF: neutral density filter, ex.: excitation, and em.: emission.
Fluorescence excitation for FLIM was provided by pulsed Q-switched tripled Nd:YAG laser with center wavelength of 355 nm for excitation (1 ns FWHM, 0.24 μJ/pulse at 10 kHz) (SPOT 10–20-355, Elforlight). The fluorescence signal was detected with a MCP-PMT (rise time 150 ps, R3809U-50, Hamamatsu) coupled to a 1.5 GHz digitizer (250 ps temporal resolution, 4 Gsamples/s, Cobramax, Gage). In addition, simultaneous multispectral time-resolved fluorescence detection was achieved by separating the fluorescence emission in three bands using a series of dichroic mirrors (DMs) and bandpass filters, and launching each band into three fibers of different lengths (providing a time delay of ~45 ns among bands) focused onto the MCP-PMT [4]. The emission bands were chosen to selectively quantify the fluorescence emission of collagen (390 ± 20 nm), reduced nicotinamide adenine dinucleotide (NADH) (452 ± 22.5 nm) and flavin adenine dinucleotide (FAD) (550 ± 20 nm), which constitute the main endogenous fluorophores present in normal and malignant epithelial tissue.
The resulting OCT/FLIM system was capable of a maximum A-line rate of 59 kHz for OCT and a pixel rate of up to 30 kHz for FLIM. OCT B-scans and 3-D volumes were processed using standard algorithms in MATLAB and rendered in image-J. FLIM normalized intensity and lifetime 2-D maps for each emission band were computed using the Laguerre deconvolution technique [5].
B. Hamster Cheek Pouch Model of Epithelial Cancer
A Syrian (golden) hamster cheek pouch model of epithelial cancer was used in this study [6]. The animal protocol consisted of painting the right cheek pouch of the hamster (4 to 6 week old at the beginning of the protocol) with a suspension of 2.0% benzo[a]pyrene (Sigma–Aldrich Corporation, St. Louis, MO) in mineral oil three times per week for up to 32 weeks. Control animals were similarly treated with mineral oil alone. The procedure takes less than one minute per animal without inducing any pain or distress, and was approved by the Institution for Animal Care and Use Committee at Texas A&M University to ensure humane treatment of the hamsters. Although, this is an ongoing study that includes a total of 50 hamsters, here we report on preliminary results obtained from the first four animals.
C. In Vivo Imaging Protocol
Before imaging, the hamster was anesthetized (ketamine/xylazine cocktail) and its pouch was inverted and positioned under the microscope objective of the imaging system. Simultaneous coregistered OCT and FLIM images of 2 × 2 mm2 were acquired from different locations on the check pouch, which were subsequently ink-marked for correlation with the tissue histopathology. The acquisition time was ~7 s per imaged area. Heart rate and oxygen saturation were continuously monitored during the complete imaging protocol. After imaging, the animal was euthanized by barbiturate overdose. Biopsy samples from the imaged areas were taken and processed following standard procedures for histopathology analysis (hematoxylin and eosin staining).
III. Results
A. Sample OCT–FLIM Images of Normal Tissue
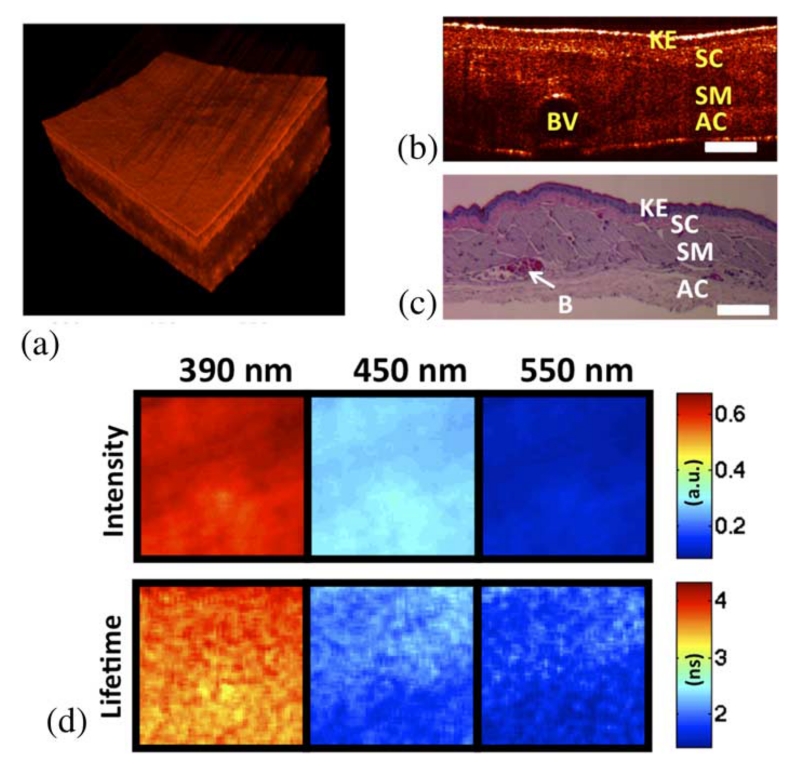
Results from OCT and FLIM images acquired in vivo from the cheek pouch of a control hamster are shown in Fig. 2. The other control animal showed similar results. Histopathology analysis of the imaged area confirmed that it corresponded to normal oral mucosa. The OCT 3-D volume [see Fig. 2(a)] showed a thin oral mucosa tissue with fairly uniform thickness of ~400–500 μm and three well-defined layers: epithelium, submucosa, and skeletal muscle layer.
Fig. 2.
In vivo coregistered OCT and FLIM images of normal oral mucosa. (a) OCT 3-D volume shows a uniformly thin tissue with well-defined layers. (b) and (c) Sample OCT B-scan and corresponding histology. (d) FLIM maps showed a homogeneous emission that was characteristic of collagen fluorescence. (Keratinized stratified squamous epithelium (KE), subepithelial connective tissue (SC), skeletal muscle layer (SM), adventitial connective tissue (AC), and blood vessel (BV), scale bar = 300 μm, and field of view: 2 × 2 mm2).
The multispectral FLIM images are shown in Fig. 2(b) as sets of normalized intensity and lifetime maps. The normalized intensity maps were obtained by dividing (pixel-by-pixel) the intensity map of each emission channel by the sum of the intensity maps of all three channels. Thus, the intensity maps indicate the relative fluorescence intensity emitted at each channel. The normalized fluorescence intensity was stronger at the 390 nm channel (~60%), followed by the intensity at the 450 nm (~30%) and the550 nm (~10%) channels, respectively. The lifetime maps show the fluorescence lifetime at each pixel of the image. They indicated a fairly uniform lifetime distribution in the imaged field of view. The lifetime values were longer at the 390 nm channel (~3.5 ns) compared to the values found at the 450 and 550 nm channels (both ~2 ns). The fluorescence emission of the imaged tissue resembles the emission characteristics of collagen, showing a peak emission at ~400 nm and lifetimes in the order of 3–4 ns.
B. Sample OCT–FLIM Images of Small Tumor
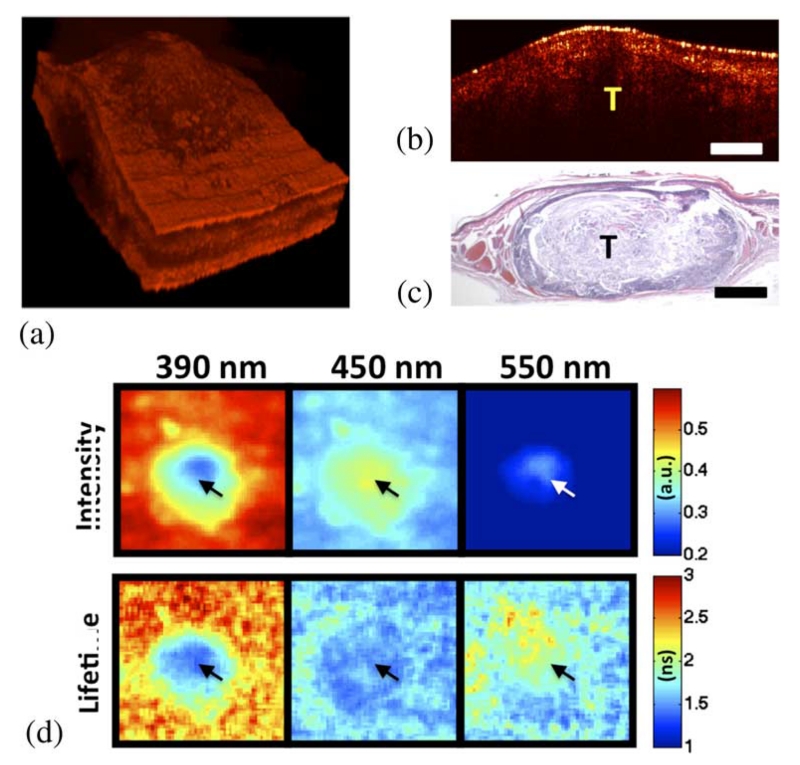
Results from OCT and FLIM images acquired in vivo from the cheek pouch of a treated hamster are shown in Fig. 3. Histopathology analysis of the imaged area confirmed that it corresponded to a squamous cell carcinoma or SCC (similar results were obtained from the other treated animal). The OCT 3-D volume [see Fig. 3(a)] showed a middle circular area of ~1 mm thick surrounded by a much thinner tissue (~400–500 μm). While the surrounding thin tissue showed well-defined layers, the middle thick region showed a less defined structure.
Fig. 3.
In vivo coregistered OCT and FLIM images of SCC. (a) OCT 3-D volume shows a thick middle region surrounded by thinner tissue. (b) and (c) Sample OCT B-scan and corresponding histology. (d) FLIM maps showed two distinct regions: a center area with a fluorescence that is characteristic of NADH and FAD, and a surrounding area with an emission that is characteristic of collagen. Arrows indicate the tumor area (tumor (T), scale bar = 300 μm, and field of view: 2 × 2 mm2).
The multispectral FLIM images are shown in Fig. 3(b). Two distinct regions were observed in both the normalized intensity and lifetimes maps at the three emission bands of the imaged tissue: a central round area coregistered with the middle thick region observed in the OCT image, and a surrounding area coregistered with the thinner tissue seen by OCT. The fluorescence emission of the surrounding area was similar to that observed from the normal oral mucosa also resembling a dominant collagen fluorescence. Its normalized intensity was stronger at the 390 nm channel (~55%), followed by the intensity at the 450 nm (~35%) and the 550 nm (~10%) channels, respectively. The lifetime values of the surrounding region were also longer at the 390 nm channel (~2.5–3 ns) compared to the values found at the 450 nm (~1.5 ns) and 550 nm (~2 ns) channels. The fluorescence emission of the middle area was very different from that of the surrounding area. The normalized intensity at 390 nm was weaker for the middle region than for the surrounding area (~35% versus ~55%, respectively), and stronger at 450 nm (~40% versus ~30%). The lifetime values of the middle region were ~1–1.5 ns at both 390 and 450 nm. The fluorescence emission of the middle region at 390 and 450 nm resembles the fluorescence characteristics of NADH, which peaks at 450 nm with short lifetimes of ~0.5–1.5 ns. The fluorescence emission at 550 nm (stronger at the middle region than at the surrounding area with lifetimes of ~2 ns) resembled the emission of FAD.
C. Simultaneous Morphological and Biochemical Imaging
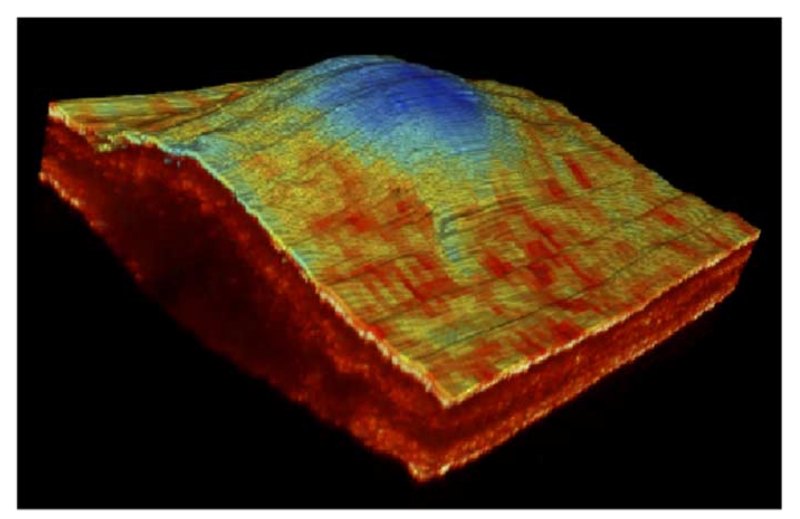
We are also exploring new methods of displaying the multimodal information in order to convey as much information as possible in one image. For instance, in Fig. 4, we have super-imposed the FLIM lifetime map from the 390 nm channel over the surface of the 3-D OCT volume corresponding to the tumor sample. As we can see in the resulting multimodal image, the tumor area corresponding to the thick central region shows different fluorescence lifetime values than the surrounding thinner region.
Fig. 4.
Multimodal image of the SCC lesion showing the lifetime map at 390 nm superimpose over the surface of the corresponding OCT 3-D volume.
IV. Discussion
We have demonstrated high-resolution morphological and biochemical in vivo imaging of normal and cancerous epithelial tissue using a recently developed multimodal optical imaging system for simultaneous coregistered OCT and multispectral FLIM. The high-resolution 3-D images of the epithelial tissue obtained by OCT enabled the quantification of tissue and layer thickness and the assessment of the integrity of the tissue layers. The multispectral and lifetime characterization of the tissue autofluorescence available from FLIM enabled the identification of the relative content of the main endogenous fluorophores (collagen, NADH, and FAD) present in both normal and cancerous epithelial tissue.
The normal oral mucosa was ~400–500 μm thick and presented well-defined layers as shown in the OCT volumes, resembling the actual histology of the tissue. The fluorescence emission of the normal tissue showed spectral and lifetime properties that are characteristic of collagen, suggesting that this fluorophore dominates the autofluorescence of normal epithelial tissue. This result is in agreement with previous studies confirming that collagen in the submucosa is the main source of autofluorescence in normal epithelial tissue [7].
The SCC tumor was significantly thicker (~1 mm) and its internal morphology was characterized by a loss of the layered structure found in the normal tissue, as shown in the OCT volumes. The fluorescence emission of the malignant tissue showed spectral and lifetime properties that are characteristic of both NADH and FAD, suggesting that these fluorophores dominate the autofluorescence emission of malignant tissue. This result is also in agreement with previous studies indicating that the mitochondrial content of NADH and FAD in malignant epithelial cells is significantly increased relative to normal cells. Although collagen fluorescence can also be expected in malignant tissue, its contribution should be less significant than in the normal oral mucosa case due to both the thickening of the epithelial layer and the degradation of the extracellular matrix expected to occur in malignant tissue [7].
While not demonstrated here, the characteristics of the OCT and FLIM images could be used to differentiate between benign and malignant lesions. For example, scars from biting or burning could result in a thickening and/or loss of the characteristic layered structure that could potentially be misinterpreted as malignant based on OCT images alone. However, scars are mostly fibrotic; hence, their fluorescence signature would be dominated by collagen emission rather than NADH/FAD. Similarly, inflammation in the oral mucosa results in the infiltration of inflammatory cells within the epithelial tissue. Such cells would also present significant NADH/FAD autofluorescence; hence, inflammation could be misinterpreted as malignant based on FLIM images alone. Inflammation seldom results in the loss of the characteristic layered structure, thus the OCT image would indicate benign.
V. Conclusion
We believe this to be the first study reporting on the simultaneous morphological and biochemical in vivo characterization of normal and malignant epithelial tissue using coregistered OCT and multispectral FLIM imaging. Characterizing the tissue autofluorescence in terms of not only its spectral, but also its lifetime characteristics will also provide better quantification of the tissue biochemistry, as lifetime measurements can resolve fluorophores with overlapping spectra, such as collagen and NADH, and free/bound NADH/FAD. Moreover, lifetime measurements are less sensitive to blood absorption and intensity artifacts, thus more robust for clinical applications.
Development of a clinically compatible system as well as computer-aided diagnosis algorithms incorporating the most pertinent parameters gleaned from the animal study will precede human in vivo validation studies. We believe the strengths of the proposed technology will result in its application to the diagnosis and monitoring of suspicious lesions in its earliest clinical deployment. We expect it to be utilized after the observation of a suspicious oral lesion during a visual inspection. Since it is impractical to perform biopsies on every suspicious lesion, the standard protocol is to watch the lesions over an extended period of time to determine if they are threatening. This may lead to the situation, where a malignant lesion is allowed to advance into a later stage cancer, which is much harder to treat. Our technology would allow for the diagnosis of these lesions immediately after identification during a visual inspection.
Acknowledgments
This work was supported by the National Institutes of Health under Grant 1-R21-CA132433.
Footnotes
Color versions of one or more of the figures in this paper are available online at http://ieeexplore.ieee.org.
Contributor Information
Javier A. Jo, Department of Biomedical Engineering, Texas A&M University, College Station, TX 77840 USA.
Brian E. Applegate, Department of Biomedical Engineering, Texas A&M University, College Station, TX 77840 USA
Jesung Park, Department of Biomedical Engineering, Texas A&M University, College Station, TX 77840 USA.
Sebina Shrestha, Department of Biomedical Engineering, Texas A&M University, College Station, TX 77840 USA.
Paritosh Pande, Department of Biomedical Engineering, Texas A&M University, College Station, TX 77840 USA.
Irma B. Gimenez-Conti, Department of Carcinogenesis, University of Texas M.D. Anderson Cancer Center, Smithville, TX 78957 USA
Jimi L. Brandon, Department of Carcinogenesis, University of Texas M.D. Anderson Cancer Center, Smithville, TX 78957 USA
References
- [1].Wang ZG, Durand DB, Schoenberg M, et al. Fluorescence guided optical coherence tomography for the diagnosis of early bladder cancer in a rat model. J. Urol. 2005 Dec;174(6):2376–2381. doi: 10.1097/01.ju.0000180413.98752.a1. [DOI] [PubMed] [Google Scholar]
- [2].Hariri LP, Tumlinson AR, Besselsen DG, et al. Endoscopic optical coherence tomography and laser-induced fluorescence spectroscopy in a murine colon cancer model. Lasers Surg. Med. 2006 Apr;38(4):305–313. doi: 10.1002/lsm.20305. [DOI] [PubMed] [Google Scholar]
- [3].Park J, Jo JA, Shrestha S, et al. A dual-modality optical coherence tomography and fluorescence lifetime imaging microscopy system for simultaneous morphological and biochemical tissue characterization. Biom. Opt. Exp. doi: 10.1364/BOE.1.000186. to be published. [DOI] [PMC free article] [PubMed] [Google Scholar]
- [4].Shrestha S, Applegate BE, Park J, et al. A novel high-speed multispectral fluorescence lifetime imaging implementation for in vivo applications. Opt. Lett. doi: 10.1364/OL.35.002558. to be published. [DOI] [PMC free article] [PubMed] [Google Scholar]
- [5].Pande P, Jo JA. Automated analysis of fluorescence lifetime imaging microscopy (FLIM) data based on the Laguerre deconvolution method. IEEE Trans. Biomed. Eng. doi: 10.1109/TBME.2010.2084086. to be published. [DOI] [PubMed] [Google Scholar]
- [6].Brandon J, Conti C, Goldstein L, et al. Carcinogenic effects of MGP-7 and B[a]P on the hamster cheek pouch. Toxicol. Pathol. 2009;37(6):733–740. doi: 10.1177/0192623309344203. [DOI] [PubMed] [Google Scholar]
- [7].Muller MG, Valdez TA, Georgakoudi I, et al. Spectroscopic detection and evaluation of morphologic and biochemical changes in early human oral carcinoma. Cancer. 2003 Apr 1;97(7):1681–1692. doi: 10.1002/cncr.11255. [DOI] [PubMed] [Google Scholar]


