Abstract
Purpose:
Dyslexia is one of the most common learning disabilities affecting millions of people worldwide. Although exact causes of dyslexia are not well-known, a deficit in the magnocellular pathway may play a role. We examined possible deficiency of magnocellular, as compared to parvocellular and koniocellular pathway function by measuring luminance and color perception.
Methods:
Visual stimuli consisted of a series of natural images, divided into layers of luminance, red-green and blue-yellow, which probed magnocellular, parvocellular, and koniocellular pathways, respectively. Thirteen children with dyslexia and 13 sex- and age- matched controls performed three psychophysical tasks. In the first task, subjects were instructed to match the contrast of luminance (magno) and red-green (parvo) images to that of the blue-yellow (konio) images. In the second task, subjects detected the isoluminant point of red-green images to probe parvocellular pathway. In the third task, temporal processing was assessed by measuring reaction time and percentage of correct responses in an identification task using four categories of images, activating all three pathways.
Results:
The dyslexic group had significantly elevated luminance and color contrast thresholds and higher isoluminant point ratio in comparison to the control group. Furthermore, they had significantly less correct responses than the control group for the blue-yellow images.
Conclusion:
We may suggest that dyslexic subjects might suffer from both magnocellular and parvocellular deficits. Moreover, our results show partial impairment of the koniocellular pathway. Thus, dyslexia might be associated with deficits in all three visual pathways.
Keywords: Dyslexia, Koniocellular, Magnocellular, Parvocellular
INTRODUCTION
Dyslexia is a major neuro developmental disorder identified by noticeable difficulty in reading ability. Which is not correlated with intelligence, age, socioeconomic status or educational opportunities, and occurs in the absence of neurological disorders or sensory impairments.[1] Dyslexia is the most common learning disability affecting 4-10% of school-aged children[2,3] and is one of the most frequently diagnosed conditions in childhood in most countries.[4,5] The exact causes of dyslexia are controversial and poorly understood.[6] Even though some argue dysfunctional phonological processing as the main cause of deficit in dyslexia,[7,8] others have suggested other factors such as impaired visual processing,[9,10,11,12] attentional deficits,[13] impaired eye movements,[14,15] and abnormalities of processing[7,16] as the main cause.
The human visual system is composed of three anatomically distinct parallel pathways (magnocellular M, parvocellular P, and koniocellular K) projecting from the magno, parvo, and koniocellular ganglion cells to the lateral geniculate nucleus, and through there to the primary visual cortex V1. These sub-systems have distinct structural and spatiotemporal characteristics. P cells are small with less myelin, are color-opponent (so-called red/green), and have low contrast sensitivity, high spatial, low temporal resolution, and low conduction velocity.[17,18] In contrast, M cells, are large cells with more myelin which are activated by achromatic low spatial frequencies, have high contrast sensitivity and temporal resolution with a high conduction velocity.[19] K cells are less abundant and carry color opponent signals (so-called blue/yellow).[18] Since these pathways respond optimally to different visual stimuli, it is possible to probe each pathway using its preferred visual stimulus. This approach provides an alternative method to assess many deficits in the visual system.[18]
Magnocellular visual pathway impairment has been reported a possible cause of dyslexia.[9,20,10,11] Reduced sensitivity to luminance patterns and motion displays with high temporal and low spatial frequencies has frequently often been reported.[21,22] Furthermore, decreased sensitivity to coherent motion in random dot kinematograms has frequently been found in dyslexia.[23,24] Performance for tasks related to color and form is often reported to be intact.[25] Even though these results might suggest a magnocellular deficit in dyslexia, several authors have criticized this hypothesis[26,27,28,29,30] and some experiments have failed to find any significant differences between normal and dyslexic groups by these measurements.[31] critics of this hypothesis often point out that the deficit in contrast sensitivity does not necessarily equate a deficit in magnocellular pathway, and reading is a complicated task requiring many different visual functions.[30,32] In addition, since isoluminant stimuli are not ecological, the resulting neural responses might be very different than what magno and parvocellular pathways encounter in real life. Although isoluminant stimuli might activate pathways other than the target pathway, there is still a large significant correlation between the responses and the target pathway's function.
Most previous studies of dyslexia employed simple stimuli such as gratings or random dot patterns[33,34] which are often not encountered in the ecological world, whereas visual system may respond optimally to more ecologically valid stimuli such as natural scenes. Moreover, natural scenes contain a rich set of color and frequency information with specific ratios (~1/f) and a much higher energy at low spatial frequencies that might be suitable to probe any possible changes in magnocellular pathway in dyslexia, though a disadvantage of using intact natural scenes as stimuli is the inability to control spatial frequencies. Therefore, in the experiment described in this paper, we employed natural scenes to investigate possible differences in magno-, parvo-, and koniocellular functioning in dyslexic and normal children, particularly in a more natural situation.
Previously, impairments in contrast sensitivity and spatiotemporal processing have been reported, but limited impairments in color and form perception have been observed.[25] However, many of these studies employed vastly different visual stimuli, which might lead to results that are not directly comparable. In addition, in light of some studies failing to find differences in contrast sensitivity employing different visual stimuli,[31] the information content of the visual stimulus might be extremely important in probing the deficit. Thus, in this study, we employed the same visual information, to probe luminance and color contrast deficits, color processing, temporal and form processing. This approach enables us to directly compare the results using identical visual information.
In addition, studies of color processing in dyslexia often ignored any possible deficits in the koniocellular pathway and did not investigate deficits in processing of the blue-yellow layer. However, changes in blue-yellow processing might affect the functions of the magnocellular pathway.[35,36] Furthermore, there might be important impairments in the processing of blue-yellow information that might have been ignored. Therefore, to probe any possible deficits in the koniocellular pathway, we measured the contrast sensitivity, temporal and form processing in the blue-yellow layer as well.
In the first experiment, we probed luminance and color contrast impairments by measuring the perceived luminance and color contrast thresholds in dyslexic and normal groups. In the second task, we used the same visual stimuli to measure red-green isoluminant points in both groups. This experiment probed any parvocellular processing deficiencies in dyslexics. In the third experiment, the spatiotemporal and form processing were assessed by rapid scene category detection. Together, these experiments measured any changes in three pathways comprehensively, using ecological and identical visual stimulus.
METHODS
Visual Stimuli
The experiments were performed on a PC (Dell) and stimuli were displayed on a Cathode-ray-tube monitor (CRT, LG, Korea, 640 × 480, 100 Hz) that was calibrated with mean luminance of 28.39 cd/m2. Visual stimulus was generated using Matlab (Mathworks, USA) with Psychtoolbox extensions[37] and consisted of 20 natural scene images including animals, foliage, flowers and fruits taken from the McGill calibrated color image database.[38] Images are selected with similar color contents and spatial frequencies based on the authors' estimate. The images were stored as uncompressed tagged image format files with 1920 × 2560 pixel resolution and 24 bits color depth, respectively. Using the spectral sensitivity of camera sensors and the sensitivities of the L (Long-), M (Middle-) and S (Short-wavelength-sensitive) cones from Smith and Pokorny (1975),[39] a conventional 3 × 3 matrix was employed to convert the RGB camera values to LMS cone excitation.[38] A modified version of Ruderman color space was employed to model three post-receptoral channels of human vision.[40] Using these measures, the images were divided into layers of luminance, red-green and blue-yellow, respectively. This method has previously been used for psychophysical experiments.[41]
Subjects
A total of 26 children aged 7-13 years old participated in the study; 13 (7 females) had been diagnosed as dyslexic earlier by a qualified psychologist. Inclusion criteria required dyslexic children to have normal intelligence (intelligence quotient >88), reading score below 30th percentile on the analysis of persian reading ability (APRA), no uncorrected visual or auditory deficit, and no history of other neurological or psychiatric disorders. Color vision was evaluated using Ishihara color vision plates. Intelligence was assessed with the Raven's Colored Progressive Matrices test.[42] Thirteen age-matched controls (7 females) were recruited using the same criteria with the exception that their reading score was above the 30th percentile. Word reading, a subtest of (ARPA), was employed to evaluate reading accuracy. APRA is a reading test for Persian speaking children[3] based on the “Neale Analysis of Reading Ability”.[43] This subtest consisted of 6 cards. The first card which contained 10 words from all 5 educational years (2 words were selected from each year) was used for practice and other cards were allocated to each of the 5 years containing 22 words (overall 110 words). Word selection was based on 2 criteria: The rate of complexity and word frequency calculated from Iranian national curriculum textbooks (years 1-5). The subtest has acceptable validity and reliability with a construct validity of (r = 0.54, P < 0.001) and the overall reliability with Cronbach's Alpha of 0.98 Valipour, 2012.[44]
All experiments conformed to the university human ethics committee guidelines and written parental consent was obtained prior to participation in the experiments. All experiments adhered to the Declaration of Helsinki.
General Procedures
Prior to the main experiment, intelligence and reading performance were assessed as described above. The subjects viewed the monitor from a distance of 50 cm under normal room illumination and binocular viewing conditions. The experiments were split into 3 blocks of approximately 15 minutes each, lasting 45-60 minutes in total. Subjects were allowed breaks whenever necessary to avoid discomfort.
RESULTS
Experiment 1
In the first experiment, possible deficiencies in the three pathways in dyslexic children were measured using a contrast matching task. In each trial, three different versions of one image were shown. The blue-yellow layer of the image was shown on the left side of the screen, and the red-green and luminance images were shown on the right [Figure 1]. The subjects were instructed to adjust the perceived contrast of the two images located on the right side of the screen (red-green and luminance) to match the one on the left side (blue-yellow). The contrast of the blue-yellow image was fixed at a random value at the beginning of the trial. The subjects could spend as much time on each image before reaching a decision. Upon satisfactory response by the subjects, the experimenter initiated the presentations of the next set of images. Twenty randomly interleaved images were presented in this experiment. Since the perceived contrast of the blue-yellow channel is lower than red-green and the luminance channels a contrast ratio often between zero and one was obtained. All luminance and color contrast ratio results are shown in Figure 2a with the control group in dark circles and dyslexic group in light squares. The average luminance and color contrast ratios of all 20 images for each subject are shown in Figure 2b. A Mann–Whitney U-test confirmed significant differences between the two groups in Luminance contrast (u = 13, P = 0.001). An independent t-test also revealed significant difference in color contrast between the 2 groups (t = 2.172, P = 0.04) [Figure 3].
Figure 1.
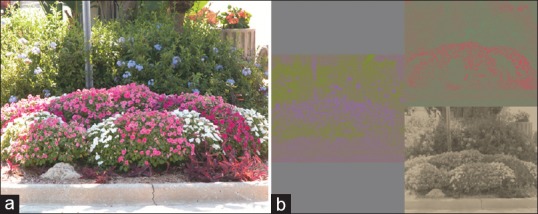
Example of the stimulus employed in the matching task. (a) Original image. (b) Three different images activating different pathways with koniocellular-activating (blue-yellow) at left, magnocellular activating (luminance) at right-bottom; parvocellular activating (red-green) at the right-top.
Figure 2.
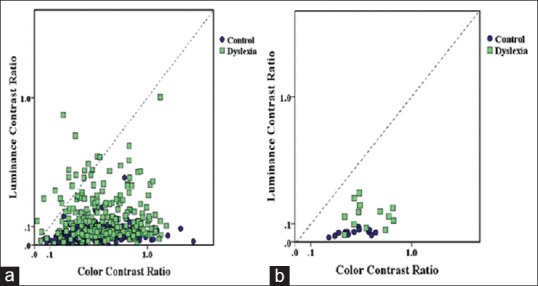
An example of luminance and color contrast thresholds. (a) Individual color and luminance contrast ratios for each image (n=20) and each subject (n=13) in the two groups. (b) Average luminance and color contrast ratios for each of the 13 subjects. The control and dyslexic groups are shown with dark circles and light squares, respectively. The dyslexic group showed elevated contrast ratio thresholds in comparison to the controls.
Figure 3.
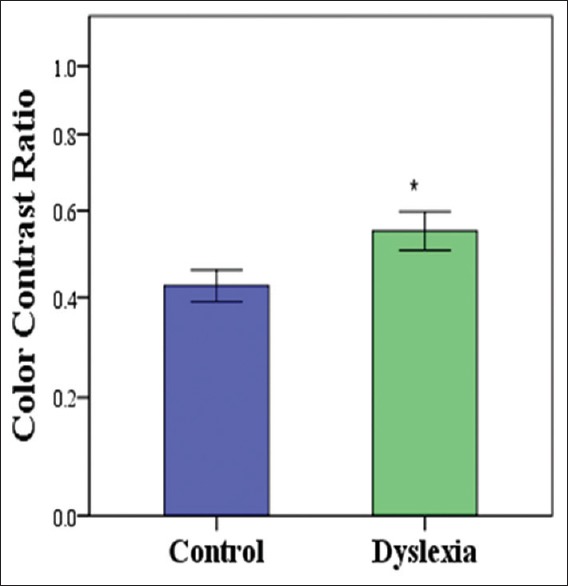
Average color contrast threshold in dyslexic and control groups for the first experiment. Error bars here and in all subsequent figures represent standard error.
Experiment 2
In the second experiment, we probed color processing in dyslexic subjects by measuring the red-green isoluminant point. The subjects were instructed to adjust the color luminance of the image to equate the color luminance of the red and green parts. On each trial, the red-green layer of the images employed in experiment 1 was shown, and the subject was instructed to adjust the ratio of luminance for the red and green parts of the image. The subjects could spend as much time as desired before reaching a decision. Upon satisfactory response, the experimenter initiated the next trial. Figure 4 shows an example of visual stimuli in this experiment along with the original image. An independent t-test showed significant differences (t = 2.156, P = 0.041).
Figure 4.
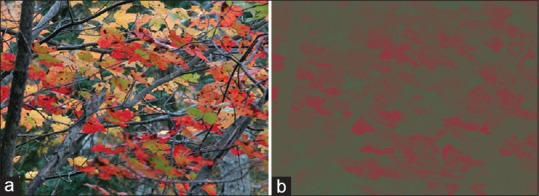
Example of the stimulus used in the second experiment. (a) Original image. (b) Parvocellular-activating (red-green) image. The subjects were instructed to adjust the red and green luminances to reach the isoluminant point.
The average red-green ratio for the dyslexic group was higher that of the control group [Figure 5]. The isoluminant point can be used to measure the ratio of long-wavelength-sensitive (L) to medium-wavelength-sensitive (M) cones (L/M ratio) of P cells. This result may indicate different L/M ratio in P pathway between the two groups.
Figure 5.
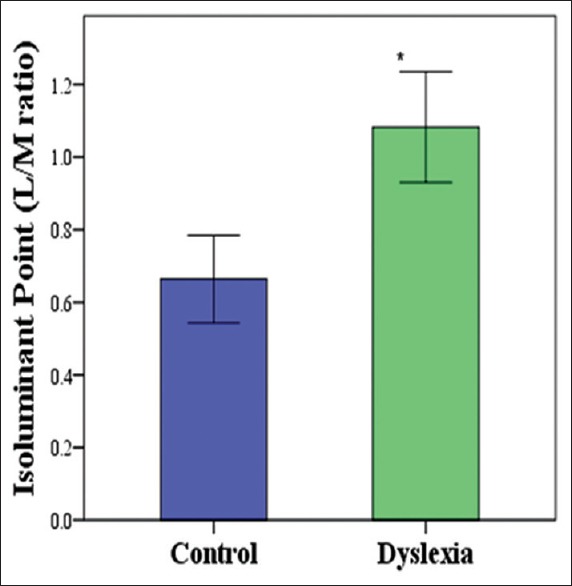
Average red-green iso-luminant points in dyslexic and control groups. The dyslexic group showed higher isoluminant points.
Experiment 3
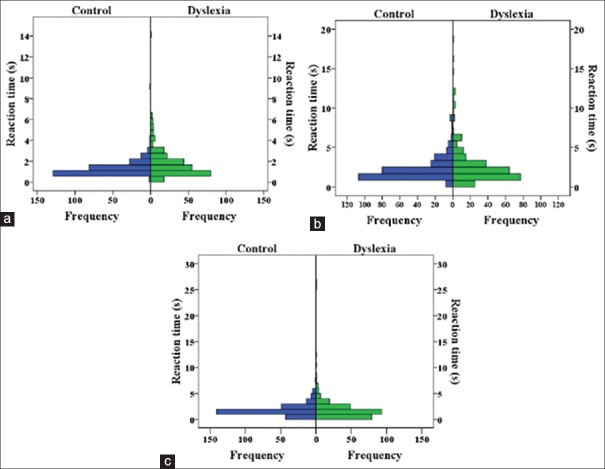
In the third experiment, we assessed spatiotemporal and form processing in these pathways. A total of 80 images were divided into 4 categories. The first 3 categories were identical to the ones we employed in the first experiment, and the last category was the original images. The subjects had to judge whether there was an animal in the image. Each image appeared on the screen until the subject pressed the according button response. After an inter-trial interval of 1 second, the next image appeared on the screen. Subjects were instructed to respond as quickly and accurately as possible after the onset of the image on the screen. The reaction times and response accuracy were recorded for each trial. Reaction time distribution for the magnocellular activating images is shown in Figure 6a. Results for parvo and konio cellular pathway images are shown in Figure 6b and c. The parvo reaction times were largely similar, whereas the magno and konio reaction times and konio reaction times increased in the dyslexic group. The average reaction times in dyslexic and control groups are shown in Figure 7a. The dyslexic group had slightly higher reaction times for magno (luminance) and konio (blue-yellow) pathways, whereas the reaction times were very similar for parvo (red-green) and original images. However, these changes were not statistically significant by multivariate analysis of variance (MANOVA) test. It should be mentioned that reaction times did not correlate with age in either group. The average number of accurate responses between the dyslexic and control groups is shown in Figure 7b. There was no significant correlation between response accuracy and age of the subjects. The average number of correct responses was lower for konio (blue-yellow) and parvo (red-green) whereas it was very similar for magno (luminance) and original images. The same MANOVA analysis confirmed that dyslexic subjects were significantly less accurate in the koniocellular pathway stimulus (blue-yellow) (F[1,24]=13.288, P = 0.001), showing a possible deficiency within this pathway. No statistical differences were observed in response accuracy to other series.
Figure 6.
Histogram distribution of reaction times for dyslexic and control groups for three categories of images (a) reaction times for magnocellular, (b) parvocellular, (c) koniocellular activating sets of images. Reaction times for parvo pathway are similar between the two groups, whereas reaction times for konio and magno pathways are increased.
Figure 7.
(a) Reaction times and (b) response accuracy in the object identification task for control and dyslexic groups for konio (blue-yellow), parvo (red-green), magno (luminance), and original images. The Dyslexic group showed higher average reaction times in konio (blue-yellow) and magno (luminance) images. The dyslexic group also demonstrated lower performance in the identification task for konio (blue-yellow) and parvo (red-green) images.
DISCUSSION
In the experiments described in this paper, we measured luminance and color contrast processing, as well as reaction times and response accuracy for object identification using natural scenes. Our results demonstrated that dyslexic children are less sensitive than normal controls to luminance and color contrasts. This may indicate deficits in both magno and parvocellular pathways. Alternatively, this difference may indicate differences in LMS cone ratios, which have been shown to vary significantly in normal subjects.[45,46]
Comparison to Previous Psychophysical Results
Our results are compatible with reductions in contrast sensitivity especially for luminance patterns, previously reported using other types of visual stimuli.[9,21] Some previous studies on dyslexia failed to find any differences in contrast sensitivity. For example Gross-Glenn et al,[47] examined contrast sensitivity through temporally ramped gratings and failed to find any differences between dyslexic subjects and the controls. The increased threshold of color contrast may indicate dysfunctional parvocellular processing. This result is consistent with the findings reported by Farrag, Khedr, and Abel-Naser,[27] who found that dyslexia might be related to deficits in the parvocellular pathway in Arabic-speaking children. Interestingly, dyslexic subjects also had higher isoluminant point ratios than the control group. In other words, this group had higher L/M ratio.
Previous studies have shown that the number of L and M cones varies between individuals.[45,48] According to indiscriminate L-and M-cone inputs to chromatic (L-M) mechanism model proposed by Mullen and Kingdom,[49] subjects with more symmetrical L/M ratio have more color opponency and color contrast sensitivity. In contrast, subjects with higher L/M asymmetry have lower color contrast sensitivity. This pattern was seen in dyslexic subjects participating in the current study. They had higher L/M asymmetry and color contrast threshold. In another study, Gunther and Dobkins[50] found a significant correlation between L/M ratio and color contrast sensitivity. Our findings points to asymmetric L/M ratio and impairment of the parvocellular pathway in dyslexia.
Our reaction times results are consistent with the results of Sigmundsson[51] who investigated the effect of visual processing deficits on a response time task and found that dyslexic subjects had longer reaction times to respond to driving signs. Thus, dyslexic subjects require longer presentation times on average than normal subjects especially for blue-yellow and luminance images.
Poor accuracy on the first category of the images might reflect a disruption in koniocellular processing suggesting that this pathway may also play a role in reading. Furthermore, investigating the koniocellular pathway has largely been ignored in dyslexia so far. However, in one of the few studies examining blue-yellow stimulus, Dain, Floyd and Elliot[52] found that dyslexic individuals had decreased thresholds for blue-yellow stimuli contributing to positive impacts of colored lenses. These results suggest that the deficit in dyslexia might not be limited to the magnocellular pathway and create new directions for research in dyslexia.
Possible Limitations
Employing isoluminant and luminance stimuli have been shown to be useful in probing pathway functions. However, this technique has some inherent limitations. The isoluminant stimuli can possibly activate the magnocellular pathway to some degree. Furthermore, results from electrophysiology might suggest that there are some neurons still responding at isoluminant points. Nevertheless, these neural responses might be due to the non-optimality of the stimulus to the specific neuron and might not matter at the pooled responses observed by psychophysics. Despite these possible limitations, a significant correlation exists between psychophysical responses to isoluminant and luminance images and pathway functions.
Our results confirm the magnocellular and parvocellular deficits and indicate partial impairment of koniocellular pathway in dyslexia. These results suggest that all three pathways might be involved in reading. Our findings also suggest that natural scenes can be an ideal form of stimulus to probe changes in dyslexia.
Footnotes
Source of Support: Nil.
Conflict of Interest: None declared.
REFERENCES
- 1.4th ed. Washington, DC: APA; 2000. American Psychiatric Association (APA). Diagnostic and Statistical Manual of Mental Disorders, DSM-IV. [Google Scholar]
- 2.Shaywitz SE, Shaywitz BA, Fletcher JM, Escobar MD. Prevalence of reading disability in boys and girls. Results of the Connecticut Longitudinal Study. JAMA. 1990;264:998–1002. [PubMed] [Google Scholar]
- 3.Pouretemad HR, Khatibi A, Zarei M, Stein J. Manifestations of developmental dyslexia in monolingual Persian speaking students. Arch Iran Med. 2011;14:259–265. [PubMed] [Google Scholar]
- 4.Paulesu E, Démonet JF, Fazio F, McCrory E, Chanoine V, Brunswick N, et al. Dyslexia: Cultural diversity and biological unity. Science. 2001;291:2165–2167. doi: 10.1126/science.1057179. [DOI] [PubMed] [Google Scholar]
- 5.Wydell T. Development of Reading/Writing Skills Among Japanese Primary School Children: The Occurrence of Dyslexia Differs for Kana and Kanj. Experimental Social Psychology Workshop on the Role of Orthographies in Reading and Spelling, Midllesex University; 20-21 September. 2006 [Google Scholar]
- 6.Ramus F, Ahissar M. Developmental dyslexia: The difficulties of interpreting poor performance, and the importance of normal performance. Cogn Neuropsychol. 2012;29:104–122. doi: 10.1080/02643294.2012.677420. [DOI] [PubMed] [Google Scholar]
- 7.Snowling MJ. Phonemic deficits in developmental dyslexia. PsycholRes. 1981;43:219–234. doi: 10.1007/BF00309831. [DOI] [PubMed] [Google Scholar]
- 8.Vellutino FR, Fletcher JM, Snowling MJ, Scanlon DM. Specific reading disability (dyslexia): What have we learned in the past four decades? J Child Psychol Psychiatry. 2004;45:2–40. doi: 10.1046/j.0021-9630.2003.00305.x. [DOI] [PubMed] [Google Scholar]
- 9.Livingstone MS, Rosen GD, Drislane FW, Galaburda AM. Physiological and anatomical evidence for a magnocellular defect in developmental dyslexia. Proc Natl Acad Sci U S A. 1991;88:7943–7947. doi: 10.1073/pnas.88.18.7943. [DOI] [PMC free article] [PubMed] [Google Scholar]
- 10.Lovegrove W, Williams M. Visual temporal processing deficits in specific reading disability. In: Willows D, Kruk R, Corcos E, editors. Visual Processes in Reading and Reading Disabilities. Lawrence Erlbaum Associates, Inc; 1993. pp. 311–329. 506. [Google Scholar]
- 11.Stein JF. The magnocellular theory of developmental Dyslexia. Dyslexia. 2001;7:12–36. doi: 10.1002/dys.186. [DOI] [PubMed] [Google Scholar]
- 12.Vidyasagar TR, Pammer K. Dyslexia: A deficit in visuo-spatial attention, not in phonological processing. Trends Cogn Sci. 2010;14:57–63. doi: 10.1016/j.tics.2009.12.003. [DOI] [PubMed] [Google Scholar]
- 13.Pennington BF. From single to multiple deficit models of developmental disorders. Cognition. 2006;101:385–413. doi: 10.1016/j.cognition.2006.04.008. [DOI] [PubMed] [Google Scholar]
- 14.Pavlidis GT. Do eye movements hold the key to dyslexia? Neuropsychologia. 1981;19:57–64. doi: 10.1016/0028-3932(81)90044-0. [DOI] [PubMed] [Google Scholar]
- 15.Bucci MP, Brémond-Gignac D, Kapoula Z. Latency of saccades and vergence eye movements in dyslexic children. Exp Brain Res. 2008;188:1–12. doi: 10.1007/s00221-008-1345-5. [DOI] [PubMed] [Google Scholar]
- 16.Snowling MJ. Whurr Publishers Limited (a subsidiary of John Wiley & Sons Ltd); 2006. Language skills and learning to read: The dyslexia spectrum. Dyslexia, Speech and Language: A Practitioner's Handbook; pp. 1–14. [Google Scholar]
- 17.Floyd RA, Dain SJ, Elliott RT. Is the perception of brightness different in poor readers? Vision Res. 2004;44:221–227. doi: 10.1016/j.visres.2003.09.002. [DOI] [PubMed] [Google Scholar]
- 18.Yoonessi A, Yoonessi A. Functional assessment of magno, parvo and konio-cellular pathways; current state and future clinical applications. J Ophthalmic Vis Res. 2011;6:119–126. [PMC free article] [PubMed] [Google Scholar]
- 19.Williams MC, Lovegrove WJ. Sensory and perceptual processing in reading disability. In: Brannan J, editor. Application of Parallel Processing in Vision. Amesterdam: Elsivier Science; 1992. pp. 263–302. [Google Scholar]
- 20.Galaburda A, Livingstone M. Evidence for a magnocellular defect in developmental dyslexia. Ann N Y Acad Sci. 1993;682:70–82. doi: 10.1111/j.1749-6632.1993.tb22960.x. [DOI] [PubMed] [Google Scholar]
- 21.Lovegrove WJ, Bowling A, Badcock D, Blackwood M. Specific reading disability: Differences in contrast sensitivity as a function of spatial frequency. Science. 1980;210:439–440. doi: 10.1126/science.7433985. [DOI] [PubMed] [Google Scholar]
- 22.Eden GF, VanMeter JW, Rumsey JM, Maisog JM, Woods RP, Zeffiro TA. Abnormal processing of visual motion in dyslexia revealed by functional brain imaging. Nature. 1996;382:66–69. doi: 10.1038/382066a0. [DOI] [PubMed] [Google Scholar]
- 23.Hansen PC, Stein JF, Orde SR, Winter JL, Talcott JB. Are dyslexics' visual deficits limited to measures of dorsal stream function? Neuroreport. 2001;12:1527–1530. doi: 10.1097/00001756-200105250-00045. [DOI] [PubMed] [Google Scholar]
- 24.Pammer K, Wheatley C. Isolating the M (y)-cell response in dyslexia using the spatial frequency doubling illusion. Vision Res. 2001;41:2139–2147. doi: 10.1016/s0042-6989(01)00092-x. [DOI] [PubMed] [Google Scholar]
- 25.Wilmer JB, Richardson AJ, Chen Y, Stein JF. Two visual motion processing deficits in developmental dyslexia associated with different reading skills deficits. J Cogn Neurosci. 2004;16:528–540. doi: 10.1162/089892904323057272. [DOI] [PubMed] [Google Scholar]
- 26.Amitay S, Ben-Yehudah G, Banai K, Ahissar M. Disabled readers suffer from visual and auditory impairments but not from a specific magnocellular deficit. Brain. 2002;125(Pt 10):2272–2285. doi: 10.1093/brain/awf231. [DOI] [PubMed] [Google Scholar]
- 27.Farrag AF, Khedr EM, Abel-Naser W. Impaired parvocellular pathway in dyslexic children. Eur J Neurol. 2002;9:359–363. doi: 10.1046/j.1468-1331.2002.00410.x. [DOI] [PubMed] [Google Scholar]
- 28.Skottun BC. The magnocellular deficit theory of dyslexia: The evidence from contrast sensitivity. Vision Res. 2000;40:111–127. doi: 10.1016/s0042-6989(99)00170-4. [DOI] [PubMed] [Google Scholar]
- 29.Skoyles J, Skottun BC. On the prevalence of magnocellular deficits in the visual system of non-dyslexic individuals. Brain Lang. 2004;88:79–82. doi: 10.1016/s0093-934x(03)00162-7. [DOI] [PubMed] [Google Scholar]
- 30.Skottun BC. On using isoluminant stimuli to separate magno- and parvocellular responses in psychophysical experiments-a few words of caution. Behav Res Methods. 2013;45:637–645. doi: 10.3758/s13428-012-0290-1. [DOI] [PubMed] [Google Scholar]
- 31.Williams MJ, Stuart GW, Castles A, McAnally KI. Contrast sensitivity in subgroups of developmental dyslexia. Vision Res. 2003;43:467–477. doi: 10.1016/s0042-6989(02)00573-4. [DOI] [PubMed] [Google Scholar]
- 32.Skottun BC. Magnocellular reading and dyslexia. Vision Res. 2005;45:133–134. doi: 10.1016/j.visres.2003.09.039. [DOI] [PubMed] [Google Scholar]
- 33.Demb JB, Boynton GM, Heeger DJ. Functional magnetic resonance imaging of early visual pathways in dyslexia. J Neurosci. 1998;18:6939–6951. doi: 10.1523/JNEUROSCI.18-17-06939.1998. [DOI] [PMC free article] [PubMed] [Google Scholar]
- 34.Conlon EG, Lilleskaret G, Wright CM, Power GF. The influence of contrast on coherent motion processing in dyslexia. Neuropsychologia. 2012;50:1672–1681. doi: 10.1016/j.neuropsychologia.2012.03.023. [DOI] [PubMed] [Google Scholar]
- 35.Stein J. Visual motion sensitivity and reading. Neuropsychologia. 2003;41:1785–1793. doi: 10.1016/s0028-3932(03)00179-9. [DOI] [PubMed] [Google Scholar]
- 36.Ray NJ, Fowler S, Stein JF. Yellow filters can improve magnocellular function: Motion sensitivity, convergence, accommodation, and reading. Ann N Y Acad Sci. 2005;1039:283–293. doi: 10.1196/annals.1325.027. [DOI] [PubMed] [Google Scholar]
- 37.Brainard DH. The psychophysics toolbox. Spat Vis. 1997;10:433–436. [PubMed] [Google Scholar]
- 38.Olmos A, Kingdom F. McGill Calibrated Color Image Database. 2004a. [Last accessed on 2015 Apr 25]. Available from: http://tabby.vision.mcgill.ca .
- 39.Smith VC, Pokorny J. Spectral sensitivity of the foveal cone photopigments between 400 and 500 nm. VisionRes. 1975;15:161–171. doi: 10.1016/0042-6989(75)90203-5. [DOI] [PubMed] [Google Scholar]
- 40.Ruderman DL, Cronin TW, Chiao CC. Statistics of cone responses to natural images: Implications for visual coding. J Opt Soc Am. 1998;15:2036–2045. [Google Scholar]
- 41.Yoonessi A, Kingdom FA. Comparison of sensitivity to color changes in natural and phase-scrambled scenes. J Opt Soc Am A Opt Image Sci Vis. 2008;25:676–684. doi: 10.1364/josaa.25.000676. [DOI] [PubMed] [Google Scholar]
- 42.Raven JC, Court JH, Raven J. Standard Progressive Matrices. Oxford, UK: Oxford Psychologists Press; 1996. [Google Scholar]
- 43.Neale MD. Manual for the Neale Analysis of Reading Ability. Rev British ed. Windsor: Nfer-Nelson Publishing Company Ltd; 1989. [Google Scholar]
- 44.Valipour M. Tehran, Iran: Shahid Beheshti University; 2012. Extension of Assessment of Persian Reading Ability (APRA) Test and it' Psychometric Features [M.Sc. Dissertation] Faculty of Psychology and Educational Sciences. [Google Scholar]
- 45.Roorda A, Williams DR. The arrangement of the three cone classes in the living human eye. Nature. 1999;397:520–522. doi: 10.1038/17383. [DOI] [PubMed] [Google Scholar]
- 46.Yoonessi A, Hajihasani M, Gharibzadeh S, Zarrindast M, Yoonessi A. Efficiency of information coding in various L/M retinal cone ratios. Basic Clin Neurosci. 2012;3:22–27. [Google Scholar]
- 47.Gross-Glenn K, Skottun BC, Glenn W, Kushch A, Lingua R, Dunbar M, et al. Contrast sensitivity in dyslexia. Vis Neurosci. 1995 Feb;12:153–163. doi: 10.1017/s0952523800007380. [DOI] [PubMed] [Google Scholar]
- 48.Hagstrom SA, Neitz J, Neitz M. Variations in cone populations for red-green color vision examined by analysis of mRNA. Neuroreport. 1998;9:1963–1967. doi: 10.1097/00001756-199806220-00009. [DOI] [PubMed] [Google Scholar]
- 49.Mullen KT, Kingdom FA. Losses in peripheral colour sensitivity predicted from “hit and miss” post-receptoral cone connections. Vision Res. 1996;36:1995–2000. doi: 10.1016/0042-6989(95)00261-8. [DOI] [PubMed] [Google Scholar]
- 50.Gunther KL, Dobkins KR. Individual differences in chromatic (red/green) contrast sensitivity are constrained by the relative number of L- versus M-cones in the eye. Vision Res. 2002;42:1367–1378. doi: 10.1016/s0042-6989(02)00043-3. [DOI] [PubMed] [Google Scholar]
- 51.Sigmundsson H. Do visual processing deficits cause problem on response time task for dyslexics? Brain Cogn. 2005;58:213–216. doi: 10.1016/j.bandc.2004.11.007. [DOI] [PubMed] [Google Scholar]
- 52.Dain SJ, Floyd RA, Elliot RT. Color and luminance increment thresholds in poor readers. Vis Neurosci. 2008;25:481–486. doi: 10.1017/S0952523808080565. [DOI] [PubMed] [Google Scholar]


