Abstract
The distribution of collagen fibres plays a significant role in the mechanical behaviour of artery walls. Experimental data show that in most artery wall layers there are two (or more) in-plane symmetrically disposed families of fibres. However, a recent investigation revealed that some artery wall layers have only one preferred fibre direction, notably in the medial layer of human common iliac arteries. This paper aims to provide a possible explanation for this intriguing phenomenon. An invariant-based constitutive model is utilized to characterize the mechanical behaviour of tissues. We then use three different hypotheses to determine the ‘optimal fibre angle’ in an iliac artery model. All three hypotheses lead to the same result that the optimal fibre angle in the medial layer of the iliac artery is close to the circumferential direction. The axial pre-stretch, in particular, is found to play an essential role in determining the optimal fibre angle.
Keywords: Iliac bifurcation, Constitutive law, Collagen fibre, Fibre orientation, Remodelling, Pre-stretch, Residual stress, Total energy
1. Introduction
The collagen fibres within artery walls play a central role in the macroscopic mechanical behaviour of walls (Holzapfel et al., 2000; Gasser et al., 2006). Human common iliac arteries are of particular clinical interest as atherosclerosis-prone vessels, since they frequently undergo endovascular treatment. Iliac arteries are relatively easy to access for vascular diagnostic procedures (Schulze-Bauer et al., 2003).
Artery walls are usually composed of three distinct layers, the intima, the media and the adventitia, and it is widely accepted that variations exist in both the structural composition and the material properties of artery walls in different regions of the arterial tree, even from the same individual (Mangell et al., 1996; Holzapfel et al., 2000, 2004). Collagen fibres are key ingredients in the structure of artery walls. In most of the regions, load bearing layers such as the media and the adventitia are shown to have two (or more) in-plane symmetrically disposed families of fibres.
Continuum constitutive models of arterial layers integrate information about the tissue morphology and therefore allow investigation of the interrelation between structure and function in response to mechanical loading. Carefully constructed constitutive laws based on experiments are of critical importance for analysing the physiological and pathological load-carrying mechanisms in soft tissues (Gasser et al., 2006).
A number of experimental studies, based on polarised light microscopy of stained arterial tissue, have shed light into the detailed structural organisation of the complex three-dimensional elastin, collagen and smooth muscle arrangement within the artery wall (Canham et al., 1989; Finlay et al., 1995, 1998; Schriefl et al., 2012). These studies show not only that artery tissues are highly anisotropic, but also provide an explanation for the exponential behaviour of the tissues. The gradual recruitment of the collagen fibres, which are considered as crimped in the natural configuration, is responsible for the exponentially increased stiffness of the tissue when stretched (Roach and Burton, 1957; Lanir, 1983).
With this understanding, more advanced constitutive laws have been developed to make use of the microscopic information of artery wall structures (Holzapfel et al., 2000, 2015; Gasser et al., 2006). The anisotropic elastic energy functions proposed by Holzapfel et al. (2000) and Holzapfel and Gasser (2001) represent one category of such structure-based approaches. For example, the constitutive model of Holzapfel et al. (2000) is used to represent the ground matrix and the distinct fibre families in the artery wall. The model assumes that the fibres are symmetrically disposed relative to the axial direction and have no component in the radial direction. However, this constitutive model does not include the fibre dispersion observed in experiments, and to take account of fibre dispersions, two extended models have been developed subsequently. One of these is the ρ model (Holzapfel et al., 2005a,b) in which a constant scalar ρ is introduced to account for the fibre dispersion. The other is the κ model which is derived from a generalised structure tensor (Gasser et al., 2006). Both the ρ and the κ models are invariant based and include the effect of fibre dispersion, but unlike ρ, κ can be directly estimated from the measured fibre density distributions using, for example, polarised light microscopy (Canham et al., 1989; Finlay et al., 1995, 1998; Schriefl et al., 2012).
Most of the aforementioned studies focussed on the mechanical properties of coronary arteries (Holzapfel et al., 2005a). In this study we concentrate on the human iliac artery. This is because an exception to the fibre structure has been found in the medial layer of human common iliac arteries in the recent work by Schriefl et al. (2012). Using polarised light microscopy on stained arterial tissues, these researchers measured the layer-specific collagen fibre density distribution in human thoracic and abdominal aortas, and in common iliac arteries. They found that unlike in most of the investigated arterial layers, where there are two or more distinct families of the collagen fibres, fibres are found to be mostly parallel to the circumferential direction in the media of the human common iliac arteries. Various fibre dispersions in different layers of arteries were also reported.
The work of Schriefl et al. (2012) raises interesting questions. In particular, what determines the optimal fibre orientation? Can we explain the fibre distribution in the media of the common iliac artery from a mechanics standpoint? In this paper, we attempt to answer these questions using a combined analytical and computational approach.
We model the iliac artery using a two-layer thick-walled model, including only the media and adventitia. We use the κ model in which the effect of the fibre dispersion is taken into account. Both the axial pre-stretch and circumferential residual stress are considered. To separate the effects of the circumferential residual stress and axial pre-stress from the geometric influences, we also investigate a straight tube model with the corresponding material properties as well as the residual stress in the circumferential direction. Inflation and extension experiments are simulated numerically with a mean pressure loading at 100 mmHg, since it is the mean blood pressure that is primarily regulated physiologically (Burchell, 1968; Yu et al., 1992). For simplicity, we confine our study to static loading only. Finally, three different hypotheses are used to determine the ‘optimal fibre angle’ in the iliac artery model. Results from all three hypotheses support the experimental observation that there is probably a single fibre family in the media of human iliac arteries.
2. Methodology
This section consists of three parts: the geometric construction of the aorto-iliac bifurcation, the determination of the material parameters in the strain–energy function, and the finite element analysis of the iliac artery model.
2.1. Geometry of a 3D aorto-iliac bifurcation
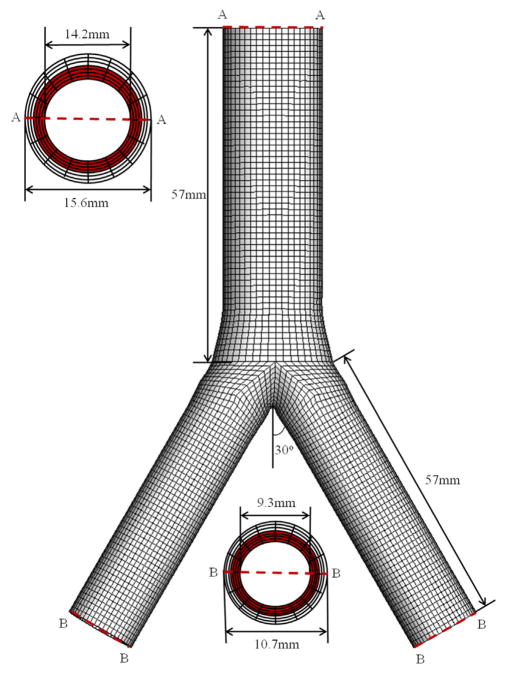
Based on human data documented in the literature (Stergiopulos et al., 1992; Olufsen, 1998; Schulze-Bauer et al., 2003; Kahraman et al., 2006), a simplified bifurcation geometry of an iliac artery is built, as shown in Fig. 1. The bifurcation is modelled so that the cross section at the end of the aorta is gradually changed from a circle to an ellipse. This is smoothly connected to the two iliac arteries via cubic spline positional polylines using Matlab (The MathWorks Inc., Natick, USA). We model the iliac bifurcation as a two-layer thick-walled structure, and the thickness ratio between the medial and adventitial layers is taken to be 4:3 (Schriefl et al., 2012). A total of seven hexahedron elements through the wall thickness is constructed, with four in the media (shown in red in Fig. 1) and three in the adventitia. Although the geometry is symmetric and the modelling could be achieved by considering a quarter of the whole section, we choose to use the whole geometry so that the modelling can be easily extended to include the fluid–structure interaction in future studies, for which the flow field can be asymmetric. We also note that the 3D simulation of the whole section is fast (within minutes on a Dell workstation with 6 CPU cores, 2.9 GHz and 32 G memory).
Fig. 1.
3D geometry of the aorto-iliac bifurcation model. The geometric information is taken from the literature. The inner and outer diameters are chosen to be 14.2 mm and 15.6 mm, respectively, for the abdominal aorta, and 9.3 mm and 10.7 mm, respectively, for the common iliac arteries, following Schulze-Bauer et al. (2003) and Kahraman et al. (2006). The length of the aorta and each iliac artery is taken to be 57 mm (Stergiopulos et al., 1992; Olufsen, 1998). The two iliac branches are assumed to deviate from the centreline of the aorta symmetrically at 30° (Shah et al., 1976; Long et al., 2000). The axial lengths of the elliptical transition region approaching from the aorta and the iliac branches are 9 mm and 15 mm, respectively. (For interpretation of the references to colour in this figure caption, the reader is referred to the web version of this paper.)
2.2. Constitutive model
The model of Holzapfel et al. (2000) assumes that the strain–energy function Ψ is the sum of an isotropic potential Ψiso associated with the ground matrix and an anisotropic potential Ψaniso associated with the embedded families of perfectly aligned collagen fibres (Holzapfel and Weizsäcker, 1998). Assuming that the artery material is incompressible, we have the local volume ratio J = det F = 1, where F is the deformation gradient relative to the unloaded configuration. We also assume that the two fibre families are aligned in the directions of the unit vectors a01 and a02 in the unloaded configuration. These are symmetric and lie in the tangent plane (no radial component). Let λr, λθ and λz be the principal stretches in the cylindrical system. Then, the strain–energy function1 associated with the right Cauchy–Green tensor C = FTF is
| (1) |
with the I4 term only included if I4>1 and the I6 term only included if I6>1. The constants c>0, k1>0 are stress-like material parameters and k2>0 is a dimensionless material parameter. The invariants are I1 = tr C, I4 = a01 · (Ca01), and I6 = a02 · (Ca02), where I4 and I6 represent the squared stretches in the fibre directions a01 and a02 respectively. For the walls of most large arteries, these two fibre families are located symmetrically about the axial direction, so that, for the deformation considered here, , where β denotes the angle between a01 (or a02) and the circumferential direction of the artery.
The κ model extends the model of Holzapfel et al. (2000) by changing the anisotropic part to (Gasser et al.,2006)
| (2) |
where
and κ ∈ [0, 1/3] is a dispersion parameter (the same for each fibre family). Notice that when κ = 0, the κ model is the same as the one published in Holzapfel et al. (2000), and when κ = 1/3 we recover an isotropic potential similar to that used in Demiray (1972).
The Cauchy stress tensor is given by
| (3) |
where p is a Lagrange multiplier, and I is the identity tensor, and for the considered model this is given by
| (4) |
in which b = FFT is the left Cauchy–Green tensor and ai = Fa0i, i = 1, 2.
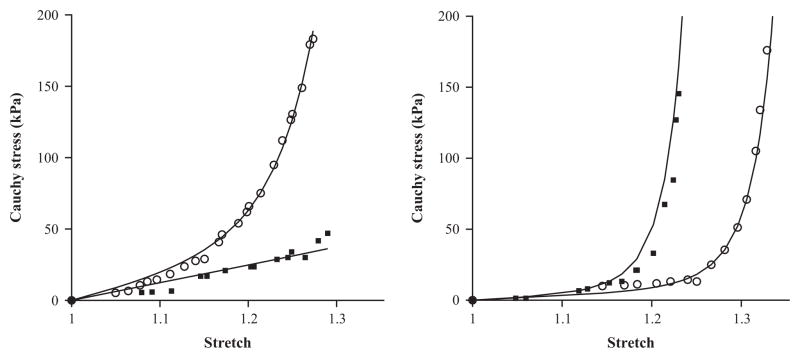
The fitting procedure is the standard Levenberg–Marquardt algorithm (Moré, 1978) and it is realized using the Matlab function lsqnonlin. The parameters obtained are found to be unique when we select suitable upper and lower bands for the searching ranges in the algorithm (e.g., c0, k1, k2 ∈ [0, 10 000], κ ∈ [0, 1/3]). The fitted material and structural parameters of a representative human iliac artery referring to the medial and adventitial layers are given in Table 1, with the azimuthal angles βj, j = M, A determined from biaxial experiments (Schriefl et al., 2012). We assume that the material properties of the abdominal aorta are the same as for the descending common iliac arteries. Fig. 2 shows a comparison between the experimental data and the fitted results obtained from the κ model in Eq. (2) for both the circumferential and axial directions of the medial and adventitial layers in the iliac artery. The ‘goodness of fit’, as defined in Schulze-Bauer et al. (2003) and Schriefl et al. (2012), is 0.09 and 0.16, respectively. Note that the axial stress–strain curve in the medial layer is not significantly exponential (it appears to be almost linear). This is presumably because the fibres are more aligned towards the circumferential direction, hence do not contribute much to the exponential term in the axial direction, particularly when the stretch is smaller than 1.25.
Table 1.
Layer-specific material and structural parameters for a human common iliac artery based on the κ model.
| Parameters | c (kPa) | k1 (kPa) | k2 | κ | βj, j = M, A (deg) |
|---|---|---|---|---|---|
| Media | 20.99 | 29.34 | 19.33 | 0.20 | 0 |
| Adventitia | 8.74 | 55.09 | 328.27 | 0.26 | 53.8 |
Fig. 2.
The circumferential and axial stress–stretch responses of the medial (left) and the adventitial (right) layers of a human iliac artery fitted to experimental data. The experimental data shown in symbols (circumferential: circle; axial: square) are from sample no. IV in Holzapfel et al. (2004). The parameters used are listed in Table 1.
2.3. Finite element simulation
The finite element simulations are performed using the commercially available finite element package (ABAQUS, 2013). For a typical simulation we use a total of 54 096 hexahedron elements (C3D8H: linear elements using a hybrid formulation) for a bifurcation model, with 19 152 elements for the aorta, and 17 472 for each branch of the common iliac artery. The grid size is chosen following a grid independence test (simulations were run for increasingly refined grids until the results converged). Each branch of the bifurcation is subjected to an in vivo axial pre-stretch of λz = 1.07 (Schulze-Bauer et al., 2003), defined as the ratio of in situ length to ex situ length (Schulze-Bauer et al., 2003; Holzapfel et al., 2007), and a transmural physiological mean pressure of 100 mmHg (Holzapfel et al., 2000; Schulze-Bauer et al., 2003; Ohayon et al., 2005). The circumferential displacements of the inlet and outlets are fixed by setting these to zero in the locally cylindrical coordinate systems.
The simulation was run with different alignments of the fibres in the media of the descending iliac artery between βM = 0° and 50°. The upper limit of 50° is used as it is widely accepted that the medial layer tends to support more circumferential than axial stresses, because the fibre orientation is closer to the circumferential direction than the axial direction (Schriefl et al., 2012). When βM = 0°, the two families of fibres merge to a single family aligned in the circumferential direction. Except in the energy optimisation method discussed below, in all other simulations the fibre angle βA of the adventitia is fixed at 53.8°, following measurements documented in Schriefl et al. (2012).
3. Criteria to determine the optimal angle
In order to determine the optimal fibre angle, we consider three different hypotheses that may explain the optimal fibre orientation in iliac arteries. These are based on the uniformity factor of the transmural stress distribution, stress-driven remodelling, and energy arguments.
3.1. Hypothesis I: uniformity factor
This approach assumes that the fibres are aligned so that, under the mean pressure and an axial pre-stretch, the transmural gradient of the maximum principal Cauchy stress σθ is minimised. This is a hypothesis initially proposed by Fung (1983) based on experimental observations of arteries. The advantage of a uniform stress in physiological terms is that cells within tissues are in a homeostatic state of stress, maintained by the biological remodelling process (Artmann and Chien, 2008). To start with, we assume that the unloaded configuration is stress-free (but this assumption is discarded in Section 3.1.2). In accordance with Holzapfel and Gasser (2007), the distributions of these stresses are considered across the deformed wall thickness (including the medial and the adventitial layers). To quantify the uniformity of the circumferential stress throughout the artery wall, we adopt the definition of the standard deviation as the uniformity factor (UF) (Delfino et al., 1997), i.e.
| (5) |
where σθn is the maximum circumferential Cauchy stress of the nth sampling point through the iliac artery wall (the daughter branches) and σ̄θ is the mean value of σθn across the wall. The number of sampling points N herein is chosen to be 7.
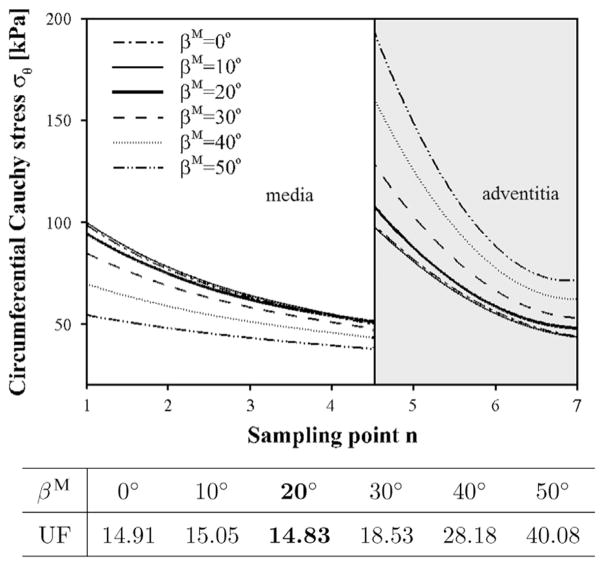
The transmural stress distributions at the pre-stretch of 1.07 are plotted in Fig. 3, indicating a distinct jump between the medial and adventitial layers. This agrees with published works (Gao et al., 2006; Holzapfel and Gasser, 2007), and is caused by the fact that different material parameters are used for the medial and adventitial layers. The overall transmural stress distribution across the two layers is the most uniform for βM = 20°, though the difference is small compared with that for βM = 0°.
Fig. 3.
Transmural stress distribution σθ at different medial fibre angle alignments. The x-axis shows the sampling point n from the inner to the outer radius. The curves of the circumferential stress σθ are interpolated from the centre points of the finite elements. The thick solid curve at βM = 20° is shown to be more uniform than all other angles since its UF value is the smallest, as shown in the table.
3.1.1. Comparison between the bifurcation and the tube structure
To distinguish the effect of the pre-stretch from the bifurcation geometry, the simulations were run for several axial pre-stretches in addition to the physiological value of λz = 1.07, for both the bifurcation and the straight tube structure. All other parameters and loading conditions are kept the same as for the tube model. The best (meaning the stress is most uniform at that angle for the number of angles studied) fibre angles from the UF criterion are listed in Table 2.
Table 2.
Best fibre angles with different pre-stretches for the bifurcation and the tube structure.
| λz | 1.05 | 1.07 | 1.08 | 1.09 | 1.10 | 1.12 | 1.20 |
|---|---|---|---|---|---|---|---|
| Bifurcation structure | 30° | 20° | 10° | 0° | 0° | 0° | 0° |
| Tube structure | 30° | 20° | 10° | 0° | 0° | 0° | 0°–10° |
Interestingly, Table 2 shows that the best fibre angles of the bifurcation and the tube structure are very similar. In other words, the effect of the pre-stretch seems to be much more important than the geometrical effects since, for a given pre-stretch, the best fibre angle is basically the same in either the bifurcation or the tube model under this hypothesis. This important observation suggests that we may now focus on the effects of the pre-stretch using the tube model for which the analytical solutions can be easily derived.
3.1.2. Effect of the circumferential residual stress
Since Table 2 shows that the optimal fibre angle is 20°, and not 0°, it suggests that our UF model has not captured all the important factors. One possibility is due to the fact that the unloaded configuration is not stress free as we have assumed in our previous calculation. Several studies have shown that the circumferential residual stress can change the stress distribution through the thickness (Chuong et al., 1986; Takamizawa and Hayashi, 1987; Delfino et al., 1997; Greenwald et al., 1997; Auricchio et al., 2014).
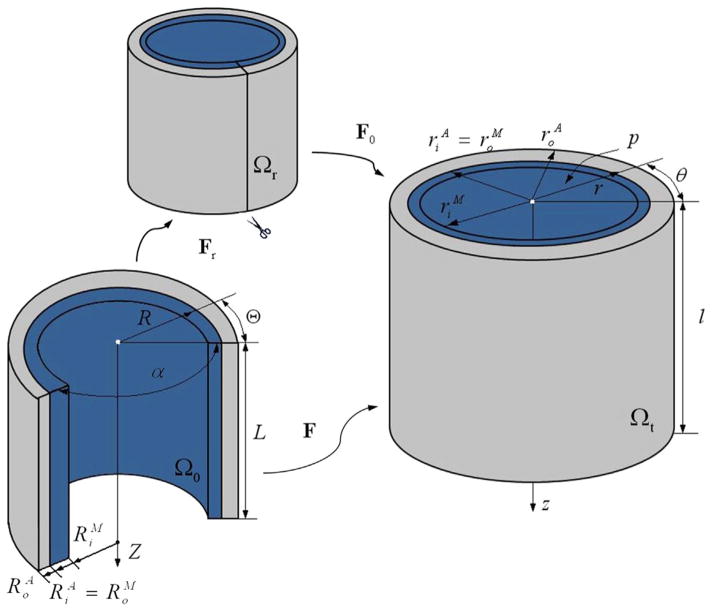
To address this issue we introduce a circumferential residual stress based on the opening angle method (Chuong and Fung, 1986). Let α denote the opening angle in the reference configuration, as depicted in Fig. 4. Then, in terms of cylindrical polar coordinates (R, Θ, Z), the geometry of the tube is defined by
| (6) |
where and denote the inner radius of the medial layer and the outer radius of the adventitial layer, respectively, while L is the length of the undeformed sector. For continuity, we also have . Note that the opening angle identified in Fig. 4 differs from the definition used in Fung and Liu (1989) and Zulliger et al. (2004).
Fig. 4.
Cylindrical artery wall in the stress-free configuration Ωr, the unloaded configuration Ω0, and the current configuration Ωt, replotted following Waffenschmidt and Menzel (2014).
In terms of coordinates (r, θ, z), the geometry of the current configuration is given by
| (7) |
where and l denote the inner and the outer radius and the length of the deformed tube, respectively, with .
The deformation gradient F is then the composition of the deformation gradient F0 relative to the unloaded configuration, and Fr relative to the stress-free configuration, as indicated in Fig. 4. Thus,
| (8) |
Using the cylindrical coordinates we have x = rer + zez, where (er, eθ, ez) are the unit basis vectors in the current configuration. For our problem
| (9) |
where λz is the (constant) axial pre-stretch, and k = 2π/(2π − α).
By incompressibility, λrλθλz = 1. Hence, we have
| (10) |
The deformation gradient is then
| (11) |
with λm, m = r, θ, z being the principal stretches in the radial, circumferential and axial directions, respectively, and Em, m = R, Θ, Z, are the unit basis vectors in the reference configuration. In the absence of body forces and by assuming no external pressure, the internal pressure P is
| (12) |
where σθ and σr are the principal Cauchy stresses in the circumferential and the radial directions, respectively.
We need to make one assumption on the kinematics in order to make progress. To be specific, we assume that the wall thickness does not change between the initial and the stress-free configuration, following the studies of Delfino et al. (1997) and Holzapfel et al. (2000), and by making use of the incompressibility condition, we obtain
| (13) |
where Ro = Ri + H and ro = ri + H, and H is the wall thickness. This allows us to solve Eq. (12) numerically using a Gaussian integration scheme (Holzapfel et al., 2000). The geometrical parameters used in the simulations are summarised in Table 3.
Table 3.
Geometrical parameters used for the iliac artery, chosen from Schulze-Bauer et al. (2003), Kahraman et al. (2006) and Schriefl et al. (2012). As no measured opening angle is available for human iliac arteries, the corresponding opening angle of rat is used (Fung, 1991; Holzapfel et al., 2000) for both the medial and the adventitial layers.
| Parameter | Description | Value
|
|
|---|---|---|---|
| Media | Adventitia | ||
| H (mm) | Wall thickness | 0.8 | 0.6 |
| Ri (mm) | Inner referential radius | 8.9 | 9.7 |
| Ro (mm) | Outer referential radius | 9.7 | 10.3 |
| ri (mm) | Inner current radius | 4.7 | 5.5 |
| ro (mm) | Outer current radius | 5.5 | 6.1 |
| α (deg) | Opening angle | 160 | 160 |
Table 4 illustrates that the minimum value of UF is reached when the optimal fibre angle is around 0° at the pre-stretch 1.07 after including the circumferential stress. This now agrees with the experiments. It also shows the minimum value of UF at different values of λz, which indicates a strong dependence of optimal βM on λz. It seems that the medial fibres tend to be aligned in the circumferential direction when the pre-stretch is below 1.14. However, βM increases sharply (>30°) for λz>1.15 and the transmural stress distribution becomes more uneven. This is probably the reason why in human samples the corresponding angular derivation of the mean fibre angle in the media of iliac artery is close to 0° (Schriefl et al., 2012).
Table 4.
Minimum value of UF and corresponding βM obtained for different values of pre-stretch λz, when including the opening angle (α=160°).
| λz | 1.00 | 1.05 | 1.07 | 1.10 | 1.14 | 1.15 | 1.17 | 1.20 |
|---|---|---|---|---|---|---|---|---|
| βM | 0° | 0° | 0° | 0° | 0° | 30° | 41° | 57° |
| UFmin | 12.84 | 38.00 | 48.48 | 59.75 | 69.95 | 71.80 | 72.98 | 73.13 |
3.2. Hypothesis II: stress-driven remodelling
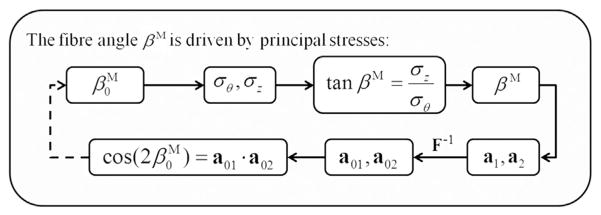
This hypothesis assumes that the fibres adapt during the remodelling process so that the artery layers have optimal load-bearing capability. Here we adopt a simple stress-driven remodelling model proposed by Hariton et al. (2007), which assumes that the two families of collagen fibres are aligned between the principal stretch directions as dictated by the ratio of the magnitudes of the two largest principal stresses σθ and σz (Driessen et al., 2004; Hariton et al., 2007). In the present study, only the collagen fibre orientation in the medial layer is adjusted due to the remodelling process. Since remodelling requires the solution of an inverse problem, an iterative finite element based procedure is developed, as shown in Fig. 5.
Fig. 5.
Inverse procedure for determining the fibre orientation using the stress-driven criterion. This process converges to the solution for any values of between 0° and 50°.
The Cauchy stress is given by
where σm (m = r, θ, z) are the principal Cauchy stresses and em (m = r, θ, z) are the principal directions. Following Driessen et al. (2004) and Hariton et al. (2007), we assume that the angle βM of alignment between the fibre direction obeys
| (14) |
whereby the fibres are assumed to be in the plane spanned by the vectors aligned with the two largest principal stresses, and the collagen fibres are symmetrically aligned relative to eθ, the direction of the maximal principal stress. The unit vectors along the two families of collagen fibres are, in the current configuration,
and in the reference configuration,
The updated fibre alignment in the reference configuration is then calculated from
The remodelling procedure terminates when the maximal absolute variance of the mean fibre orientation between the current and last steps converges to a set tolerance, i.e. smaller than 0.01°. For each iteration, we assume the artery is in a quasi-static condition.2
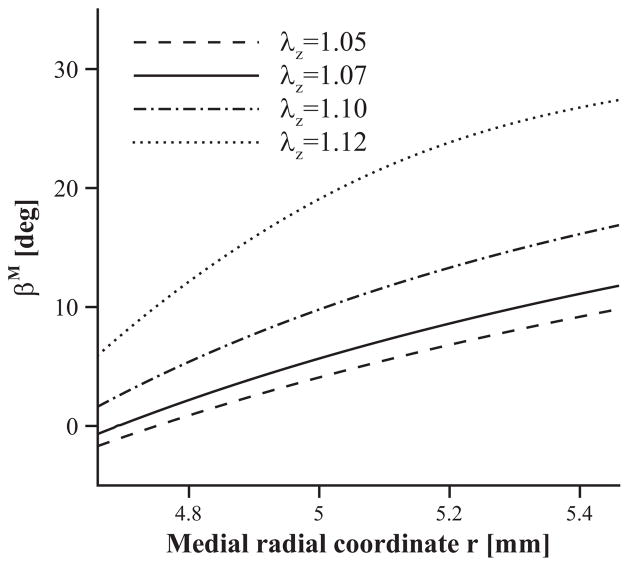
Fig. 6 provides the results of the remodelling process with the circumferential residual stress. The mean fibre orientation across the artery wall of the medial layer is 6.3° at a pre-stretch of λz = 1.07. The result is reasonably close to zero degrees and suggests that the fibres are mostly circumferentially oriented. The influence of the axial pre-stretch is also shown in Fig. 6. On the whole, the values of the fibre angle increase with λz, while the range of βM becomes wider when λz becomes larger. Note that if λz is assigned an even larger number (for example, λz = 1.13), the iterative system becomes unstable, and it is difficult to find converged solutions. This is because the fibre angle update is determined by the ratio between the maximal and the second principal stresses. When the pre-stretch is greater than 1.13, the maximal principal stress changes from the circumferential stress to axial stress. At the transition phase, the iteration is oscillating between those two stresses. It would appear that for λz>1.13, there should be a change in the remodelling criter-ion. However, since the physiological value of λz is less than 1.13, we do not pursue this further. The negative fibre angles proximal to the inner radius are due to the flip-over of the two fibre directions. Though uniformly stretched, the inner wall in the axial direction is under compression, in other words, the medial principal stresses σz<0, and consequently, the βM given by Eq. (14) changes its sign. The marginal differences in the optimal angles compared with the UF criterion may be due to the oversimplified criterion of the remodelling model used.
Fig. 6.
Dependence of the remodelled fibre orientation (characterized by βM) on the medial radial coordinate r as a function of the axial pre-stretch given as 1.05 (dashed), 1.07 (solid), 1.10 (dash-dotted) and 1.12 (dotted). Residual strains are included (α = 160 deg).
3.3. Hypothesis III: energy minimisation
We now determine the optimal fibre orientation based on the energy argument recently proposed by Waffenschmidt and Menzel (2014), which assumes that the fibres are aligned so that the minimum of total potential energy Π is maximised with respect to βM and βA. For a hyperelastic material, Π is the sum of the elastic strain energy Πint stored in the deformed body and the potential energy Πext of the applied forces, expressed as Π = Πint + Πext + const. The main objective is to access information on preferred material, structural and loading parameters that are associated with the extremal states of the total energy, and to use these to identify the favourable configurations for the design and adaptation of artery walls. Specifically, the total energy for a tube model can then be expressed as
| (15) |
Note that λz is prescribed, and with the incompressibility condition λrλθλz = 1 the strain energy Ψ is a function of βM, βA, λθi and α, where λθi is the inner circumferential stretch.
Since the equilibrium of the system also requires the minimisation of the total strain energy in terms of displacements, the optimisation of the total energy is the result of maximising all the permissible minimised total energies. The solution of the underlying boundary-value problem is obtained by the optimisation of Π. The deformation variables (λθi, α) firstly minimise the total energy, which results in the triple ( , αmin, Πmin). Subsequently, a set of values of Πmin corresponding to the states of equilibrium for which Πmin is maximised to render the optimal material parameters ( ), i.e.
| (16) |
The reader is referred to Waffenschmidt and Menzel (2014) for the detailed algorithm that determines the functional Π in Eq. (15). The physical interpretation of Eq. (16) suggests that in an arterial tissue the fibres adapt to be aligned so that the tissue’s loading capacity is maximised. Thus, the internal energy is maximised among the minimised values of Π, in the case of Dirichlet boundary conditions.
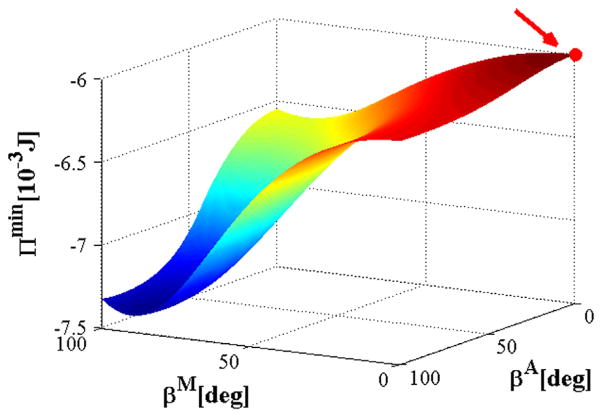
Fig. 7 shows the variation of the total potential energy Π in the parameter space of βM and βA. It is evaluated numerically at the physiological pressure of 13.33 kPa and the axial stretch of 1.07. In Fig. 7 the maximum value of Πmin is indicated by a red dot, which occurs at βM = 0°. This is consistent to the results from the previous two hypotheses. The value of βA is discussed in the next section.
Fig. 7.
Values of Πmin plotted against βA and βM. The red dot indicates the maximum value of Πmin. (For interpretation of the references to colour in this figure caption, the reader is referred to the web version of this paper.)
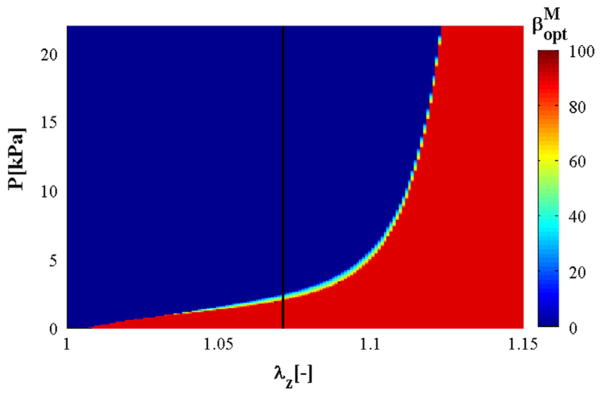
Following Waffenschmidt and Menzel (2014), we also plot the relation between the axial stretch λz, the internal pressure P and the optimal medial fibre angle in Fig. 8, with the colour bar referring to the optimal value of . It is clear that in a wide range of physiological pressure, the optimal fibre angle is oriented towards the circumferential direction, i.e. . However, if λz >1.12, then there is a sudden change of fibre alignment from the circumferential to the axial direction, i.e. , irrespective of the pressure magnitude.
Fig. 8.
Relation between the axial stretch λz, internal pressure P, and optimal medial fibre angle , as indicated by the colour bar. The black solid line highlights the variation of with P at λz = 1.07; for a wide range of pressure ( ). (For interpretation of the references to colour in this figure caption, the reader is referred to the web version of this paper.)
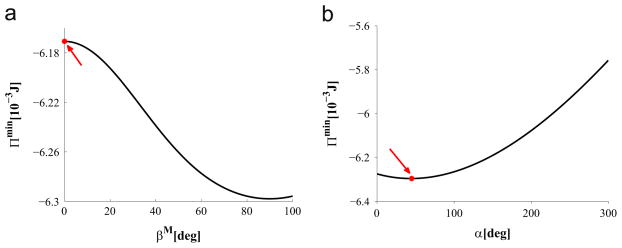
If we assign βA = 53.8° (Schriefl et al., 2012), then the results are similar to the previous two hypotheses, as shown in Fig. 9(a). In particular, we have , λθi =1.23, and α = 45°.
Fig. 9.
(a) Πmin versus βM, with the red dot denoting when Πmin reaches its maximum; (b) Πmin versus α, with the red dot denoting the optimal position at α = 45 deg when Π is minimised. (For interpretation of the references to colour in this figure caption, the reader is referred to the web version of this paper.)
4. Discussion
The main result of this paper is to show that by using each of the three different hypotheses there seems to be an optimal mean fibre angle in the media of the human iliac artery in the circumferential direction, as observed in recent experiments of Schriefl et al. (2012). Since we only performed a static analysis, the agreement with experiments seems to suggest that the fibre alignments are dominantly influenced by the static mean physiological loading. In order to accurately estimate the fibre angle we need to include the residual stress effect in the UF approach since the arteries do not recover to the zero-stress configuration when unloaded.
In the first two approaches the fibre orientation of the adventitia is fixed. However, with the energy optimisation method, all parameters can be estimated including the opening angle α and the adventitial mean fibre orientation βA. In all simulations, the importance of the pre-stretch in the determination of the fibre orientation is found to be paramount. This and several other issues are discussed in more detail below.
4.1. Role of pre-stretch
Our simulations suggest that the iliac artery has only one family of fibres in the media with preferred circumferential direction. Hence, it is useful to ask what is so special about the iliac artery when compared to the aorta where two families of fibres are always present in each layer? The main explanation, as suggested by our results, comes from the significance of the pre-stretch. In particular, the typical pre-stretch in an iliac artery is around 1.07, yet in most of the large arteries such as the aorta and the carotid artery the pre-stretch is normally larger than 1.1 (Han and Fung, 1995; Holzapfel et al., 2000, 2007; Gasser et al., 2002; Holzapfel and Gasser, 2007; Cardamone et al., 2009).
Indeed, when we apply the UF criterion to rabbit carotid arteries using the data from Holzapfel et al. (2000), with the physiological value of pre-stretch 1.6, we find the optimal medial fibre angle of 31° (see UFs in Table 5), which is close to the average experimental results of 29° (Holzapfel et al., 2000).
Table 5.
Optimal medial fibre angle βM and corresponding UFmin at various values of pre-stretches λz for a rabbit carotid artery.
| λz | 1.10 | 1.40 | 1.45 | 1.50 | 1.55 | 1.60 | 1.65 | 1.70 |
|---|---|---|---|---|---|---|---|---|
| βM | 0° | 0° | 0° | 2° | 13° | 31° | 42° | 50° |
| UFmin | 49.79 | 71.86 | 75.62 | 79.29 | 82.65 | 83.82 | 81.52 | 74.92 |
Incidentally, the optimal fibre angles of the rabbit carotid artery would also be oriented towards the circumferential direction if the pre-stretches are below 1.45.
We speculate that the reason for the lower value of the pre-stretch of the iliac artery is partially due to the branching structure, though not all bifurcating arteries have sufficiently low pre-stretch to develop a single fibre family. The spatial variation of the pre-stretch along the arterial tree must have been developed optimally through a complex remodelling process under the overall loading conditions, including the dynamic pressure, gravity and fluid–structure interactions, with the interplay of local artery geometries and material properties. For example, in a human carotid bifurcation, the pre-stretch of the layer specific parent branch is very similar to that of the two daughter branches (Sommer et al., 2010). It will be interesting to see more experimental data which may establish a clearer relationship between the pre-stretch and the fibre orientation.
4.2. Opening angle in the human iliac artery
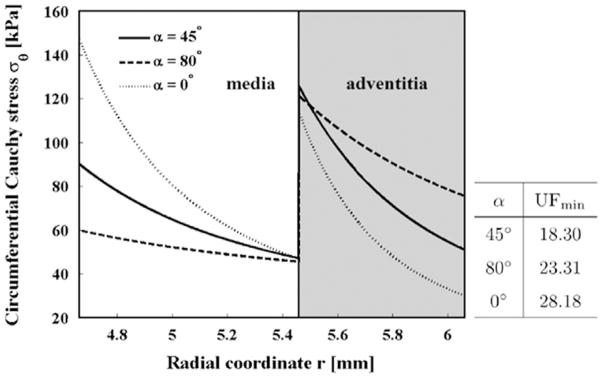
The energy optimisation method suggests that the optimal opening angle α is around 45° for a human iliac artery, as shown in Fig. 9(b). This is considerably lower than the published opening angle of 160° found in a rat iliac artery (Fung, 1991; Holzapfel et al., 2000). Since we have no experimental data available to validate this finding, we measured the opening angle in swine iliac arteries of seven healthy adult swines, following the procedure described by Han and Fung (1991) and Han et al. (2006). This measurement confirmed that the opening angle in the swine iliac artery is around 80°. As the swine anatomy bears some similarity to that of the human anatomy, this seems to support our modelling prediction of a smaller human opening angle of 45°. Using the opening angle 45° in the UF approach, we obtained a similar medial fibre angle to that of using 160° (rat), as shown in Table 6. The corresponding stress distributions with and without the opening angles are shown in Fig. 10, which demonstrates that, with the residual stress, the stress distribution is more uniform. This is consistent with the results of Holzapfel et al. (2000).
Table 6.
Optimal medial fibre angle βM at various values of the pre-stretch λz for human iliac arteries when the opening angle is set to 45°.
| λz | 1.07 | 1.10 | 1.16 | 1.17 | 1.18 | 1.19 | 1.20 |
|---|---|---|---|---|---|---|---|
| βM | 0° | 0° | 0° | 30° | 42° | 50° | 55° |
| UFmin | 18.30 | 34.89 | 60.41 | 62.23 | 62.73 | 62.81 | 62.89 |
Fig. 10.
Transmural stress distribution σθ at different opening angles. The x-axis shows the radial coordinate across the medial and adventitial layers. The stress distribution becomes more uniform when the residual stress (α ≠ 0°) is included.
Indeed, we have used a number of different opening angles and found that the results are unchanged once the opening angle α is larger than 20°.
This suggests that although the fibre orientation determined by the UF method requires the residual stress to be included, the final result is not sensitive to the changes of the opening angle as long as the opening angle is larger than a certain value.
Indeed, the zero fibre angle in the medial layer holds true for a wide range of opening angles, which makes sense since the in vivo physiological residual stress must fluctuate due to the complex remodelling processes.
4.3. Adventitia fibre orientation βA
In most of the simulations we have fixed the fibre angle βA in the adventitial layer. However, with the energy optimisation hypothesis, the estimated βA is 0°, which disagrees with the experimental measurement of 53.8°. In fact, Fig. 7 shows that the maximum value of Πmin is insensitive to the variation of βA; the curve of Πmin at βM = 0 is rather flat for the whole range of βA. This finding is consistent with the results on carotid arteries (Waffenschmidt and Menzel, 2014), and suggests that the energy optimisation method alone is not sufficient to determine βA. Besides, the minor influence of βA on the determination of the optimal fibre orientation in the medial layer is further confirmed via the sensitivity test under the other two hypotheses.
At this point, it is worth noting that Spencer et al. (1975) considered a circular cylindrical tube of incompressible ideal fibre-reinforced material in which the reinforcement throughout its thickness is directed along two families of helices making angles of ±βA. Of particular importance, they argued that , so that βA = 54.7° in order to avoid the narrow bands of stress concentration near the surfaces at the inner and outer radii. This value is surprisingly similar to the adventitial fibre angle measured in experiments (Holzapfel et al., 2000; Schriefl et al., 2012). However, this should be viewed with caution since the presence of fibres is not exactly equivalent to the inextensible case of Spencer et al. (1975), and hence the agreement on the value of βA could be a coincidence.
4.4. Limitations
We identified that the κ model is able to capture the mechanical response of the iliac artery, as, for example, documented in Holzapfel et al. (2004). The parameters of the constitutive models, especially the structural parameter κ as introduced in Gasser et al. (2006), are obtained by means of the Levenberg–Marquardt algorithm. With the development of advanced experimental techniques, this particular parameter can be directly estimated from the measured fibre distribution density by, e.g. a π-periodic von Mises distribution (Gasser et al., 2006). However, such estimates are often different from the fitted values for the human iliac arteries (Schriefl et al., 2012). An improved description of the mechanics of artery walls at the microscopic level which can incorporate fibre–fibre interactions, fibre recruitment and viscoelasticity (Stylianopoulos and Barocas, 2007; Maceri et al., 2010; Weisbecker et al., 2015) will be required in future in order to make full use of the experimental data.
Other limitations include the fact that we have only performed a static analysis. For the residual stresses, we have used the same constant parameters for the two layers of the artery wall. The stress-free configuration changes over time so that the opening angles for the medial and adventitial layers and an intact artery ring vary significantly (Fung and Liu, 1989; Holzapfel et al., 2005a; Sommer and Holzapfel, 2012). Although the present study reveals the potential link between the fibre orientation and the pre-stretch, we are yet unable to explain the reason for requiring different values of the pre-stretch in different sections of arteries. Therefore, enhanced systematic studies including the dynamic loading, fluid–structure interaction, and possibly tissue remodelling at the cellular level as well as measurements of fibre angles and pre-stretches for other arteries are required.
5. Conclusion
From a mechanical point of view, we have suggested an explanation for the rather unusual fibre distribution in the medial layer of the human common iliac artery. Three approaches have been used, namely a uniform distribution of the transmural stress, fibre stress remodelling, and optimisation of the total energy. All three approaches suggest that the optimal fibre angle in the medial layer of human iliac arteries is zero relative to the circumferential direction, as documented in Schriefl et al. (2012). In particular, we have found that the axial pre-stretch is key for explaining the optimal fibre distribution, and the particularly low value in the iliac artery is directly associated with the single fibre family. Moreover, we have shown the necessary involvement of the residual stress when utilising the UF approach, and speculate that the opening angle in human iliac artery is around 45°. Finally, it is likely that the optimal fibre angle in the adventitia is determined by a different optimisation principle to that of the medial layer such as dynamic loading and fluid–structure interaction, which is a topic for a future study.
Acknowledgments
We are grateful for funding provided by the UK EPSRC (EP/I1029990). Dr. Haichao Han was partially supported by HL 095852 from NIH. We thank Mr. Kyanoosh Broumand and Dr. Yangming Xiao for sharing the data on opening angles obtained from swine.
Footnotes
Note, this strain–energy function is designed as an incompressible formulation. A modified version of Eq. (1) with an isochoric/volumetric split is used in the finite element implementation.
The term ‘quasi-static’ means that we perform a static analysis because the loading variation with respect to time is considered to be slow.
References
- ABAQUS. 6.13. Analysis Users Guide. Dassault Systémes; 2013. [Google Scholar]
- Artmann GM, Chien S. Bioengineering in Cell and Tissue Research. Springer-Verlag; Berlin Heidelberg: 2008. [Google Scholar]
- Auricchio F, Conti M, Ferrara A. How constitutive model complexity can affect the capability to fit experimental data: a focus on human carotid arteries and extension/inflation data. Arch Comput Methods Eng. 2014;21(3):273–292. [Google Scholar]
- Burchell RC. Physiology of internal iliac artery ligation. BJOG: Int J Obstet Gynaecol. 1968;75(6):642–651. doi: 10.1111/j.1471-0528.1968.tb00175.x. [DOI] [PubMed] [Google Scholar]
- Canham PM, Finlay HM, Dixon JG, Boughner DR, Chen A. Measurements from light and polarised light microscopy of human coronary arteries fixed at distending pressure. Cardiovasc Res. 1989;23(11):973–982. doi: 10.1093/cvr/23.11.973. [DOI] [PubMed] [Google Scholar]
- Cardamone L, Valentin A, Eberth JF, Humphrey JD. Origin of axial prestretch and residual stress in arteries. Biomech Model Mechanobiol. 2009;8(6):431–446. doi: 10.1007/s10237-008-0146-x. [DOI] [PMC free article] [PubMed] [Google Scholar]
- Chuong CJ, Fung YC. Residual stress in arteries. In: Schmid-Schönbein GW, Woo SL-Y, Zweifach BW, editors. Frontiers in Biomechanics. Springer-Verlag; New York: 1986. pp. 117–129. [Google Scholar]
- Delfino A, Stergiopulos N, Moore JE, Meister JJ. Residual strain effects on the stress field in a thick wall finite element model of the human carotid bifurcation. J Biomech. 1997;30(8):777–786. doi: 10.1016/s0021-9290(97)00025-0. [DOI] [PubMed] [Google Scholar]
- Demiray H. A note on the elasticity of soft biological tissues. J Biomech. 1972;5(3):309–311. doi: 10.1016/0021-9290(72)90047-4. [DOI] [PubMed] [Google Scholar]
- Driessen NJ, Wilson W, Bouten CV, Baaijens FP. A computational model for collagen fibre remodelling in the arterial wall. J Theoret Biol. 2004;226(1):53–64. doi: 10.1016/j.jtbi.2003.08.004. [DOI] [PubMed] [Google Scholar]
- Finlay HM, McCullough L, Canham PB. Three-dimensional collagen organization of human brain arteries at different transmural pressures. J Vasc Res. 1995;32(5):301–312. doi: 10.1159/000159104. [DOI] [PubMed] [Google Scholar]
- Finlay HM, Whittaker P, Canham PB. Collagen organization in the branching region of human brain arteries. Stroke. 1998;29(8):1595–1601. doi: 10.1161/01.str.29.8.1595. [DOI] [PubMed] [Google Scholar]
- Fung YC. What principle governs the stress distribution in living organs? Biomechanics in China, Japan, and USA. Proceedings of Wuhan Conference; Beijing, China: Science Press; 1983. [Google Scholar]
- Fung YC. What are the residual stresses doing in our blood vessels? Ann Biomed Eng. 1991;19(3):237–249. doi: 10.1007/BF02584301. [DOI] [PubMed] [Google Scholar]
- Fung YC, Liu SQ. Change of residual strains in arteries due to hypertrophy caused by aortic constriction. Circ Res. 1989;65(5):1340–1349. doi: 10.1161/01.res.65.5.1340. [DOI] [PubMed] [Google Scholar]
- Gao F, Watanabe M, Matsuzawa T. Stress analysis in a layered aortic arch model under pulsatile blood flow. BioMed Eng OnLine. 2006;5(25):1–11. doi: 10.1186/1475-925X-5-25. [DOI] [PMC free article] [PubMed] [Google Scholar]
- Gasser TC, Ogden RW, Holzapfel GA. Hyperelastic modelling of arterial layers with distributed collagen fibre orientations. J R Soc Interface. 2006;3(6):15–35. doi: 10.1098/rsif.2005.0073. [DOI] [PMC free article] [PubMed] [Google Scholar]
- Gasser TC, Schulze-Bauer CA, Holzapfel GA. A three-dimensional finite element model for arterial clamping. J Biomech Eng. 2002;124(4):355–363. doi: 10.1115/1.1485284. [DOI] [PubMed] [Google Scholar]
- Greenwald SE, Moore JE, Rachev A, Kane TPC, Meister JJ. Experimental investigation of the distribution of residual strains in the artery wall. J Biomech Eng. 1997;119(4):438–444. doi: 10.1115/1.2798291. [DOI] [PubMed] [Google Scholar]
- Han HC, Fung YC. Species dependence of the zero-stress state of aorta: pig versus rat. J Biomech Eng. 1991;113(4):446–451. doi: 10.1115/1.2895425. [DOI] [PubMed] [Google Scholar]
- Han HC, Fung YC. Longitudinal strain of canine and porcine aortas. J Biomech. 1995;28(5):637–641. doi: 10.1016/0021-9290(94)00091-h. [DOI] [PubMed] [Google Scholar]
- Han HC, Marita S, Ku DN. Changes of opening angle in hypertensive and hypotensive arteries in 3-day organ culture. J Biomech. 2006;39(13):2410–2418. doi: 10.1016/j.jbiomech.2005.08.003. [DOI] [PubMed] [Google Scholar]
- Hariton I, Debotton G, Gasser TC, Holzapfel GA. Stress-driven collagen fiber remodeling in arterial walls. Biomech Model Mechanobiol. 2007;6(3):163–175. doi: 10.1007/s10237-006-0049-7. [DOI] [PubMed] [Google Scholar]
- Holzapfel GA, Gasser TC. A viscoelastic model for fiber-reinforced composites at finite strains: continuum basis, computational aspects and applications. Comput Methods Appl Mech Eng. 2001;190(34):4379–4403. [Google Scholar]
- Holzapfel GA, Gasser TC. Computational stress-deformation analysis of arterial walls including high-pressure response. Int J Cardiol. 2007;116(1):78–85. doi: 10.1016/j.ijcard.2006.03.033. [DOI] [PubMed] [Google Scholar]
- Holzapfel GA, Gasser TC, Ogden RW. A new constitutive framework for arterial wall mechanics and a comparative study of material models. J Elast. 2000;61(1):1–48. [Google Scholar]
- Holzapfel GA, Niestrawska JA, Ogden RW, Reinisch AJ, Schrief AJ. Modelling non-symmetric collagen fibre dispersion in arterial walls. J R Soc Interface. 2015;12:106. doi: 10.1098/rsif.2015.0188. [DOI] [PMC free article] [PubMed] [Google Scholar]
- Holzapfel GA, Sommer G, Auer M, Regitnig P, Ogden RW. Layer-specific 3D residual deformations of human aortas with non-atherosclerotic intimal thickening. Ann Biomed Eng. 2007;35(4):530–545. doi: 10.1007/s10439-006-9252-z. [DOI] [PubMed] [Google Scholar]
- Holzapfel GA, Sommer G, Gasser CT, Regitnig P. Determination of layer-specific mechanical properties of human coronary arteries with nonatherosclerotic intimal thickening and related constitutive modeling. Am J Physiol-Heart Circ Physiol. 2005a;289(5):H2048–H2058. doi: 10.1152/ajpheart.00934.2004. [DOI] [PubMed] [Google Scholar]
- Holzapfel GA, Sommer G, Regitnig P. Anisotropic mechanical properties of tissue components in human atherosclerotic plaques. J Biomech Eng. 2004;126(5):657–665. doi: 10.1115/1.1800557. [DOI] [PubMed] [Google Scholar]
- Holzapfel GA, Stadler M, Gasser TC. Changes in the mechanical environment of stenotic arteries during interaction with stents: computational assessment of parametric stent designs. J Biomech Eng. 2005b;127(1):166–180. doi: 10.1115/1.1835362. [DOI] [PubMed] [Google Scholar]
- Holzapfel GA, Weizsäcker HW. Biomechanical behavior of the arterial wall and its numerical characterization. Comput Biol Med. 1998;28(4):377–392. doi: 10.1016/s0010-4825(98)00022-5. [DOI] [PubMed] [Google Scholar]
- Kahraman H, Ozaydin M, Varol E, Aslan SM, Dogan A, Altinbas A, Demir M, Gedikli O, Acar G, Ergene O. The diameters of the aorta and its major branches in patients with isolated coronary artery ectasia. Texas Heart Inst J. 2006;33(4):463–468. [PMC free article] [PubMed] [Google Scholar]
- Lanir Y. Constitutive equations for fibrous connective tissues. J Biomech. 1983;16(1):1–12. doi: 10.1016/0021-9290(83)90041-6. [DOI] [PubMed] [Google Scholar]
- Long Q, Xu XY, Bourne M, Griffith TM. Numerical study of blood flow in an anatomically realistic aorto-iliac bifurcation generated from MRI data. Magn Reson Med. 2000;43(4):565–576. doi: 10.1002/(sici)1522-2594(200004)43:4<565::aid-mrm11>3.0.co;2-l. [DOI] [PubMed] [Google Scholar]
- Maceri F, Marino M, Vairo G. A unified multiscale mechanical model for soft collagenous tissues with regular fiber arrangement. J Biomech. 2010;43(2):355–363. doi: 10.1016/j.jbiomech.2009.07.040. [DOI] [PubMed] [Google Scholar]
- Mangell P, Länne T, Sonesson B, Hansen F, Bergqvist D. Regional differences in mechanical properties between major arteries - an experimental study in sheep. Eur J Vasc Endovasc Surg. 1996;12(2):189–195. doi: 10.1016/s1078-5884(96)80105-5. [DOI] [PubMed] [Google Scholar]
- Moré JJ. Numerical analysis. Vol. 630. Springer-Verlag; Berlin Heidelberg: 1978. The Levenberg–Marquardt algorithm: implementation and theory; pp. 105–116. [Google Scholar]
- Ohayon J, Finet G, Treyve F, Rioufol G, Dubreuil O. A three-dimensional finite element analysis of stress distribution in a coronary atherosclerotic plaque: in-vivo prediction of plaque rupture location. Biomech Appl Comput Assist Surg. 2005;37(2):225–241. [Google Scholar]
- Olufsen MS. PhD thesis. Roskilde University; 1998. Modeling the Arterial System with Reference to an Anesthesia Simulator. [Google Scholar]
- Roach MR, Burton AC. The reason for the shape of the distensibility curves of arteries. Can J Biochem Physiol. 1957;35(8):681–690. [PubMed] [Google Scholar]
- Schriefl AJ, Zeindlinger G, Pierce DM, Regitnig P, Holzapfel GA. Determination of the layer-specific distributed collagen fibre orientations in human thoracic and abdominal aortas and common iliac arteries. J R Soc Interface. 2012;9(71):1275–1286. doi: 10.1098/rsif.2011.0727. [DOI] [PMC free article] [PubMed] [Google Scholar]
- Schulze-Bauer CA, Mörth C, Holzapfel GA. Passive biaxial mechanical response of aged human iliac arteries. J Biomech Eng. 2003;125(3):395–406. doi: 10.1115/1.1574331. [DOI] [PubMed] [Google Scholar]
- Shah PM, Tsapogas MJ, Scarton HA, Jindal PK, Wu KT. Prediction of occlusive disease for left iliac artery. J Cardiovasc Surg. 1976;17(5):420–425. [PubMed] [Google Scholar]
- Sommer G, Holzapfel GA. 3D constitutive modeling of the biaxial mechanical response of intact and layer-dissected human carotid arteries. J Mech Behav Biomed Mater. 2012;5(1):116–128. doi: 10.1016/j.jmbbm.2011.08.013. [DOI] [PubMed] [Google Scholar]
- Sommer G, Regitnig P, Költringer L, Holzapfel GA. Biaxial mechanical properties of intact and layer-dissected human carotid arteries at physiological and supraphysiological loadings. Am J Physiol-Heart Circ Physiol. 2010;298(3):H898–H912. doi: 10.1152/ajpheart.00378.2009. [DOI] [PubMed] [Google Scholar]
- Spencer AJM, Moss RL, Rogers TG. Pure bending of helically wound ideal fibre-reinforced cylinders. J Elast. 1975;5(3–4):287–296. [Google Scholar]
- Stergiopulos N, Young DF, Rogge TR. Computer simulation of arterial flow with applications to arterial and aortic stenoses. J Biomech. 1992;25(12):1477–1488. doi: 10.1016/0021-9290(92)90060-e. [DOI] [PubMed] [Google Scholar]
- Stylianopoulos T, Barocas VH. Multiscale, structure-based modeling for the elastic mechanical behavior of arterial walls. J Biomech Eng. 2007;129(4):611–618. doi: 10.1115/1.2746387. [DOI] [PubMed] [Google Scholar]
- Takamizawa K, Hayashi K. Strain energy density function and uniform strain hypothesis for arterial mechanics. J Biomech. 1987;20(1):7–17. doi: 10.1016/0021-9290(87)90262-4. [DOI] [PubMed] [Google Scholar]
- Waffenschmidt T, Menzel A. Extremal states of energy of a double-layered thick-walled tube-application to residually stressed arteries. J Mech Behav Biomed Mater. 2014;29:635–654. doi: 10.1016/j.jmbbm.2013.05.023. [DOI] [PubMed] [Google Scholar]
- Weisbecker H, Unterberger MJ, Holzapfel GA. Constitutive modelling of arteries considering fibre recruitment and three-dimensional fibre distribution. J R Soc Interface. 2015;12 doi: 10.1098/rsif.2015.0111. [DOI] [PMC free article] [PubMed] [Google Scholar]
- Yu C, Roy RJ, Kaufman H, Bequette BW. Multiple-model adaptive predictive control of mean arterial pressure and cardiac output. IEEE Trans Biomed Eng. 1992;39(8):765–778. doi: 10.1109/10.148385. [DOI] [PubMed] [Google Scholar]
- Zulliger MA, Fridez P, Hayashi K, Stergiopulos N. A strain energy function for arteries accounting for wall composition and structure. J Biomech. 2004;37(7):989–1000. doi: 10.1016/j.jbiomech.2003.11.026. [DOI] [PubMed] [Google Scholar]


