

Abstract
Objectives
Lipoprotein(a) [Lp(a)] is mainly similar in composition to LDL, but differs in having apolipoprotein (apo) (a) covalently linked to apoB-100. Our purpose was to examine the individual metabolism of apo(a) and apoB-100 within plasma Lp(a).
Materials and methods
The kinetics of apo(a) and apoB-100 in plasma Lp(a) were assessed in four men with dyslipidemia [Lp(a) concentration: 8.9-124.7 nmol/L]. All subjects received a primed constant infusion of [5,5,5-2H3] L-leucine while in the constantly fed state. Lp(a) was immunoprecipitated directly from whole plasma; apo(a) and apoB-100 were separated by gel electrophoresis; and isotopic enrichment was determined by gas chromatography/mass spectrometry.
Results
Multicompartmental modeling analysis indicated that the median fractional catabolic rates of apo(a) and apoB-100 within Lp(a) were significantly different at 0.104 and 0.263 pools/day, respectively (P=0.04). The median Lp(a) apo(a) production rate at 0.248 nmol/kg·day-1 was significantly lower than that of Lp(a) apoB-100 at 0.514 nmol/kg·day-1 (P=0.02).
Conclusion
Our data indicate that apo(a) has a plasma residence time (11 days) that is more than twice as long at that of apoB-100 (4 days) within Lp(a), supporting the concept that apo(a) and apoB-100 within plasma Lp(a) are not catabolized from the bloodstream as a unit in humans in the fed state.
Keywords: Lipoprotein (a), Kinetics, Fed state, Hypertriglyceridemia
1. Introduction
Lipoprotein(a) [Lp(a)] was first described by Käre Berg in 1963 [1]. It is a lipoprotein similar in lipid content and composition to LDL but different in having apolipoprotein (apo) (a) covalently linked to apoB-100 by a disulfide bond [2-4]. Apo(a), a heavily glycosylated protein, shares homology with several regions of plasminogen [5]. It is highly polymorphic in size due to different numbers of the kringle IV type 2 (KIV2) domain, ranging from a minimum of 3 to more than 40 [6-7].
Elevated plasma concentrations of Lp(a) are associated with increased coronary heart disease (CHD) risk [8-10]. Lp(a) is considered to have a pro-atherogenic effect since the particle preferentially accepts oxidized phospholipids from LDL, leading to lipid deposition in the arterial intima [11] and, thereby, promoting multiple oxidative and inflammatory actions [12]. It is also thought to have a prothrombotic effect due to the similarity that apo(a) has with the fibrinolytic pro-enzyme plasminogen [13-14]. As a result, elevated Lp(a) concentrations may lead to excess clot formation, which is often the terminal event resulting in coronary artery occlusion. Plasma concentrations of Lp(a) are heritable, vary greatly among ethnic populations, and, in large part, are determined by variations at the apo(a) gene locus, including the number of KIV2 repeats and specific single nucleotide polymorphisms [15-18].
Lp(a) metabolism is still not fully defined [19]. Initial metabolic studies utilizing radioiodinated Lp(a) showed an inverse association between plasma Lp(a) concentrations and apo(a) isoform size, due mainly to differences in production rates [20]. Apo(a) is synthesized primarily by the liver. Linkage of this glycoprotein with apoB-100-containing lipoproteins to form Lp(a) is thought to occur extracellularly, perhaps in the space of Disse or on the surface of hepatocytes [21], although the concept is debated [22]. Less is known about the sites and mechanisms responsible for the clearance of Lp(a) from plasma. There is evidence that the kidney plays a significant role as Lp(a) plasma concentrations are elevated and the apo(a) catabolic rate is significantly lower in patients with impaired renal function [23]. Direct evidence for renal uptake of Lp(a) in humans is lacking, and recent cell and animal studies point to the liver as the primary site of catabolism, with multiple receptors potentially involved in the process [24,25].
While the majority of Lp(a) particles resemble LDL in density and composition, apo(a) immunoreactivity has been reported across the entire density distribution of lipoproteins, with up to 2% of immunoreactive apo(a) being in the floatation density (d) <1.006 g/mL fraction of fasting normolipidemic plasma [26-28]. In the fed state, as well as in hypertriglyceridemic individuals, the amount of apo(a) associated with triglyceride-rich lipoproteins can be increased markedly [28-31]. The origin of Lp(a) particles associated with the d <1.006 g/mL fraction is not clear. They could be derived from the liver in response to a fatty meal and/or produced by remodeling events in the circulation.
Historically the metabolism of apo(a) has been assessed in Lp(a) isolated from plasma by ultracentrifugation at d 1.05-1.15 g/mL (see Discussion). In this density range, apo(a) and apoB-100 in Lp(a) have been found to have similar rates of catabolism [23,32,33]. We found, however, that when Lp(a) was isolated from non-fasting, whole plasma using lectin-mediated affinity chromatography and no ultracentrifugation, apo(a) in Lp(a) was cleared from plasma at half the rate of apoB-100 in Lp(a) [34], a finding which contradicts the concept of Lp(a) being cleared from circulation as an integral particle. In the present study, we have used a more specific isolation procedure, namely, immunoprecipitation with a monoclonal antibody against human apo(a), to assess the individual metabolism of the apo(a) and apoB-100 moieties within plasma Lp(a). Kinetic parameters were determined in subjects with dyslipidemia while in the constantly fed state.
2. Methods
2.1. Study design and subjects
This study aimed to compare the kinetic parameters of apo(a) and apoB-100 in plasma Lp(a) in untreated healthy volunteers. The study constituted part of a larger randomized, double-blind, placebo-controlled, crossover study examining the effects of extended-release niacin 2 g/day (Niaspan, Abbott Laboratories, Abbott Park, IL) and extended-release niacin 2 g/day in combination with lovastatin 40 mg/day (Advicor, Abbott Laboratories, Abbott Park, IL), relative to placebo, on the metabolism of apoB-100, apoB-48, and apoA-I [35]. Each phase lasted 12 weeks and was separated by a 4-week washout phase. While the present study was not designed to examine the effects of niacin on Lp(a) metabolism, the availability of plasma samples from the niacin phase did allow us to assess the kinetics of Lp(a) apo(a) and Lp(a) apoB-100 separately in a metabolic condition known to lower Lp(a) levels [36]. These data are included as Supplementary Material.
Five men (age: 52.8 ± 4.9 y; BMI: 30.1 ± 1.7 kg/m2) with dyslipidemia were enrolled in the study [35]. They were eligible to participate based on the following plasma lipid criteria: triglyceride (TG) concentration ≥ 150 mg/dL, LDL cholesterol concentration ≥130 mg/dL, and HDL cholesterol concentration <40 mg/dL. Exclusion criteria included age <40 years, myocardial infarction in the past 6 months, smoking, thyroid dysfunction, liver or kidney disease, liver cancer, diabetes mellitus, stroke, and current use of medications known to affect lipid metabolism. The study protocol was approved by the Institutional Review Board of Tufts Medical Center and Tufts University Health Sciences; and written informed consent was obtained from each study subject.
At the end of each phase, the subjects underwent a 15 h primed-constant infusion of deuterated leucine ([5,5,5-2H3]-L-leucine, C/D/N Isotopes, Pointe-Claire, Quebec), 10 μmol/kg body weight per hour, under constantly fed conditions, as previously described [35,37]. Briefly, the subjects were fed hourly for 20 h with small identical meals, the composition of which complied with the Therapeutic Lifestyle Changes diet (<30% of calories as total fat, <7% saturated fat, <200 mg/day cholesterol) [38]; the meals started 5 h before and continued throughout the infusion. Blood samples were collected into tubes containing EDTA (0.15%) just before the infusion (0 h) and at 30, 35, 45 min and 1, 1.5, 2, 3, 4, 6, 9, 12, 14, and 15 h during the infusion. Plasma was separated by centrifugation at 2,500 rpm at 4° C for 30 min, divided into aliquots for Lp(a) measurement or isolation, and stored at -80° C until analysis. Freshly separated plasma from each infusion time point was also subjected to sequential density ultracentrifugation to isolate very low density lipoproteins (VLDL, d <1.006 g/mL), intermediate density lipoproteins (IDL, d 1.006-1.019 g/mL), and LDL (d 1.019-1.063 g/mL).
2.2. Quantitation of plasma Lp(a), lipids, and apolipoproteins
Determination of Lp(a) protein concentrations and apo(a) isoform size was performed at the Northwest Lipid Metabolism and Diabetes Research Laboratories, University of Washington, Seattle, WA. Lp(a) concentrations, expressed in nmol/L, were measured by an ELISA [39] in three plasma samples collected during the continuous feeding period. The assay utilizes for detection a monoclonal antibody that specifically recognizes an epitope present in the apo(a) kringle IV type 9 domain and is, therefore, independent of apo(a) isoform size [40]. Apo(a) isoforms were assayed with methodology previously described [40], in which the isoform size visualized on agarose gel electrophoresis is directly proportional to the number of KIV2 repeats. In some subjects, only one apo(a) isoform is expressed; in most individuals, however, apo(a) is expressed by both alleles, with one isoform more prevalent than the other. In this study, as described in Results below, the more prevalent apo(a) isoform was used for mass spectrometric and kinetic analysis for reasons of instrument sensitivity. The concentration of apo(a), expressed as mg/L, was calculated from the molecular mass and percent intensity of each isoform gel band as follows:
The concentration of apoB-100 in Lp(a) was determined similarly, using 512.9 × 10⁻⁶ mg/nmol as the molecular mass of apoB-100.
Lipids and apolipoprotein levels were measured in non-fasting plasma samples drawn during the infusion (mean of 0, 3, and 6 h values). Plasma concentrations of total cholesterol (TC) and TG were determined by automated enzymatic assays. Plasma LDL cholesterol and HDL cholesterol concentrations were assayed directly with kits from Equal Diagnostics and Roche Diagnostics, respectively. The concentration of apoB in total plasma, VLDL, and IDL was measured with an ELISA [41]; and the concentration of LDL apoB was calculated by subtracting apoB in VLDL and IDL from total plasma apoB. In order to determine the concentration of VLDL apoB-100 and, thereby, account for the presence of apoB-48 containing particles in the VLDL density range, the concentration of d <1.006 g/mL apoB-48 was measured by a direct ELISA (Shibayagi, Gunma, Japan) and then subtracted from the concentration of total VLDL apoB. In this study apoB-48 represented 10-12% of the total VLDL apoB concentration [35]. For kinetic analysis (see below), apolipoprotein plasma concentrations were converted to pool size (PS) using the following formula:
where plasma volume is estimated as 4.5% of body weight.
2.3. Isolation of Lp(a) and separation of apo(a) and apoB-100 within Lp(a)
Lp(a) was purified directly from whole plasma by immunoprecipitation with antibody-bound magnetic beads (procedure developed by L. Berglund, University of California, Davis, Sacramento, CA). Briefly, a mouse anti-human apo(a) monoclonal antibody (1 mg/mL) that recognizes specific epitopes of both kringle IV1 (KIV1) and KIV2 domains (MAb a-5; S. M. Marcovina, University of Washington, Seattle, WA) was mixed with goat anti-mouse IgG MagnaBind magnetic beads (Pierce Thermo Scientific, Rockford, IL) at a volume ratio of 1:50 (v/v) and incubated for 1 h at 4° C on a rocking mixer. Plasma from each infusion time point (0.2-0.5 mL, depending on Lp(a) concentration) was incubated with the antibody-bound beads for 18 h at 4° C on a rotating end-over-end mixer. Following incubation, the supernatant was removed after applying an external magnetic field; and the beads/antibody/Lp(a) complex was washed several times in Tris-buffered saline pH 7.6 containing 200 mM L-proline, which is known to dissociate Lp(a) from other apoB-containing particles [42]. To separate the plasma-extracted Lp(a) from the bead complex, sample buffer (Tris buffer pH 6.8 containing 4% glycerol [v/v], 1% SDS [v/v], and 1% β-mercaptoethanol [v/v]) was added to the beads/antibody/Lp(a) complex; the solution was heated at 94° C for 5 min; and the supernatant was recovered after applying the external magnetic field.
Apo(a) and apoB-100 within Lp(a) were resolved by preparative 3-10% gradient SDS-PAGE at 50 V and 25° C for 18 h, under reduced conditions, and transferred at 100 V and 4° C for 5 h to a Westran S polyvinylidene difluoride membrane (GE Life Sciences, Piscataway, NJ) using a Tris-glycine-methanol buffer. The membrane was stained with periodic acid Schiff's base (PAS) to visualize apo(a) and then with Coomassie Blue R-250 to identify apoB-100. The location of the apoB-100 band was confirmed by Western blotting using a monoclonal anti-apoB antibody (Meridian Life Sciences, Saco, ME) and 4-chloro-1-naphthol stain (Pierce Thermo Scientific, Rockford, IL) (data not shown). VLDL and LDL isolated from non-fasting plasma by sequential density ultracentrifugation were used as reference standards.
One subject enrolled in the main metabolic study [35] had a dominant apo(a) isoform of 16 KIV2 repeats (molecular weight: 236.9 kDa). On the 3-10% gradient gel, the band representing this isoform was not clearly resolved from the band representing apoB-100. Since the primary purpose of the study was to compare the metabolism of apo(a) and of apoB-100, the data for this subject were excluded.
2.4. Apolipoprotein isotopic enrichment and kinetic analysis
Membranes stained only with Coomassie blue were used to assess the isotopic enrichment of apo(a) and apoB-100 in Lp(a) since PAS was found to interfere with the derivatization procedure described below. A plasma control from each subject was applied to the gel; and that section of the membrane was stained with PAS, as well as with Coomassie blue, in order to locate the position of apo(a) relative to apoB-100.
The bands containing apoB-100 and the predominant apo(a) isoform visible on the stained membrane were excised from the same membrane (see Results) and hydrolyzed with 12 N HCl at 110° C for 24 h. By excising both the apo(a) and apoB-100 bands for a given timepoint from the same membrane, any extraneous isotopic dilution due to 12C-leucine contamination from the membrane should have affected the enrichment of each protein equally. As described previously [41], the amino acids were converted to n-propyl ester, heptafluorobutyramide derivatives and analyzed for isotopic enrichment by negative chemical ionization gas chromatography/mass spectrometry (GC/MS). Selected ion monitoring at m/z 349 and m/z 352 was used to determine the areas under the chromatographic peaks for each ion. Percent deuterated leucine enrichment (D3-leucine/[D3-leucine + leucine]) for each sample was calculated from the areas under the curve and corrected for the isotopic enrichment of the D3-leucine tracer [43]. The isotopic enrichment of the tracer used in this study was 100%, as analyzed by GC/MS.
Kinetic parameters were determined using a multicompartmental model (Supplementary Fig. 1) and the SAAM II program (The Epsilon Group, Charlottesville, VA). The fractional catabolic rate (FCR) of apo(a) and apoB-100 in Lp(a) were derived from the model parameters giving the best model fit to the enrichment data. Production rate (PR) was computed using the following formula:
The kinetic parameters of apoB-100 in Lp(a) were compared with the kinetic parameters of apoB-100 in VLDL (d <1.006 g/mL) and LDL (d 1.019-1.063 mg/mL) reported previously [35].
2.5. Statistical analysis
The SAS System for Windows statistical program (release 9.2, SAS Institute) was used for statistical analysis. All data in the text, tables, and graphs are presented in the original scale of measurement as specified. For normally distributed variables, means ± SEM was calculated. Non-normally distributed variables were log-transformed to achieve normality before analysis, and median (minimum-maximum) was calculated. Significant differences between the kinetic parameters of apo(a) and apoB-100 within Lp(a) were assessed by paired t-tests. P < 0.05 was considered statistically significant.
3. Results
3.1. Characteristics of study subjects
The four men included in the data analysis had non-fasting plasma lipid and apolipoprotein concentrations during the placebo phase that were consistent with dyslipidemia (TC: 214 ± 19; LDL cholesterol: 104 ± 13; HDL cholesterol: 29 ± 3; apoB: 94 ± 8; apoA-I: 101 ± 6 mg/dL [mean ± SEM]; TG: 448 [260-518] mg/dL, median [minimum-maximum]). The plasma Lp(a) concentrations ranged from 8.9 to 124.7 nmol/L, for a median of 50.0 nmol/L (Table 1).
Table 1.
Lp(a) plasma concentration and apo(a) isoform (n = 4).a
| Dominant Isoform | Recessive Isoform | ||||
|---|---|---|---|---|---|
|
|
|
||||
| Subject | Lp(a) nmol/L | Kringle IV2 number of repeatsb | Protein Molecular Weight kDa | Kringle IV2 number of repeatsb | Protein Molecular Weight kDa |
| S1 | 87.3 | 18 (100%) | 261.9 | — | — |
| S2 | 12.8 | 23 (84%) | 324.4 | 33 (16%) | 449.3 |
| S3 | 124.7 | 18 (63%) | 261.9 | 17 (37%) | 249.4 |
| S4 | 8.9 | 19 (100%) | 274.4 | — | — |
Determination of apo(a) isoform molecular weight was performed at the Northwest Lipid Metabolism and Diabetes Research Laboratories, University of Washington, Seattle, WA.
Percentage in parentheses denotes the intensity of the individual isoform band relative to the intensity of the isoform bands combined.
3.2. Apo(a) isoform size
As shown in Table 1, the dominant apo(a) isoform varied in protein molecular weight from 261.9 to 324.4 kDa. In two of the subjects, this was the only apo(a) isoform band expressed. The other two subjects had a dominant apo(a) isoform that represented 84% and 63%, respectively, of the amount of apo(a) in plasma. When the protein constituents of Lp(a) were separated by SDS-PAGE in our laboratory (Fig. 1), only the dominant apo(a) isoform was detected distinctly. Its migration in the gel, relative to the migration of apoB-100, corresponded to the expected molecular weight of the glycosylated apo(a) isoform. The gel band representing the predominant apo(a) isoform was clearly resolved from the band representing apoB-100. The two isoforms of subject S3 were very similar in molecular weight (dominant: 261.9 kDa; recessive: 249.4 kDa) and were analyzed as a unit. For all subjects, the pattern of both the primary and the degradation protein bands for apoB-100 in Lp(a) was similar to that of apoB-100 in LDL and similar to that observed previously in our metabolic studies (data not shown) and reported by other laboratories [44].
Fig. 1.
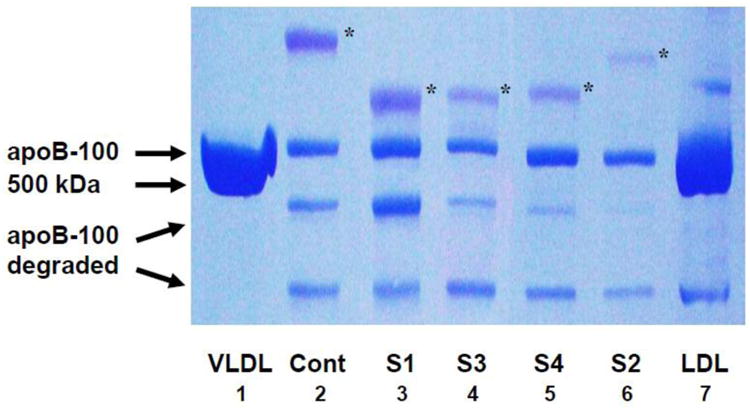
Separation of apo(a) and apoB-100 in Lp(a) by denaturing gradient gel electrophoresis. Lp(a) was isolated from whole plasma by immunoprecipitation with an anti-apo(a) monoclonal antibody and dissociated by 3-10% SDS-PAGE, as described in Methods. Apo(a) was visualized by periodic acid Schiff's stain; apoB-100, by Coomassie blue R-250. The asterisk denotes the position of the dominant apo(a) isoform in each lane; the position of apoB-100 is indicated by the VLDL control sample. The molecular mass of apo(a) is larger than that of apoB-100 because of the carbohydrate content of apo(a). The dominant apo(a) isoform is clearly separated from apoB-100. Lanes 1 and 8 depict VLDL (d < 1.006 g/mL) reduced and LDL (d 1.019-1.063 g/mL) non-reduced, respectively, both isolated by sequential density ultracentrifugation; Lane 2, Lp(a) from control plasma with Lp(a) concentration of 22 mg/dL; Lanes 3-7, Lp(a) from the 4 study subjects. Abbreviations: cont, control plasma; S1, S2, etc, Subject 1, Subject 2, etc.
3.3. Kinetics of apo(a) and apoB-100 in Lp(a)
Figure 2 illustrates the mean (± SEM) deuterated leucine enrichment of apo(a) and apoB-100 in Lp(a) (Fig. 2A) and of apoB-100 in Lp(a), VLDL and LDL (Fig. 2B). The appearance rate of deuterated leucine in Lp(a) apo(a) was slower than that in Lp(a) apoB-100, with the mean isotopic enrichment of apo(a) being approximately 45% of the mean enrichment of apoB-100 in Lp(a) at 15 h. The appearance of deuterated leucine in Lp(a) apoB-100 preceded its appearance in LDL apoB-100 but not in VLDL apoB-100 (Fig. 2B). At 15 h, the isotopic enrichment of apoB-100 in Lp(a) was found to be, on average, 21 ± 2% of the enrichment of apoB-100 in VLDL and more than twice the enrichment of apoB-100 in LDL (3.0 ± 0.6).
Fig. 2.
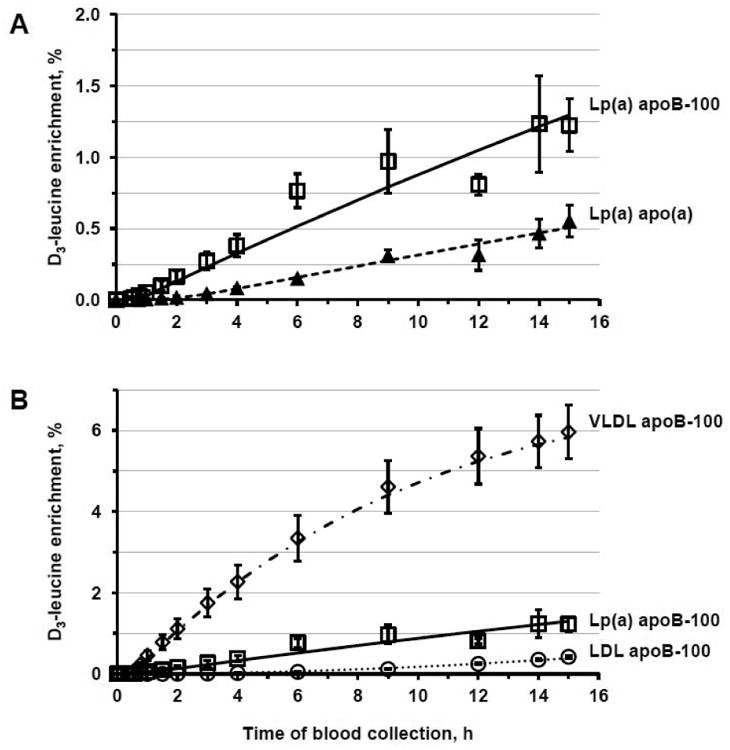
Deuterated leucine enrichment in apo(a) and apoB-100 in Lp(a) (Panel A) and in apoB-100 in Lp(a), VLDL, and LDL (Panel B) during the placebo phase. Symbols represent the percentage of deuterated leucine enrichment (mean ± SEM, n = 4) as determined by GC/MS; lines, the model-predicted values. Triangles and dashed line indicate Lp(a) apo(a); squares and continuous line, Lp(a) apoB-100; diamonds and dashed/dotted line, VLDL apoB-100; circles and dotted line, LDL apoB-100. Marked dips in the Lp(a) apoB-100 curves are due to technical difficulties which resulted in the loss of a sample at that time point.
The kinetic parameters of apo(a) and apoB-100 in Lp(a) are presented in Table 2. The apo(a) PS and apoB-100 PS were assumed to have a 1:1 molar ratio, as determined previously [4]. The median apo(a) FCR (0.104 pools/day) was significantly lower than the median apoB-100 FCR (0.263 pools/day; P = 0.04). Similarly, the median apo(a) PR (0.248 nmol/kg∙day-1) was significantly lower than the median apoB-100 PR (0.514 nmol/kg∙day-1; P = 0.03). Overall, apo(a) in Lp(a) had a residence time in whole plasma that was more than twice as long as the residence time of apoB-100 in Lp(a) (10.6 days vs. 4.0 days, respectively). Compared with the metabolism of other apoB-containing particles, apoB-100 in Lp(a), on average, was cleared from plasma at a rate similar to the FCR of LDL apoB-100 (0.263 vs. 0.272 pools/day). There was, however, marked individual variability with two of the subjects catabolizing apoB-100 in Lp(a) faster than apoB-100 in LDL and the other two subjects showing the converse.
Table 2. Pool size, fractional catabolic rate, production rate, and plasma residence time of apo(a) in Lp(a) and of apoB-100 in Lp(a), VLDL, and LDL.
| PS mg (nmol) | FCR pools/day | PR nmol/kg•day-1 | RT days | |
|---|---|---|---|---|
| Lp(a) apo(a) | ||||
|
| ||||
| Subject 1 | 88.0 (336.2) | 0.136 | 0.534 | 7.4 |
| Subject 2 | 24.1 (69.9) | 0.162 | 0.093 | 6.2 |
| Subject 3 | 146.5 (569.4) | 0.072 | 0.404 | 13.9 |
| Subject 4 | 8.1 (29.4) | 0.071 | 0.028 | 14.1 |
| Median (n = 4) | 56.1 (203.0) | 0.104 | 0.248 | 10.6 |
|
| ||||
| Lp(a) apoB-100 | ||||
|
| ||||
| Subject 1 | 172.4 (336.2) | 0.197 | 0.774 | 5.1 |
| Subject 2 | 35.9 (69.9) | 0.442 | 0.254 | 2.3 |
| Subject 3 | 292.1 (569.4) | 0.210 | 1.178 | 4.8 |
| Subject 4 | 15.1 (29.4) | 0.316 | 0.126 | 3.2 |
| Median (n = 4) | 104.1 (203.0) | 0.263 | 0.514 | 4.0 |
| P, apo(a) vs Lp(a) apoB-100a | 0.003b | 0.04 | 0.03 | 0.05 |
|
| ||||
| VLDL apoB-100 | ||||
|
| ||||
| Subject 1 | 360 (702) | 2.75 | 22.6 | 0.36 |
| Subject 2 | 683 (1332) | 1.99 | 21.8 | 0.50 |
| Subject 3 | 896 (1747) | 1.20 | 20.6 | 0.84 |
| Subject 4 | 382 (745) | 3.76 | 38.1 | 0.27 |
| Median (n = 4) | 532 (1038) | 2.37 | 22.2 | 0.43 |
|
| ||||
| LDL apoB-100 | ||||
|
| ||||
| Subject 1 | 2712 (5287) | 0.275 | 17.0 | 3.6 |
| Subject 2 | 3746 (7303) | 0.270 | 16.2 | 3.7 |
| Subject 3 | 2741 (5344) | 0.391 | 20.6 | 2.6 |
| Subject 4 | 3338 (6509) | 0.245 | 21.7 | 4.1 |
| Median (n = 4) | 3040 (5927) | 0.272 | 18.8 | 3.7 |
FCR, fractional catabolic rate; PR, production rate; PS, pool size; RT, residence time.
Significance for comparison between apo(a) in Lp(a) and apoB-100 in Lp(a) was determined using a paired t-test, with PS and PR parameters being log-transformed before statistical analysis.
PS expressed as mg.
The median Lp(a) level was 18% lower when the subjects were treated with niacin (P = 0.06 vs. placebo). However, the relationship between the metabolism of apo(a) in Lp(a) and that of apoB-100 in Lp(a) was not altered (Supplementary Table 1). The isotopic enrichment of apoB-100 in Lp(a) relative to that of apoB-100 in VLDL and LDL also did not change significantly (Supplementary Fig. 2).
4. Discussion
Lp(a) continues to present challenges to researchers striving to understand the mechanisms of its metabolism. In the present study the kinetics of the individual apolipoprotein components of plasma Lp(a) were examined in subjects with dyslipidemia in the constantly fed state. We found that when the Lp(a) particle was isolated from whole, unfractionated plasma by immunoaffinity precipitation, the plasma residence time of apo(a) in Lp(a) was more than 2-fold greater than the plasma residence time of apoB-100 in Lp(a).
Our observation provides evidence that apo(a) and apoB-100 within plasma Lp(a) are not catabolized from the bloodstream as a unit in the non-fasting state. It is consistent with our prior study in 23 normolipidemic postmenopausal women and age-matched men with a wide range of plasma Lp(a) concentrations [34], but inconsistent with other human Lp(a) studies which reported similar rates of catabolism for Lp(a) apo(a) and Lp(a) apoB-100 [23,32,33,48]. The discrepancy may result from notable differences in study design and methodology (see Supplementary Table 2). Many of the studies primarily used sequential density ultracentrifugation, combined in some instances with an additional purification step, to isolate Lp(a) particles generally in the density range 1.05-1.15 g/mL [23,32,33,48]. In our earlier study, Lp(a) was isolated from whole plasma using lectin-mediated affinity chromatography without any ultracentrifugation [34]. There was concern that this isolation procedure may have captured VLDL particles not containing apo(a) as well as Lp(a) particles, despite the addition of 200 mM L-proline to the wash buffer, and, thereby, may have contributed to the marked difference in Lp(a) apo(a) and Lp(a) apoB-100 catabolic rates. Hence, in the present study, Lp(a) was immunoprecipitated directly from plasma using a monoclonal antibody specifically recognizing epitopes of both KIV1 and KIV2, again without ultracentifugation and with 200 mM L-proline in the wash buffer.
It has been documented that the apo(a) found in the d <1.006 g/mL fraction occurs on slow preβ-migrating particles; and when apo(a) in this fraction was dissociated from chylomicrons and VLDL particles with 100 mM proline and ultracentrifugation, the majority of the apo(a) was in the form of Lp(a) particles [49,50]. In our own studies we have observed that much of apo(a) in whole plasma, as determined by gradient gel electrophoresis and specific immunoblotting, is found in a wide range of lipoprotein particle size, with virtually none in the lipoprotein free state [51].
Another important consideration is the feeding protocol. In our metabolic studies the subjects consumed hourly meals throughout the infusion in order to achieve and maintain a steady-state condition in terms of lipoprotein formation and secretion by the liver and catabolism. It has been shown that the percentage of total plasma apo(a) found in the d <1.006 g/mL fraction increased significantly in response to an oral fat load (from 2% in fasting plasma to 16% postprandially, on average), with no change in plasma apo(a) concentrations [28]. The magnitude of this increase was strongly correlated with the increase in postprandial triglycerides (r = 0.75; P <0.001) [28]. A similar density redistribution of apo(a) immunoreactivity was observed in hypertriglyceridemic subjects, in the fasting state relative to normolipidemic subjects and in response to feeding [28,31]. In this study we examined subjects with elevated triglyceride concentrations, in the fed state, which may have a bearing on our findings.
Early radioiodinated studies of human Lp(a) metabolism reported that the rate of Lp(a) production is the major determinant of Lp(a) levels in fasting plasma [20,45-47], with the apo(a) PR being inversely related to the apo(a) isoform size [20,47]. A similar association between plasma levels and production rate was observed in the present study (r = 0.822; P = 0.178), but it did not reach statistical significance due to the small number of subjects.
Recent in vitro and in vivo work has indicated that Lp(a) is primarily catabolized by the liver through a process potentially involving a number of receptors and mediated by apo(a) [19,24]. The extent to which receptors that bind and internalize apoB-100 may be involved is not clear. The majority of metabolic studies using radiolabeled Lp(a) in mice and in humans with LDL receptor deficiency, as well as the notable ineffectiveness of statin therapy in Lp(a)-lowering, argue against a major role for the LDL receptor [24,52]. Nonetheless, a clear gene-dosage effect on Lp(a) levels has been observed in homozygous familiar hypercholesterolemic subjects [53]. Monoclonal antibodies targeting proprotein convertase subtilisin/kexin type 9 (PCSK9), an important regulator of LDL receptor expression in the hepatocyte membrane, are reported to decrease Lp(a) levels in hypercholesterolemic subjects receiving statin therapy [54]; while in HepG2 cells Lp(a) clearance was found to be modulated by PCSK9 via the LDL receptor, through the apoB component of Lp(a) rather than apo(a) [25].
In the context of our findings, these observations suggest that the metabolism of Lp(a) can include the recycling of apo(a) with apoB-100-containing particles during the plasma residence of apo(a), as illustrated in Figure 3. Since most of the apoB secreted by hepatocytes is in VLDL particles, newly synthesized apo(a) likely associates with this triglyceride-enriched particle to form a Lp(a) having VLDL density. In plasma the VLDL-like moiety is rapidly altered in size and content through the action of lipases and transfer proteins. In the fed state, a substantial portion of VLDL apoB-100 is not converted to LDL apoB-100 but, rather, is removed from circulation by the liver, especially in hypertriglyceridemic subjects (Fig. 3A) [35,41]. We hypothesize, therefore, as shown in Fig. 3B, that apo(a) within Lp(a) in the VLDL density region is in part directly catabolized and in part converted into a cholesterol-rich particle with a density similar to that of LDL (d 1.05-1.15 g/mL). During catabolism, in our view, apo(a) dissociates from apoB-100 and may associate with a newly-formed VLDL apoB-100-containing particle, thereby, extending the plasma residence of apo(a) relative to apoB-100 within Lp(a).
Fig. 3.
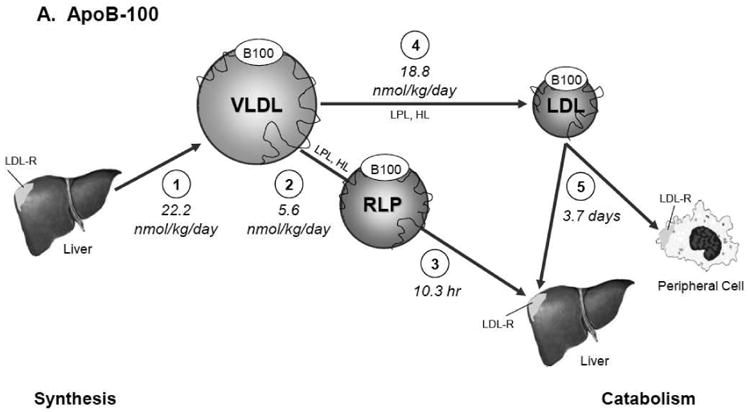
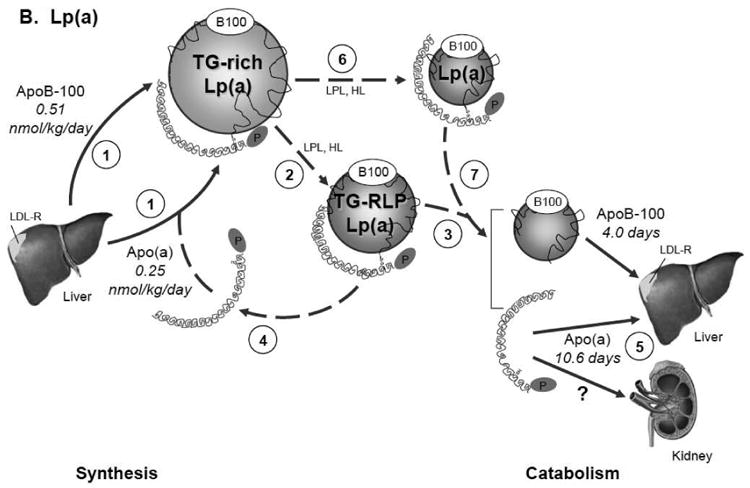
Model for the metabolism of apoB-100 in VLDL, IDL, and LDL (Panel A) and of apo(a) and apoB-100 in Lp(a) (Panel B). Panel A. ApoB-100 is secreted by the liver mainly in a VLDL particle (1). In the plasma compartment VLDL rapidly undergoes lipolysis to form either remnant lipoproteins (2) which are catabolized quickly (3) or LDL particles (4) which remain much longer in circulation before being catabolized (5). Panel B. Apo(a) is produced by the liver at a rate half that of apoB-100 and associates with a newly synthesized TG-rich particle to form Lp(a) with VLDL density (1). In plasma the TG-rich Lp(a) rapidly undergoes lipoplysis (2) to form a triglyceride rich remnant Lp(a) particle which is directly catabolized (3), allowing apo(a) to join the apo(a) pool newly secreted by the liver (4) and to associate with another newly synthesized TG-rich Lp(a) particle (1) before being ultimately removed from circulation by the liver or possibly the kidney (5). Apo(a) on TG-rich Lp(a) can also be converted into a cholesterol-rich particle of LDL density (6) before being catabolized along with apoB-100 (7). Solid lines represent measured metabolic pathways and kinetic parameters; dotted lines, hypothesized metabolic pathways. Synthesis and secretion of the apolipoproteins is expressed as production rate (nmol/kg day-1); catabolism, in terms of plasma residence time. Abbreviations: TG-rich Lp(a), triglyceride-enriched Lp(a) particle of d <1.006 g/mL; TG-RLP Lp(a), triglyceride-enriched remnant Lp(a) particle; Lp(a), Lp(a) particle of d 1.05-1.15 g/mL.
Due to the small number of subjects and to subjects with low Lp(a) plasma concentrations, we were unable to examine the kinetics of apo(a) and apoB-100 within Lp(a) of d <1.006 g/mL, a limitation also encountered by other Lp(a) metabolic studies [55]. Apo(a) and apoB-100 in the Lp(a) particles of d <1.006 g/mL may have metabolic fates that are different from the fates of apo(a) and apoB-100 in Lp(a) of d 1.05-1.15 g/mL. Further studies are needed to test our hypothesis and assess the effect of fasting and feeding on the metabolism of apo(a) and apoB-100 within Lp(a) in different lipoprotein density fractions.
In conclusion, our findings support the concept that apo(a) and apo B-100 within plasma Lp(a) are catabolized from the blood stream at markedly different rates, We think that the methods used to isolate Lp(a) from plasma, as well as the prandial state of the subjects, may affect the results obtained from Lp(a) kinetic studies. It is possible that in subjects with elevated triglyceride levels, the postprandial state not only redistributes apo(a) to VLDL; it may also extend the plasma residence of apo(a) relative to apoB-100 within Lp(a), thereby, enhancing the atherogenic profile of Lp(a) particles, especially in individuals with apo(a) isoforms of lower molecular weight. Future studies need to be done in hypertriglyceridemic subjects while in the fed state, with therapeutic agents known to affect the synthesis and catabolism of the individual apolipoprotein components of Lp(a).
Supplementary Material
Acknowledgments
The authors thank the nursing and dietary staff of the Clinical and Translational Research Center of Tufts Medical Center, Boston, MA, as well as the Cardiovascular Nutrition Laboratory staff, for excellent technical assistance. Our appreciation is also extended to Drs. Leo J. Seman and Jennifer L. Jenner for their contributions to the discussion.
Sources of funding: This work was supported by an investigator-initiated research grant from Abbott Laboratories, Abbott Park, IL to Dr. Ernst J. Schaefer. Additional support was provided by U.S. Department of Agriculture Research Service Contract 53-3K-06 (E.J.S.) and by Project Grant P50 HL083813-01 (E.J.S) and Project Grant HL62705 (L.B.) from the National Institutes of Health. The contents of this article are solely the responsibility of the authors and do not necessarily represent the official views of Abbott Laboratories, the U.S. Department of Agriculture, or the National Institutes of Health. Support for the clinical studies was provided by the Clinical and Translational Research Center of Tufts Medical Center. J. L. was supported by the Harold Williams, M.D. Student Research Fellowship of Tufts University School of Medicine, Boston, MA. P.H.R.B. is a senior research fellow of the National Health and Medical Research Council of Australia.
Abbreviations
- apo
apolipoprotein
- CHD
coronary heart disease
- d
density
- FCR
fractional catabolic rate
- GC/MS
gas chromatography/mass spectrometry
- IDL
intermediate density lipoprotein (d 1.006-1.019 g/mL)
- KIV1
kringle IV1
- KIV2
kringle IV2
- Lp(a)
lipoprotein(a)
- PAS
periodic acid Schiff's base
- PCSK9
proprotein convertase subtilisin/kexin type 9
- PR
production rate
- PS
pool size
- TC
total cholesterol
- TG
triglycerides
- VLDL
very low density lipoprotein (d <1.006 g/mL)
Footnotes
Presented in part at the annual meeting of the Atherosclerosis, Thrombosis, and Vascular Biology Scientific Session, Toronto, ON, May 3, 2014.
Disclosure Statement: Conflicts of interest: none.
Author Contributions: Metabolic study conception and design: S.L.-F. and E.J.S.; data acquisition: M.R.D., S.M.M., J.L., G.G.D., and L.B.; data analysis and interpretation: M.R.D., S.L.-F., S.M.M, P.H.R.B., and E.J.S.; manuscript preparation: M.R.D., S.L-F., S.M.M., P.H.R.B., and E.J.S. All authors have read and approved the final manuscript.
Publisher's Disclaimer: This is a PDF file of an unedited manuscript that has been accepted for publication. As a service to our customers we are providing this early version of the manuscript. The manuscript will undergo copyediting, typesetting, and review of the resulting proof before it is published in its final citable form. Please note that during the production process errors may be discovered which could affect the content, and all legal disclaimers that apply to the journal pertain.
Contributor Information
Stefania Lamon-Fava, Email: stefania.lamon-fava@tufts.edu.
Santica M. Marcovina, Email: smm@uw.edu.
P. Hugh R. Barrett, Email: hugh.barrett@uwa.edu.au.
Julian Lel, Email: julian.lel@gmail.com.
Gregory G. Dolnikowski, Email: gregory.dolnikowski@tufts.edu.
Lars Berglund, Email: lars.berglund@ucdmc.usdavis.edu.
Ernst J. Schaefer, Email: ernst.schaefer@tufts.edu.
References
- 1.Berg K. A new serum type system in man—the Lp system. Acta Pathol Microbiol Scand. 1963;59:369–82. doi: 10.1111/j.1699-0463.1963.tb01808.x. [DOI] [PubMed] [Google Scholar]
- 2.Gaubatz JW, Heideman C, Gotto AM, Jr, Morrisett JD, Dahlen GH. Human plasma lipoprotein [a]. Structural properties. J Biol Chem. 1983;258:4582–89. [PubMed] [Google Scholar]
- 3.Koschinsky ML, Côté GP, Gabel B, van der Hoek YY. Identification of the cysteine residue in apolipoprotein(a) that mediates extracellular coupling with apolipoprotein B-100. J Biol Chem. 1993;268:19819–25. [PubMed] [Google Scholar]
- 4.Albers JJ, Kennedy H, Marcovina SM. Evidence that Lp[a] contains one molecule of apo[a] and one molecule of apoB: evaluation of amino acid analysis data. J Lipid Res. 1996;37:192–6. [PubMed] [Google Scholar]
- 5.McLean JW, Tomlinson JE, Kuang WJ, Eaton DL, Chen EY, Fless GM, et al. cDNA sequence of human apolipoprotein(a) is homologous to plasminogen. Nature. 1987;300:132–7. doi: 10.1038/330132a0. [DOI] [PubMed] [Google Scholar]
- 6.Lackner C, Cohen JC, Hobbs HH. Molecular definition of the extreme size polymorphism in apolipoprotein(a) Hum Mol Genet. 1993;2:993–40. doi: 10.1093/hmg/2.7.933. [DOI] [PubMed] [Google Scholar]
- 7.Hobbs HH, White AL. Lipoprotein(a): intrigues and insights. Curr Opin Lipodol. 1999;10:225–36. doi: 10.1097/00041433-199906000-00005. [DOI] [PubMed] [Google Scholar]
- 8.Schaefer EJ, Lamon-Fava S, Jenner JL, McNamara JR, Ordovas JM, Davis CE, et al. Lipoprotein(a) levels and risk of coronary heart disease in men. The Lipid Research Clinics Coronary Primary Prevention Trial. JAMA. 1994;271:999–1003. doi: 10.1001/jama.1994.03510370051031. [DOI] [PubMed] [Google Scholar]
- 9.Lamon-Fava S, Marcovina SM, Albers JJ, Kennedy H, DeLuca C, White CC, et al. Lipoprotein(a) levels, apo(a) isoform size, and coronary heart disease risk in the Framingham Offspring Study. J Lipid Res. 2011;52:1181–7. doi: 10.1194/jlr.M012526. [DOI] [PMC free article] [PubMed] [Google Scholar]
- 10.Lamon-Fava S, Diffenderfer MR, Marcovina SM. Lipoprotein(a) metabolism. Curr Opin Lipidol. 2014;25:189–93. doi: 10.1097/MOL.0000000000000070. [DOI] [PubMed] [Google Scholar]
- 11.Bergmark C, Dewan A, Orsoni A, Merki E, Miller ER, Shin MJ, et al. A novel function of lipoprotein [a] as a preferential carrier of oxidized phospholipids in human plasma. J Lipid Res. 2008;49:2230–9. doi: 10.1194/jlr.M800174-JLR200. [DOI] [PubMed] [Google Scholar]
- 12.Sotiriou SN, Orlova VV, Al-Fakhri N, Ihanus E, Economopoulou M, Isermann B, et al. Lipoprotein(a) in atherosclerotic plaques recruits inflammatory cells through interaction with Mac-1 integrin. FASEB J. 2006;20:559–61. doi: 10.1096/fj.05-4857fje. [DOI] [PubMed] [Google Scholar]
- 13.Marcovina SM, Koschinsky ML. Evaluation of lipoprotein(a) as a prothrombotic factor: progress from bench to bedside. Curr Opin Lipidol. 2003;14:361–6. doi: 10.1097/00041433-200308000-00004. [DOI] [PubMed] [Google Scholar]
- 14.Spence JD, Koschinsky M. Mechanisms of lipoprotein(a) pathogenicity: prothrombotic, proatherosclerotic, or both? Arterioscler Thromb Vasc Biol. 2012;32:1550–1. doi: 10.1161/ATVBAHA.112.251306. [DOI] [PubMed] [Google Scholar]
- 15.Guyton JR, Dahlen GH, Patsch W, Kautz JA, Gotto AM., Jr Relationship of plasma lipoprotein Lp(a) levels to race and to apolipoprotein B. Arterioscler Thromb Vasc Biol. 1985;5:265–72. doi: 10.1161/01.atv.5.3.265. [DOI] [PubMed] [Google Scholar]
- 16.Boerwinkle E, Leffert CC, Lin J, Lackner C, Chiesa G, Hobbs HH. Apolipoprotein(a) gene accounts for greater than 90% of the variation in plasma lipoprotein(a) concentrations. J Clin Invest. 1992;90:52–60. doi: 10.1172/JCI115855. [DOI] [PMC free article] [PubMed] [Google Scholar]
- 17.Sandholzer C, Hallman DM, Saha N, Sigurdsson G, Lackner C, Császár A, et al. Effects of the apolipoprotein(a) size polymorphism on the lipoprotein(a) concentration in 7 ethnic groups. Hum Genet. 1991;86:607–14. doi: 10.1007/BF00201550. [DOI] [PubMed] [Google Scholar]
- 18.Clarke R, Peden JF, Hopewell JC, Kyriakou T, Goel A, Heath SC, et al. Genetic variants associated with Lp(a) lipoprotein level and coronary disease. N Engl J Med. 2009;36:2518–28. doi: 10.1056/NEJMoa0902604. [DOI] [PubMed] [Google Scholar]
- 19.Hoover-Plow J, Huang M. Lipoprotein(a) metabolism: Potential sites for therapeutic targets. Metabolism. 2013;62:479–91. doi: 10.1016/j.metabol.2012.07.024. [DOI] [PMC free article] [PubMed] [Google Scholar]
- 20.Rader DJ, Cain W, Ikewaki K, Talley G, Zech LA, Usher D, et al. The inverse association of plasma lipoprotein(a) concentrations with apolipoprotein(a) isoform size is not due to differences in Lp(a) catabolism but to differences in production rate. J Clin Invest. 1994;93:2758–63. doi: 10.1172/JCI117292. [DOI] [PMC free article] [PubMed] [Google Scholar]
- 21.Boffa MB, Koschinsky ML. Update on lipoprotein(a) as a cardiovascular risk factor and mediator. Curr Atheroscler Rep. 2013;15:360. doi: 10.1007/s11883-013-0360-6. [DOI] [PubMed] [Google Scholar]
- 22.Frischmann ME, Ikewaki K, Trenkwalder E, Lamina C, Dieplinger B, Soufi M, et al. In vivo stable-isotope kinetic study suggests intracellular assembly of lipoprotein(a) Atherosclerosis. 2012;225:322–7. doi: 10.1016/j.atherosclerosis.2012.09.031. [DOI] [PubMed] [Google Scholar]
- 23.Frischmann ME, Kronenberg F, Trenkwalder E, Schaefer JR, Schweer H, Dieplinger B, et al. In vivo turnover study demonstrates diminished clearance of lipoprotein(a) in hemodialysis patients. Kidney Int. 2007;71:1036–43. doi: 10.1038/sj.ki.5002131. [DOI] [PubMed] [Google Scholar]
- 24.Cain WJ, Millar JS, Himebauch AS, Tietge UJF, Maugeais C, Usher D, et al. Lipoprotein [a] is cleared from the plasma primarily by the liver in a process mediated by apolipoprotein [a] J Lipid Res. 2005;46:2681–91. doi: 10.1194/jlr.M500249-JLR200. [DOI] [PubMed] [Google Scholar]
- 25.Romagnuolo R, Scipione CA, Boffa MB, Marcovina SM, Seidah NG, Koschinsky ML. Lipoprotein(a) catabolism is regulated by proprotein convertase subtilisin/kexin type 9 through the low density lipoprotein receptor. J Biol Chem. 2015;290:11649–62. doi: 10.1074/jbc.M114.611988. [DOI] [PMC free article] [PubMed] [Google Scholar]
- 26.Seman LJ, Breckenridge WC. Isolation and partial characterization of apolipoprotein(a) from human lipoprotein(a) Biochem Cell Biol. 1986;64:999–1009. doi: 10.1139/o86-133. [DOI] [PubMed] [Google Scholar]
- 27.Klezovitch O, Scanu AM. Heterogeneity of lipoprotein(a): growing complexities. Curr Opin Lipidol. 1995;6:223–8. doi: 10.1097/00041433-199508000-00006. [DOI] [PubMed] [Google Scholar]
- 28.Cohn JS, Lam CWK, Sullivan DR, Hensley WJ. Plasma lipoprotein distribution of apolipoprotein(a) in the fed and fasted states. Atherosclerosis. 1991;90:59–66. doi: 10.1016/0021-9150(91)90244-w. [DOI] [PubMed] [Google Scholar]
- 29.Bersot TP, Innerarity TL, Pitas RE, Rall SC, Jr, Weisgraber KH, Mahley RW. Fat feeding in humans induces lipoproteins of density less than 1.006 that are enriched in apolipoprotein[a] and that cause lipid accumulation in macrophages. J Clin Invest. 1986;77:622–30. doi: 10.1172/JCI112345. [DOI] [PMC free article] [PubMed] [Google Scholar]
- 30.Pfaffinger D, Schuelke J, Kim C, Fless GM, Scanu AM. Relationship between apo[a] isoforms and Lp[a] density in subjects with different apo[a] phenotype: a study before and after a fatty meal. J Lipid Res. 1991;32:679–83. [PubMed] [Google Scholar]
- 31.Ishikawa T, Yamashita T, Mochizuki K, Suzuki K, Hashizume N, Nakamura H. Changes in the concentration nd distribution of lipoprotein (a) in plasma after fat intake. J Atheroscler Thromb. 1995;2(Suppl 1):S17–21. doi: 10.5551/jat1994.2.supplement1_s17. [DOI] [PubMed] [Google Scholar]
- 32.Morrisett JD, Gaubatz JW, Nava MN, Guyton JR, Hoffman AS, Opekun AR, et al. Metabolism of apo(a) and apoB-100 in human lipoprotein(a) In: Catapano AL, Gotto AM Jr, Smith LC, Paoletti R, editors. Drugs Affecting Lipid Metabolism. Dordrecht, Netherlands: Kluwer Academic Publishers; 1993. pp. 161–7. [Google Scholar]
- 33.Su W, Campos H, Judge H, Walsh BW, Sacks FM. Metabolism of apo(a) and apoB100 of lipoprotein(a) in women: effect of postmenopausal estrogen replacement. J Clin Endocrinol Metab. 1998;83:3267–76. doi: 10.1210/jcem.83.9.5116. [DOI] [PubMed] [Google Scholar]
- 34.Jenner JL, Seman LJ, Millar JS, Lamon-Fava S, Welty FK, Dolnikowski GG, et al. The metabolism of apolipoproteins (a) and B-100 within plasma lipoprotein (a) in human beings. Metabolism. 2005;54:361–9. doi: 10.1016/j.metabol.2004.10.001. [DOI] [PubMed] [Google Scholar]
- 35.Lamon-Fava S, Diffenderfer MR, Barrett PHR, Buchsbaum A, Nyaku M, Horvath KV, et al. Extended-release niacin alters the metabolism of plasma apolipoporotein (apo) A-I and apoB-containing lipoproteins. Arterioscler Thromb Vasc Biol. 2008;28:1672–8. doi: 10.1161/ATVBAHA.108.164541. [DOI] [PMC free article] [PubMed] [Google Scholar]
- 36.Carlson LA, Hamsten A, Asplund A. Pronounced lowering of serum levels of lipoprotein Lp(a) in hyperlipidaemic subjects treated with nicotinic acid. J Intern Med. 1989;226:271–6. doi: 10.1111/j.1365-2796.1989.tb01393.x. [DOI] [PubMed] [Google Scholar]
- 37.Cohn JS, Wagner DA, Cohn SD, Millar JS, Schaefer EJ. Measurement of very low density and low density lipoprotein apolipoprotein (apo) B-100 and high density lipoprotein apoA-I production in human subjects using deuterated leucine. Effect of fasting and feeding. J Clin Invest. 1990;85:804–11. doi: 10.1172/JCI114507. [DOI] [PMC free article] [PubMed] [Google Scholar]
- 38.NCEP Expert Panel. Executive summary of the third report of the National Cholesterol Education Program (NCEP) Expert Panel on detection, evaluation, and treatment of high blood cholesterol in adults (Adult Treatment Panel III) JAMA. 2001;285:2486–97. doi: 10.1001/jama.285.19.2486. [DOI] [PubMed] [Google Scholar]
- 39.Marcovina SM, Albers JJ, Gabel B, Koschinsky ML, Gaur VP. Effect of the number of apolipoprotein(a) kringle 4 domains on immunochemical measurements of lipoprotein(a) Clin Chem. 1995;41:246–55. [PubMed] [Google Scholar]
- 40.Marcovina SM, Hobbs HH, Albers JJ. Relation between number of apolipoprotein(a) kringle 4 repeats and mobility of isoforms in agarose gel: basis for a standardized isoform nomenclature. Clin Chem. 1996;42:436–9. [PubMed] [Google Scholar]
- 41.Lamon-Fava S, Diffenderfer MR, Barrett PHR, Buchsbaum A, Matthan NR, Lichtenstein AH, et al. Effects of different doses of atorvastatin on human apolipoprotein B-100, B-48, and A-I metabolism. J Lipid Res. 2007;48:1746–53. doi: 10.1194/jlr.M700067-JLR200. [DOI] [PubMed] [Google Scholar]
- 42.Trieu VN, Zioncheck TF, Lawn RM, McConathy WJ. Interaction of apolipoprotein(a) with apolipoprotein B-containing lipoproteins. J Biol Chem. 1991;266:5480–5. [PubMed] [Google Scholar]
- 43.Cobelli C, Toffolo G, Bier DM, Nosadini R. Models to interpret kinetic data in stable isotope tracer studies. Am J Physiol. 1987;253:E551–64. doi: 10.1152/ajpendo.1987.253.5.E551. [DOI] [PubMed] [Google Scholar]
- 44.Edelstein C, Nakajima K, Pfaffinger D, Scanu AM. Oxidative events cause degradation of apoB-100 but not of apo[a] and faciliatate enzymatic cleavage of both proteins. J Lipid Res. 2001;42:1664–70. [PubMed] [Google Scholar]
- 45.Krempler F, Kostner GM, Bolzano K, Sandhofer F. Turnover of lipoprotein (a) in man. J Clin Invest. 1980;65:1483–90. doi: 10.1172/JCI109813. [DOI] [PMC free article] [PubMed] [Google Scholar]
- 46.Krempler F, Kostner GM, Roscher A, Haslauer F, Bolzano K, Sandhofer F. Studies on the role of specific cell surface receptors in the removal of lipoprotein (a) in man. J Clin Invest. 1983;71:1431–41. doi: 10.1172/JCI110896. [DOI] [PMC free article] [PubMed] [Google Scholar]
- 47.Rader DJ, Cain W, Zech LA, Usher D, Brewer HB., Jr Variation in lipoprotein(a) concentrations among individuals with the same apolipoprotein (a) isoform is determined by the rate of lipoprotein(a) production. J Clin Invest. 1993;91:443–7. doi: 10.1172/JCI116221. [DOI] [PMC free article] [PubMed] [Google Scholar]
- 48.Demant T, Seeberg K, Bedynek A, Seidel D. The metabolism of lipoprotein(a) and other apolipoprotein B-containing lipoproteins: a kinetic study in humans. Atherosclerosis. 2001;157:325–39. doi: 10.1016/s0021-9150(00)00732-2. [DOI] [PubMed] [Google Scholar]
- 49.Marcoux C, Lussier-Cacan S, Davignon J, Cohn JS. Association of Lp(a) rather than integrally-bound apo(a) with triglyceride-rich lipoproteins of human subjects. Biochim Biophys Acta. 1997;1346:261–74. doi: 10.1016/s0005-2760(97)00049-0. [DOI] [PubMed] [Google Scholar]
- 50.Gaubatz JW, Hoogeveen RC, Hoffman AS, Ghazzaly KG, Pownall HJ, Guevara J, Jr, et al. Isolation, quantitation, and characterization of a stable complex formed by Lp[a] binding to triglyceride-rich lipoproteins. J Lipid Res. 2001;42:2058–68. [PubMed] [Google Scholar]
- 51.McNamara JR, Campos H, Adolphson JL, Ordovas JM, Wilson PWF, Albers JJ, et al. Screening for lipoprotein[a] elevations in plasma and assessment of size heterogeneity using gradient gel electrophoresis. J Lipid Res. 1989;30:747–55. [PubMed] [Google Scholar]
- 52.Rader DJ, Mann WA, Cain W, Kraft HG, Usher D, Zech LA, et al. The low density lipoprotein receptor is not required for normal catabolism of Lp(a) in humans. J Clin Invest. 1995;95:1403–8. doi: 10.1172/JCI117794. [DOI] [PMC free article] [PubMed] [Google Scholar]
- 53.Kraft HG, Lingenhel A, Raal FJ, Hohenegger M, Utermann G. Lipoprotein(a) in homozygous familial hypercholesterolemia. Arterioscler Thromb Vasc Biol. 2000;20:522–8. doi: 10.1161/01.atv.20.2.522. [DOI] [PubMed] [Google Scholar]
- 54.Desai NR, Kohli P, Giugliano RP, O'Donoghue ML, Somaratne R, Zhou J, et al. AMG145, a monoclonal antibody against proprotein convertase subtilisin kexin type 9, significantly reduces lipoprotein(a) in hypercholesterolemic patients receiving statin therapy: an analysis from the LDL-C Assessment with Proprotein Convertase Subtilisin Kexin Type 9 Monoclonal Antibody Inhibition Combined with Statin Therapy (LAPLACE)-Thrombolysis in Myocardial Infarction (TIMI) 57 Trial. Circulation. 2013;128:962–9. doi: 10.1161/CIRCULATIONAHA.113.001969. [DOI] [PubMed] [Google Scholar]
- 55.Croyal M, Ouguerram K, Passard M, Ferchaud-Roucher V, Chétiveaux M, Billon-Crossouard S, et al. Effects of extended-release nicotinic acid on apolipoprotein (a) kinetics in hypertriglyceridemic patients. Arterioscler Thromb Vasc Biol. 2015;35 doi: 10.1161/ATVBAHA.115.305835. epub. [DOI] [PubMed] [Google Scholar]
Associated Data
This section collects any data citations, data availability statements, or supplementary materials included in this article.