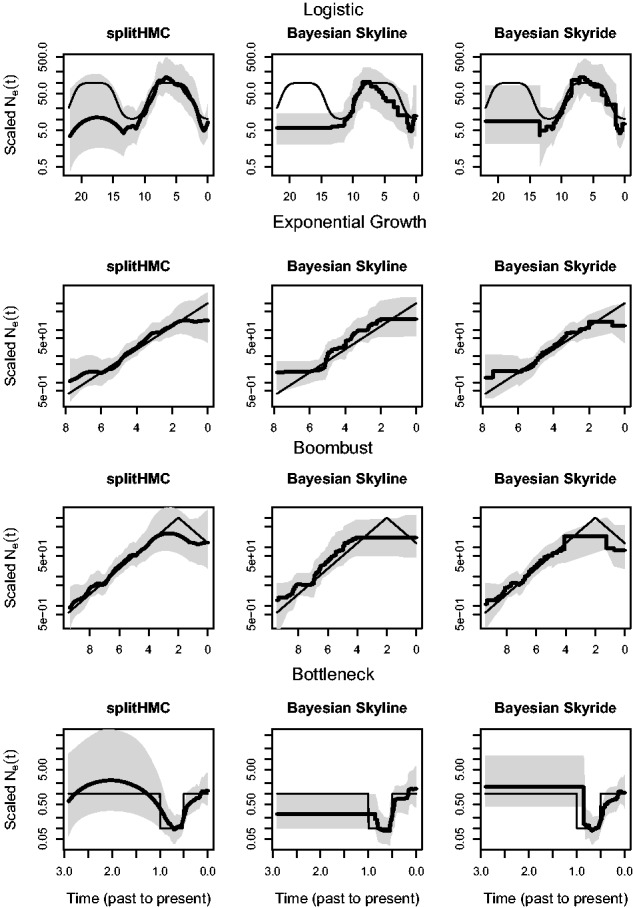
Fig. 4.

Comparison of recovered population size trajectories for the four simulations using our splitHMC, Bayesian Skyline and Bayesian Skyride. Posterior medians are displayed as bold black curves and shaded areas represent 95% BCIs. The truth is displayed as black thin line
