

A new experimental-bioinformatic method was developed for error and bias correction in high-throughput antibody sequencing.
Keywords: next-generation sequencing, systems immunology, immunoglobulin, B cell, multiplex-PCR, error correction, bias correction, monoclonal antibody, barcode
Abstract
High-throughput antibody repertoire sequencing (Ig-seq) provides quantitative molecular information on humoral immunity. However, Ig-seq is compromised by biases and errors introduced during library preparation and sequencing. By using synthetic antibody spike-in genes, we determined that primer bias from multiplex polymerase chain reaction (PCR) library preparation resulted in antibody frequencies with only 42 to 62% accuracy. Additionally, Ig-seq errors resulted in antibody diversity measurements being overestimated by up to 5000-fold. To rectify this, we developed molecular amplification fingerprinting (MAF), which uses unique molecular identifier (UID) tagging before and during multiplex PCR amplification, which enabled tagging of transcripts while accounting for PCR efficiency. Combined with a bioinformatic pipeline, MAF bias correction led to measurements of antibody frequencies with up to 99% accuracy. We also used MAF to correct PCR and sequencing errors, resulting in enhanced accuracy of full-length antibody diversity measurements, achieving 98 to 100% error correction. Using murine MAF-corrected data, we established a quantitative metric of recent clonal expansion—the intraclonal diversity index—which measures the number of unique transcripts associated with an antibody clone. We used this intraclonal diversity index along with antibody frequencies and somatic hypermutation to build a logistic regression model for prediction of the immunological status of clones. The model was able to predict clonal status with high confidence but only when using MAF error and bias corrected Ig-seq data. Improved accuracy by MAF provides the potential to greatly advance Ig-seq and its utility in immunology and biotechnology.
INTRODUCTION
Humoral immune response profiling has progressed greatly in recent years owing to advancements in next-generation sequencing (NGS) technology and bioinformatic analysis of antibody repertoires (1–4). Unlike classical methods for antibody analysis (for example, serum titers), Ig-Seq offers the potential to capture quantitative molecular measurements of immunological phenomena related to clonal selection and expansion, such as clonal frequency, diversity, and somatic hypermutation. Ig-seq has been used to address basic questions in B cell development and differentiation (5–9), and also as an application-focused tool for vaccine development (10–13), immunodiagnostic discovery (10, 14–16), and monoclonal antibody engineering (17–23). However, a major challenge in advancing Ig-seq is the presence of errors introduced during sample preparation and sequencing, which leads to markedly inaccurate measurements of antibody diversity (24, 25). Further complicating Ig-seq is that the most common library generation methods use multiplex polymerase chain reaction (PCR) (5, 7, 8, 10, 11, 13, 15, 17–19, 26, 27), wherein large panels of forward primer sets are used [for example, up to 148 primers for mouse variable heavy (VH)-genes (28)] to compensate for the high diversity of variable germline genes (V-genes). Differences in individual primer ratios, mispriming, and annealing temperatures can result in large systematic biases, substantially influencing the distribution of antibody repertoire clones and V-genes (28–30). Whereas the addition of a 5′ template switching primer to mRNA offers a way to amplify V-genes with a universal single primer (29, 31), the length of 5′ untranslated regions (UTRs) makes it challenging to recover full-length VDJ sequences (fig. S1). Additional biases from this method may be present because of the poor efficiency of template switching reactions, early termination due to RNA secondary structure, and strand invasion (32–35).
Here, we first established an approach to quantitatively measure errors and biases present in Ig-seq data by using a set of synthetic antibody standards [complementary DNA (cDNA)] spiked into biological samples (mouse splenic cDNA). Following multiplex PCR library preparation and Illumina sequencing [2 × 300 base pairs (bp) paired-end], we discovered that there was a drastic overestimation (500-fold) of clonal variants (also referred to as clones); we define clonal variants as antibody VH sequences with identical V- and J-genes and identical amino acid complementarity determining regions 3 (CDR3s). Intraclonal variants, defined here as antibody sequences with common amino acid CDR3s but different nucleotide sequences in the rest of the V-gene (excluding forward primer binding regions), were also overestimated by up to 5000-fold. We further identified that multiplex PCR introduced severe amplification biases, resulting in only 42 to 62% accuracy of spike-in clonal frequencies. This finding suggests that immunological interpretations of clonal diversity, selection, and expansion would be largely masked by errors and amplification biases.
To overcome the widespread inaccuracies in Ig-seq, we developed molecular amplification fingerprinting (MAF), which consists of stepwise incorporation of unique molecular identifiers (UIDs). MAF starts with single molecule tagging of first-strand cDNA during reverse transcription with a reverse-UID (RID), providing a unique tag to each transcript. Notably, MAF continues by tagging each DNA-RID molecule during multiplex PCR amplification with a forward-UID (FID), whereby overamplified molecules receive more FIDs than underamplified molecules. This fingerprint of amplification for each molecule allowed us to implement an algorithm to normalize multiplex amplification bias effects. With spike-in standards as a reference, MAF bias correction resulted in up to 99% accuracy of antibody clonal frequencies. A multistage MAF error correction pipeline resulted in absolute (100%) or nearly absolute (98%) correction of clonal and intraclonal variants, respectively. This led us to establish a metric for clonal expansion based on intraclonal diversity. To demonstrate the immunological significance of MAF correction, we performed Ig-seq on hyperimmunized and untreated mice. Only with MAF-corrected data was logistic regression modeling able to separate Ig-seq data based on immune status, where prediction was dominated by clonotype (clonal variants with at least 80% amino acid similarity) frequencies and the intraclonal diversity index.
RESULTS
Assessment of Ig-Seq errors and biases
RNA spike-in standards are becoming an essential tool to assess errors and bias in sequencing data, the most notable example being the establishment of the External RNA Controls Consortium (ERCC) spike-in mix (36). We translated this concept to Ig-seq by designing a set of synthetic (in vitro transcribed) RNA standards. It is impractical to generate a spike-in mix comprising the full diversity of antibody repertoires at a clonal or V-gene level (>140 V-genes in IGHV repertoire of BALB/c mice). However, fractional sample spike-ins, like the ERCC spike-in mix (92 polyadenlyated transcripts), have proven to be valuable and sufficient for evaluation of errors and bias in sequencing data. We designed our synthetic spike-ins to consist of 16 full-length antibody sequences on the basis of mouse VH regions. Notable spike-in features were the incorporation of 16 unique CDR3 amino acid sequences, seven different V-genes, designed positions for somatic hypermutation, a synthetic segment [for bioinformatic and droplet digital PCR (ddPCR) separation from biological clones] (fig. S2A), and a partial segment of the IgG constant region. All RNA standards included a 5′ universal region allowing for PCR with a single forward primer (singleplex PCR), providing a control for unbiased amplification (fig. S2B). Similar to the ERCC standards, which span a large concentration range, we also mixed our spike-ins over a large concentration range to mimic the distribution of biological antibody repertoires. Using the same biological IgG-specific primers, we reverse-transcribed the standards into first-strand cDNA and made a pooled master stock. We quantified our master pool of standards by sequencing five independently prepared libraries generated by adapter extension PCR, which incorporates Illumina adapters by PCR. This characterization allowed us to determine the relative frequency of each clone (fig. S2C and table S1).
To assess Ig-seq errors and biases, we mixed our master pool of cDNA standards into mouse splenic IgG cDNA at ~10% (generated with the same reverse transcription protocol as spike-in cDNA). This was followed by a multiplex PCR step using a well-established forward primer set specific for mouse VH framework region 1 (17), which consisted of 19 degenerate (87 unique) primers mixed at a varied ratio optimized on the basis of antibody V-gene usage (37). Library preparation was concluded with a final step of adapter extension PCR. We sequenced three independently prepared replicate libraries and annotated sequences using a modified custom-VDJ annotation tool (13) (tables S2 and S3). Analysis of our spike-in standards revealed that despite starting with only 16 CDR3 clones, a total of 1468 ± 109 CDR3 clonal variants (CDR3s with unique amino acid sequences) were observed. The number of clonal variants per spike-in correlated with clonal abundance (Fig. 1A). Similarly, we also observed a drastic increase in diversity of spike-in intraclonal variants (unique read sequences belonging to a single CDR3 clone, excluding primer binding regions), which also correlated with clonal frequency (Fig. 1B). The confounding factor of frequency with diversity decreases the signal-to-noise ratio of multivariate clonal expansion analysis. To better understand the mechanisms generating errors and bias by multiplex primer sets, we determined the number of primers identified for each annotated V-gene in our biological data set (144 mouse V-genes identified) (Fig. 1C). The strong correlation between the number of unique primers and read counts for each V-gene reveals the complexities of efforts to reduce multiplex amplification bias by optimizing primer ratios of large degenerate primer sets. This was further corroborated by the high nucleotide diversity present in the primer binding regions of sequence reads from spike-in clones, which also revealed that mispriming was systematic for V-genes (fig. S3). Some V-genes, such as IGHV14-3, did not have an exact match in the primer set but were still well represented in the data set because of a high level of mispriming, suggesting that reduced primer sets may be designed that allow mismatches toward the 5′ end of primers. These findings also demonstrate the need to exclude primer binding regions from full-VDJ diversity analysis, as was done throughout this study. We also investigated the role of V-gene–specific primer annealing temperature on amplification bias, finding higher primer melting temperature also correlated with increasing number of reads (Fig. 1D). To precisely quantify primer bias, we compared the frequency of spike-ins generated by singleplex PCR versus frequency by multiplex PCR. Disconcertingly, correlation between these two data sets produced an R2 = 0.56, suggesting that multiplex PCR introduced a high degree of amplification bias (Fig. 1E). Notably, amplification bias was systematic because variation across replicates was extremely low and spike-ins sharing the same V-gene were consistently under- or overamplified. The amount of PCR amplification bias also correlates well with the number of erroneous intraclonal variants, as demonstrated by the highly similar profiles (Fig. 1, B and E).
Fig. 1. Assessment of errors and bias in Ig-seq using synthetic antibody spike-ins.
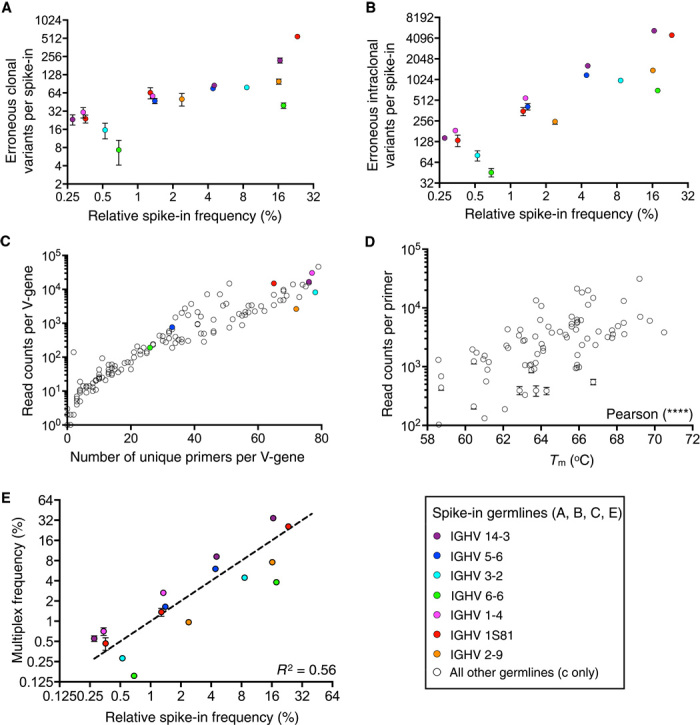
Colored dots refer to V-genes represented by spike-in clones. (A and B) Clonal (A) and intraclonal (B) diversity errors of spike-ins shown in relation to spike-in clonal frequency. (C) Mispriming of biological data during multiplex PCR is shown by plotting the number of unique primers found to be associated with a V-gene and the number of read counts per V-gene. (D) A statistically significant correlation (Pearson, two-tailed, P < 0.0001) is observed between the melting temperature (Tm) of primers in the multiplex PCR primer set and read counts associated with primers in Ig-seq data. (E) A correlation of spike-in clonal frequencies from library preparation with multiplex PCR versus singleplex PCR results in an R2 = 0.56. Amplification bias was systematic because error bars were very low across replicate sequencing runs. Clones with the same V-gene were consistently under- or overamplified. Ig-seq data are from replicate library sample preparations (n = 3; data sets consisted of 4 × 10⁵ preprocessed full-length antibody reads) from mouse splenic cDNA with synthetic spike-ins [for (A), (B), (D), and (E), data are presented as means ± SD and are from replicate data sets Reddy-PS-1, Reddy-PS-2, and Reddy-PS-3; data set Reddy-PS-1 was used for (C); see table S2]. Relative spike-in frequencies are mean values obtained from replicate libraries (n = 5) generated by singleplex PCR (see fig. S2 and table S1).
Ig-seq library preparation by MAF
To address the substantial inaccuracy of Ig-seq data, we developed a library preparation protocol termed MAF. First, RNA is reverse-transcribed into first-strand cDNA using an IgG gene-specific primer with an RID tag and a partial lllumina adapter sequence. Next, a multiplex PCR step is performed using a forward primer set, wherein each primer also contains an FID region (and a partial Illumina adapter sequence; Fig. 2A). We did not use a typical degenerate nucleotide design for UIDs (that is, NNNN…) (25, 27), which can often result in various artifacts such as nonspecific amplification, strand invasion, and primer-dimers (32, 38). Instead, we aimed to minimize these effects by the incorporation of spacer sequences and partial degeneracy while still maintaining a large diversity, ~2 × 10⁷ and ~7 × 10⁵ for RID and FID, respectively. We used ddPCR and qPCR for precise quantification and control of input material during MAF library preparation (figs. S4 and S5) and observed a high fidelity and expected degeneracy in RID and FID regions following sequencing (Fig. 2B). Initial experiments revealed four critical process parameters for Ig-seq library preparation and analysis: (i) the quantity of input cDNA copies, (ii) the number of cycles in the multiplex PCR step, (iii) the quantity of DNA copies input into the adapter extension PCR step, and (iv) the number of preprocessed sequencing reads analyzed by the MAF pipeline. Therefore, in the process of optimizing MAF, we used a design of experiments response surface methodology approach to better understand how these factors influenced library preparation and the resulting Ig-seq data (see table S4, figs. S6 to S9, and Supplementary Materials and Methods). We also designed a new forward primer set by incorporating deoxyinosine nucleotides, which reduced the number of unique primers from 19 degenerate primers (87 unique sequences) to 15 primers (20 unique sequences) while still enabling comprehensive coverage of mouse V-genes (table S5 and fig. S10).
Fig. 2. Ig-seq with MAF.

(A) Workflow for library preparation by MAF consists of reverse transcription (RT), multiplex PCR, and adapter extension PCR and results in amplicons ready for Ig-seq. (B) Following Ig-seq, nucleotide sequence logos show FID and RID regions with predicted levels of variability and nonvariability in degenerate and spacer regions, respectively. (C) Schematic shows the principle of MAF bias correction and its ability to provide improved accuracy of clonal frequencies. The MAF % is based on the normalized RIDcount (NRID), which is equal to the RID clonal counts divided by the MAF bias factor (FIDclonal count/RIDclonal count). In the example above, the NRID for clone Y = (2)/(2/2) = 2; clone X = 3/(4/3) = 2.25 (see Results for more details).
MAF error correction validation
To implement and validate our multi-staged error correction pipeline on Ig-seq data, we performed MAF library preparation on mouse IgG cDNA with ~10% spike-ins. We highlight below several critical stages of our pipeline (for a full description of pipeline and processing statistics, see figs. S11 and S12 and tables S6 and S7). Typically, reads with common UIDs are grouped together and consensus alignment is performed to correct for errors (39). Recent studies have shown that there are a substantial number of errors in the UID regions themselves (40–42). A major advantage of MAF is that by tagging each DNA-RID molecule during amplification with an FID, we were also able to group similar FID-RID pairs and correct errors in these regions themselves. Typically, we found that nearly 15% of RID sequences required error correction. Additionally, because error correction relies on consensus building, each UID sequence must have at least three reads. Given that our library preparation protocol included precise quantification of input cDNA-RID molecules by ddPCR, we were able to achieve a high level of oversampling because ~95% of our RID groups had three or more reads. We found after RID grouping and consensus building that ~40% of antibody sequences required error correction (at least one nucleotide). Using our spike-ins for reference, we found that consensus building removed most of the erroneous intraclonal variants; across all 16 spike-in clones, the error correction rate reached 98.4 ± 0.7% (Fig. 3, A and B, and table S6). However, this process did not fully remove all erroneous sequences, likely due to PCR and sequencing hotspot errors (25) or reverse transcription errors. The use of additional sequence filters may be able to remove such errors but would come at the cost of greatly reducing the percent of usable Ig-seq reads. The correlation of clonal frequency and erroneous intraclonal variants was still observed after consensus building. Therefore, we established a new metric, termed the “intraclonal diversity index,” wherein for each clone, the number of intraclonal variants is normalized by the clonal count (read count or RID count for uncorrected and MAF error corrected data, respectively; see Materials and Methods). This process enabled us to remove the confounding factor of clonal frequency and obtain a more accurate analysis of intraclonal diversity and clonal expansion (Fig. 3C), which has not been previously possible with UID-based correction performed on partial-length antibody variable regions (25, 27). After VDJ annotation, clonal error filtering was performed on CDR3 sequences. This consisted of read-gain analysis (hotspot error identification) of CDR3s (25), RID minimum count/read filtering, and chimeric sequence filtering (see Materials and Methods). After all error correction steps, we achieved 100% accuracy of spike-in CDR3 clones; in all replicate data sets (and throughout this study), we observed zero false-positive and zero false-negative spike-in clones (Fig. 3, D and E).
Fig. 3. MAF error correction validation with spike-ins shows the removal of nearly all erroneous clonal and intraclonal variants.

(A) Phylogenetic trees before and after MAF error correction of intraclonal variants for a single spike-in example clone. (B) Uncorrected and MAF error–corrected intraclonal variant values compared with spike-in frequency through linear regression with a 95% prediction band. (C) Intraclonal diversity index (clonal read or RID count, uncorrected and MAF error–corrected, respectively) showing reduced dependence on frequency plotted along with a slope = 0 line and 95% prediction bands. (D) Phylogenetic trees before and after MAF error correction of clonal variants (CDR3 amino acid sequences) for a single spike-in example clone. (E) Erroneous clonal variants (uncorrected) and accurate clonal identification (MAF error–corrected) plotted as a function of spike-in frequency with linear regression fits and 95% prediction bands. The Ig-seq data sets used in this figure consisted of 1 × 10⁶ preprocessed full-length antibody reads and were obtained from replicate library sample preparations (n = 3) from mouse splenic cDNA with synthetic spike-ins [for (B), (C), and (E), data are presented as means ± SD and are from replicate data sets IM_1a, IM_1b, and IM_1c; data set IM_1a was used for (A) and (D); see table S7]. Relative spike-in frequencies are mean values obtained from replicate libraries (n = 5) generated by singleplex PCR (see fig. S2 and table S1).
MAF bias correction validation
Any multiplex PCR is subject to systematic amplification bias due to variations in primer-template annealing temperatures and mispriming (Figs. 1, C and D, and 2C). Even with our new reduced primer set, we still observed significant amplification bias (Fig. 4A). When determining clonal frequencies on the basis of FID counts or RID counts from MAF Ig-seq data, we observed correlations with singleplex PCR of R2 = 0.46 or R2 = 0.83, respectively. FID-based spike-in frequencies consistently yielded higher linear regression residuals than their corresponding RID-based frequencies (Fig. 4B). During multiplex PCR, overamplified clones received a higher FIDcount/RIDcount ratio than the underamplified clones. This finding inspired the hypothesis that clonal amplification during multiplex PCR can be described by a modified form of the equation describing exponential amplification efficiency in PCR
| (1) |
Fig. 4. MAF bias correction validation with spike-ins shows highly accurate clonal frequencies.
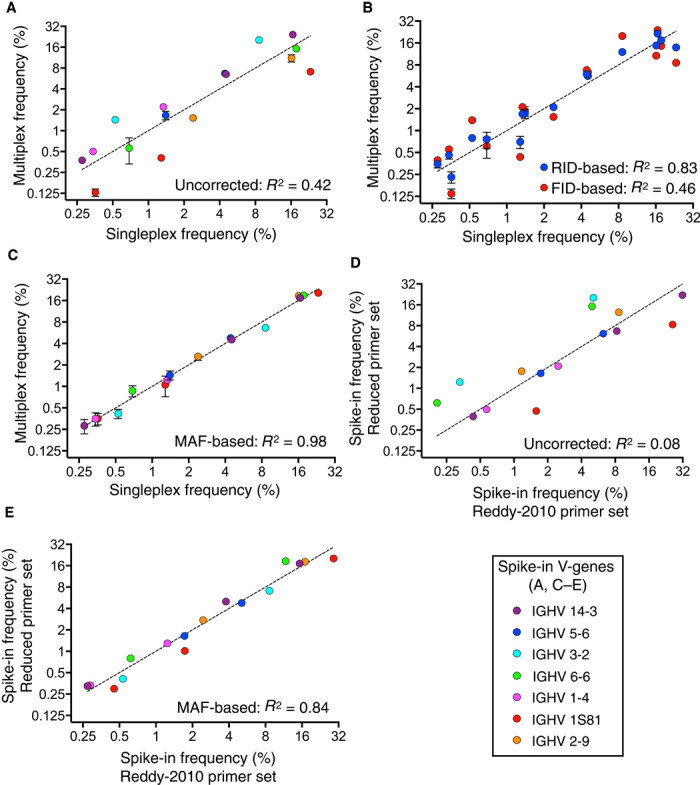
(A) Correlation of uncorrected spike-in clonal frequencies from multiplex PCR (with new reduced primer set) with singleplex PCR results in an R2 = 0.42. (B) Correlation of spike-in clonal frequencies based on FID counting or clonal frequencies based on RID counting with singleplex PCR. Data show that FID residuals are always larger than RID residuals. (C) Correlation of MAF bias corrected spike-in clonal frequencies from multiplex PCR with singleplex PCR results in a significantly improved R2 = 0.98. MAF bias–corrected counts were based on normalized RIDcount and MAF bias factor (see Fig. 2C). (D) Correlation of uncorrected spike-in clonal frequencies using two different multiplex PCR primer sets during library preparation results in an R2 = 0.08. (E) MAF-corrected spike-in clonal frequencies using two different multiplex PCR primer sets result in a significantly improved R2 = 0.84. The Ig-seq data sets used in this figure consisted of 1 × 10⁶ preprocessed full-length antibody reads and were obtained from replicate library sample preparations (n = 3) from mouse splenic cDNA with synthetic spike-ins [for (A) to (C), data are presented as means ± SD and are from replicate data sets IM_1a, IM_1b, and IM_1c, see table S7; data sets Reddy-PS-Compare and TAK-PS-Compare were used for (D) and (E); see table S2]. Singleplex spike-in frequencies are mean values obtained from replicate libraries (n = 5) generated by singleplex PCR (see fig. S2 and table S1).
Here, RIDo represents the number of RIDs for each clone initially present in the multiplex PCR reaction, n represents the number of PCR cycles, Eclonal is the amplification efficiency for each clone in the 5′-3′ direction (FID-tagging efficiency), and FIDn is the number of FIDs tagged to each clone during the entire multiplex PCR reaction. Rearranging the equation results in the scalar factor FIDn/RIDo, which represents the level of clonal specific amplification. Because of subsampling, in which only a fraction of the first-step multiplex PCR product is transferred into second step adapter extension PCR and finally observed in sequencing data, RIDo does not equal the measured RIDclonal count, and likewise, FIDn does not equal FIDclonal count. However, because subsampling proportionally affects FIDn and RIDo, the MAF bias factor can be expressed in terms of measured values, as shown below
| (2) |
Thus, the measured RIDclonal count can be normalized, as shown below
| (3) |
Therefore, the normalized RID clonal count can be expressed in terms of RIDclonal count and FIDclonal count, which are the measured number of unique RIDs and FIDs associated with a given clone. Thus, when we applied the MAF bias factor to determine multiplex PCR spike-in clonal frequencies, correlation with singleplex PCR resulted in a substantial improvement, yielding an R2 = 0.98 (Fig. 4C). We also found in a direct comparison that MAF accuracy of 98% was significantly better than the current state of the art based on UID counting (38, 43) (RID counts yielded 83% accuracy; fig. S13). Furthermore, we performed a detailed comparative analysis of various bias correction methods and found that our error and bias correction pipeline substantially improved the accuracy of counting methods such as RID counting and nonparametric species richness estimators (44) (figs. S13 and S14). Whereas all bias correction counting methods benefited by unrestricted filtering, MAF bias correction resulted in the highest accuracy of 99% (fig. S13C). The possibility exists that during the multiplex PCR step, there could be biased and preferential amplification due to the FID regions themselves. Given the large diversity of the FID tags and the degree of mispriming allowed distal to the 3′ end of the primer, it would be highly unlikely to have sufficiently similar FIDs incorporated that were not recognized by our bioinformatics pipeline. Notably, our replicates throughout the study exhibited high accuracy and low standard deviation of frequency measurements after MAF bias correction (Fig. 4C), suggesting that any bias from preferential FID amplification did not affect the final bias correction performance of MAF.
It has recently been shown that different V-gene primer sets can alter Ig-seq data (28–30); therefore, we evaluated the robustness of MAF bias correction. Using the same starting material, mouse splenic cDNA with ~10% spike-ins, we performed identical MAF library preparations with our original Reddy-2010 primer set and our new reduced primer set. Following Ig-seq, we observed with uncorrected reads that there was a very poor correlation of spike-in clonal frequencies (R2 = 0.08, Fig. 4D). However, after applying MAF bias correction to both data sets, the correlation of clonal frequencies markedly improved to an R2 = 0.84, suggesting that MAF leads to consistent and robust bias correction even with different primer sets (Fig. 4E). Optimization of primer ratios has been shown to reduce bias in multiplex PCR (30); we found that before bias correction, the optimized primer ratio Reddy-2010 set was more accurate than our equal primer ratio reduced set (62 and 48%, respectively). However, after MAF bias correction, both primer sets resulted in substantially better accuracy, whereas the new reduced primer set with equal primer ratios performed best with an accuracy of 98% (fig. S15). In summary, MAF bias correction substantially improves both bioinformatics-based (UID counting) and experimental-based (optimizing primer ratios) bias correction methods.
MAF impact on biological antibody repertoires
After validating MAF error and bias correction with synthetic spike-ins, we next evaluated its impact on biological antibody repertoires derived from mouse splenic cDNA. We found substantial shifts in clonotype (length-matched CDR3 amino acid sequences with at least 80% similarity and matching V- and J-genes) frequencies, with correlation before and after MAF bias correction producing an R2 = 0.52. Furthermore, several hotspot error clones were present in uncorrected data; these clones were identified and removed following MAF error correction (Fig. 5A). It should also be noted that spike-in clonal frequencies spanned a large range of the biological data, supporting that MAF bias correction was valid within this range (Fig. 5B). As expected, after MAF bias correction, we also found substantial shifts in the V-gene distribution as correlation to precorrection data resulted in an R2 = 0.42 (Fig. 5C and fig. S16). The MAF bias factor appeared to group by V-genes, likely due to highly similar primer binding sites during multiplex PCR (Fig. 5E); it also correlated well between replicate samples prepared from the same starting material (figs. S17 and S18). Similar to the spike-in analysis, we found that MAF error correction resulted in intraclonotype diversity index values that were significantly reduced and stratified over a larger range (Fig. 5D).
Fig. 5. MAF error and bias correction substantially alters Ig-seq data from mice.
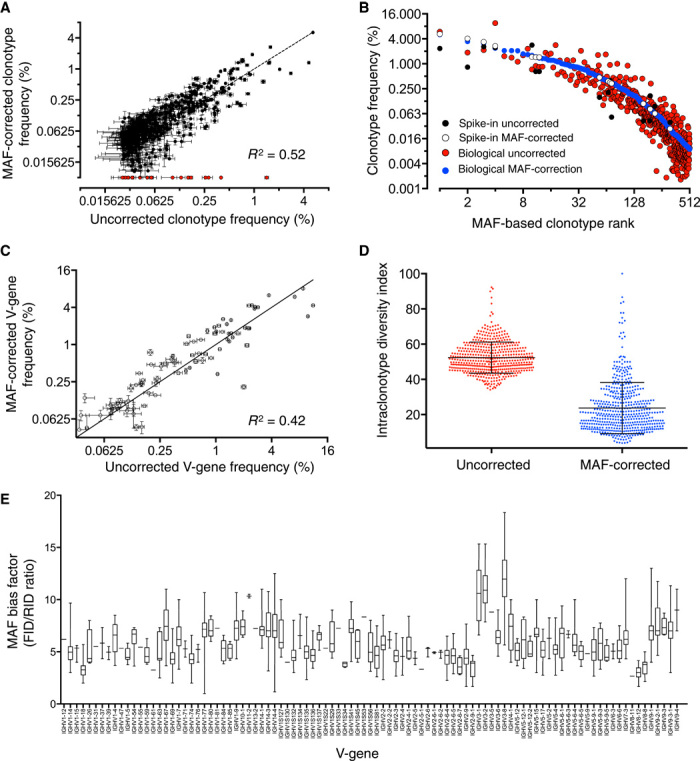
(A) Correlation of clonotype frequencies before and after MAF correction results in an R2 = 0.52. Red dots indicate flagged hotspot error clonotypes present in uncorrected data but removed after MAF correction in all replicate data sets. (B) The top 500 clonotypes ranked according to frequency are shifted after MAF correction. Spike-in frequencies cover most of the biological frequency range. (C) Correlation of V-gene frequencies of uncorrected versus MAF-corrected data results in an R2 = 0.42. (D) The normalized intraclonal variants are decreased substantially across clones after MAF correction. (E) The MAF bias factor shows grouping based on V-genes. The Ig-seq data sets used in this figure consisted of 1 × 10⁶ preprocessed full-length antibody reads and were obtained from replicate library sample preparations (n = 3) from mouse splenic cDNA with synthetic spike-ins [for (A) and (C), data are presented as means ± SD and are from replicate data sets IM_1a, IM_1b, and IM_1c; data set IM_1a was used for (B), (D), and (E); see table S7].
In addition to the MAF bias factor aiding in frequency correction, the FID/RID value also provides numeric assessment for the relative under- or overamplification of clones. We found that the range of FID/RID values of our spike-ins corresponded very closely to the range exhibited by biological clones (Fig. 5E and fig. S17A). With our 16 spike-ins, we were able to obtain reasonable sampling of the biological bias present in nearly the entire repertoire. This method of comparing FID/RID range can also be used in the future to gauge and compare other gene/primer systems in a universal manner.
MAF enables predictive profiling of antibody repertoires
Having establishing that MAF error and bias correction results in greatly improved accuracy of Ig-seq data, we assessed whether predictive antibody repertoire profiling could be performed. Specifically, we tested our ability to distinguish antibody repertoires on the basis of the immune status of their host. We compared Ig-seq data from hyperimmunized mice (n = 3) and untreated mice (n = 3) on the basis of three highly relevant immune profiling factors: (i) clonotype frequency, (ii) median number of nonsilent somatic hypermutations (per clonotype), and (iii) the intraclonotype diversity index. Although we were using extremes in immune status (hyperimmunized versus untreated mice), uncorrected repertoire data were unable to differentiate between immune statuses (Fig. 6A). However, after MAF error and bias correction, we observed a clear separation of antibody repertoires based on immune status (Fig. 6B). Next, we used these three parameters to build nominal logistic regression models to predict whether a clonotype originated from a hyperimmunized or untreated host (see Supplementary Materials and Methods). Following model training with separate data sets, uncorrected test data showed poor clonotype prediction based on immune status (Fig. 6C), whereas across all mice the MAF-corrected test data clearly showed separation of clonotypes based on the immune status (Fig. 6D). Notably, we found that the regression model based on all uncorrected data had an area under the receiver operating characteristic curve of 0.69, and the most dominant parameter of the model was based on somatic hypermutations (Fig. 6E and figs. S19 to S21). However, with MAF-corrected data, the model produced a greatly improved value of 0.94 and was primarily governed by the clonotype frequency and intraclonal diversity index (Fig. 6F and figs. S19 to S21). Finally, we used MAF-corrected data from our hyperimmunized and untreated mice to evaluate several other immune profiling metrics, such as isotype and clonal polarization (fig. S22).
Fig. 6. Immunological clonal prediction status improves significantly after MAF error and bias correction.
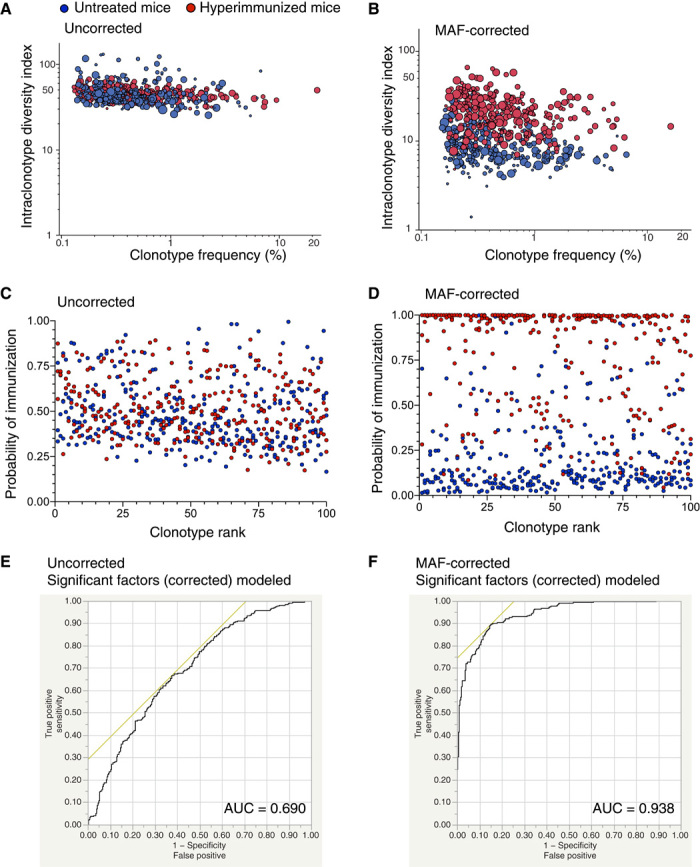
(A and B) Comparison of the top 100 frequency-ranked clonotypes with their corresponding somatic hypermutation and intraclonotype diversity index values. Bubble size represents the median number of nonsilent nucleotide somatic hypermutations per clonotype. Uncorrected data show poor separation based on immune status (red, hyperimmunized; blue, untreated mice). MAF error and bias corrected clonotypes are clearly separated on the basis of these three parameters. (C and D) Applying a stepwise nominal logistic regression, we determined the significant model parameters that describe the separation of clonotype data based on immune status in a multivariate fashion (see Supplementary Materials and Methods). Using three combinations of four training data sets (top 100 frequency-ranked clonotypes, n = 2 untreated, and n = 2 hyperimmunized) and two test data sets (top 100 frequency-ranked clonotypes, n = 1 untreated, and n = 1 hyperimmunized), we show the combined results from the test data sets (n = 3 untreated and n = 3 hyperimmunized). The y axis represents the model prediction probability of whether a given clonotype belongs to the hyperimmunized group. The uncorrected data have a low resolving power, whereas the MAF error and bias corrected data show significant separation. (E and F) Comparison of the sensitivity and specificity of the nominal logistic regression models. The receiver operating characteristics and area under the curve (AUC) for nominal logistic regression models are shown for the significant factors using uncorrected and MAF-corrected data (for model performance using all factors, see fig. S20). The Ig-seq data sets used in this figure consisted of 1 × 10⁶ preprocessed full-length antibody reads and were obtained from library sample preparations of splenic cDNA with synthetic spike-ins from hyperimmunized mice (n = 3) and untreated mice (n = 3) (the data sets used for hyperimmunized are IM_1a, IM_2, and IM_3; the data sets used for untreated are UM_1, UM_2, and UM_3; see table S7).
DISCUSSION
Ig-seq offers a powerful tool to quantitatively measure antibody repertoires and gain greater insight into immunological phenomena. However, we found by using synthetic spike-in standards that Ig-seq data were severely affected by errors and biases introduced during library preparation and sequencing (Fig. 1). Thus, Ig-seq measurements of the fundamental principles of humoral immunity—antibody clonal diversity and clonal frequencies—are largely inaccurate, leading to compromised immunological interpretations. The development of MAF represents a novel approach for tracking and correcting errors and biases introduced by multiplex PCR amplification. MAF error correction was able to eliminate nearly all false positives and provide highly accurate measurements of clonal and intraclonal diversity (Fig. 3). By sequencing full-length VDJ regions, MAF error correction provided accurate intraclonal diversity information; such an analysis was not possible with previously published methods that focused primarily on error correction of clonal CDR3 regions (25, 27). Removing clonal and intraclonal errors is critical for the construction of biologically representative phylogenetic trees, which is valuable for studying antibody evolution in vivo [for example, in the case of HIV and broadly neutralizing antibodies (9, 45, 46)]. Previous methods of error correction in Ig-seq consist only of UID tagging before amplification (first-strand and/or second-strand cDNA) (25, 27). The addition of an FID during amplification is invaluable for implementing a bias correction algorithm (Fig. 2C). This enables the normalization and removal of major amplification biases caused by multiplex PCR (Fig. 4). The effectiveness of MAF bias correction has been exemplified by the 99% accuracies achieved with the approach, outperforming the current state-of-the-art technology based on UID counting by nearly 20% (Fig. 4 and fig. S13) (38, 43). Recently, exhaustive optimization of primer ratios has been used to reduce bias in multiplex PCR (30). However, given the tendency for a high degree of mispriming (Fig. 1C), complete bias removal using this approach would not be possible when sequencing highly diverse templates such as the mouse VH locus. However, with MAF bias correction, we were able to remove nearly all bias with a simple equal molar primer ratio resulting in an accuracy of 98 to 99% (Fig. 4 and fig. S13). Therefore, we expect MAF library preparation and correction to be generalizable and applicable to NGS of other immune receptors such as variable light chains, T cell receptors (47), and other species (for example, human). We also demonstrated with mouse antibody repertoire data that several measurements such as clonal frequencies, V-gene distribution, and intraclonal diversity were substantially altered by MAF correction. This further highlights the importance of controls and correction when using Ig-seq data to make immunological statements (Fig. 5).
The highly accurate data generated by MAF allowed us to take advantage of the tremendous potential offered by Ig-seq. For example, by establishing the “intraclonal diversity index,” we were able to better measure recent clonal expansion. We then used this metric, along with corrected clonal frequencies and somatic hypermutation information, to build logistic regression models capable of accurately predicting the immune status of repertoire clonotypes (Fig. 6). This was made evident in our study, where despite the extreme disparity between untreated and hyperimmunized mice, uncorrected data failed to show a clear difference between repertoires. In contrast, MAF corrected data allowed antibody clonotypes to be accurately predicted on the basis of immune status. We found that our predictive model using MAF-corrected data was primarily governed by the corrected clonotype frequency and the new metric of intraclonal diversity index, followed by somatic hypermutation. A high intraclonal diversity index value appears to be representative of recent clonal expansion (for example, due to booster immunization). However, a high somatic hypermutation value may be the result of lingering memory B cells that underwent earlier clonal expansion to a previously exposed antigen. The ability to perform multivariate analysis with accurate Ig-seq data shows remarkable promise for immune response profiling.
Whereas global repertoire comparisons can be used to detect and predict a subject’s immune status, Ig-seq can also be used for fine analysis of antibody clones. Previous work has shown the potential for sequence-based discovery of monoclonal antibodies (17, 48), wherein antigen specificity was identified only on the basis of highly abundant sequences. However, MAF Ig-seq opens the possibility of using multivariate analysis for the prediction of a greater number of antigen-specific clones. Additionally, Ig-seq repertoires can be mined for intraclonal variants to discover antibodies with improved properties such as higher affinity, specificity, and developability (49). Finally, other Ig-seq–related technologies, such as V-gene pairing (18, 26, 50–52) and antibody serum proteomic analysis (12, 19, 22, 53), may greatly benefit by integrating MAF.
MATERIALS AND METHODS
Experimental design
The primary aim of this work was to assess and correct biases and errors within Ig-seq data. This was necessary to improve the ability to identify immunization responding clones and the overall immune state of a subject. To quantitatively assess errors and biases, we used a panel of synthetic antibody standards, which were spiked into murine splenocyte cDNA before library preparation and Ig-seq. Sample preparation conditions (cDNA amount, number of PCR cycles, primer sets, and number of reads) were optimized to achieve highly accurate data using MAF. The bioinformatically corrected MAF data were then compared to uncorrected data to evaluate the ability to discern data obtained from untreated and hyperimmunized mice.
Mouse experiments
All mouse experiments were performed under the guidelines and protocols approved by the Basel-Stadt cantonal veterinary office (Protocol #2582). Female BALB/c mice (Charles River) were housed under specific pathogen–free conditions. Untreated mice (n = 3) were received at age 3 weeks and housed for 9 weeks before being sacrificed. Hyperimmunized mice were received at age 6 weeks and were injected a week later with 150 μl of a PBS-based solution consisting of the following: (day 0) primary subcutaneous injection containing 200 μg of ovalbumin (Sigma, A5503) and 20 μg of adjuvant monophosphoryl lipid A (MPLA; Sigma, L6895), two booster injections at days 21 and 42 with 50 μg of ovalbumin and 20 μg of MPLA, and a final intraperitoneal booster injection at day 61 with 50 μg of ovalbumin (no adjuvant). Mice were sacrificed 10 days after the final injection. At the time of sacrifice, spleens were removed and placed directly in 1.5 ml of RNAlater (Sigma, R0901), stored overnight at 4°C, and moved to −20°C and stored until further processing.
RNA isolation from spleens
Mouse spleens were removed from RNAlater solution, lightly blotted, and transferred to Miltenyi M tubes containing 1.5 ml of Trizol (Life Technologies, 15596). Spleens were dissociated using a gentleMACS Octo Dissociator with Heaters using the RNA_01_01 preprogrammed setting. One milliliter of solution was removed and stored at −80°C until further processing. RNA extraction was performed using the PureLink RNA Mini Kit (Life Technologies, 12183018A) following the manufacturer’s guidelines.
MAF library preparation
All libraries described throughout this study used MAF primers. A complete list of all primers, probes, and genes used throughout the study can be found in tables S5 and S8.
cDNA synthesis
First-strand cDNA synthesis was performed by using Maxima reverse transcriptase (Life Technologies, EP0742) following the manufacturer’s instructions (with optional steps), using 5 μg of RNA with 20 pmol of IgG gene–specific primers (95% TAK_402 and 5% TAK_403) per 20 μl of reaction volume. TAK_402 binds a conserved portion of mouse IgG1, IgG2a, IgG2b, and IgG2c. TAK_403 binds the less biologically present mouse IgG3. IgG3 sequences were monitored for atypically frequency presence but were removed from biological data before analysis to maintain the ability to accurately quantify relative frequencies of IgG1/2 sequences. Moving toward the 5′ end of the primers, a short nonbinding spacer was included before the degenerate RID sequence, followed by another short spacer, and the 5′ portion of the Illumina RNA PCR Primer used in TruSeq Small RNA Sample Prep Kits (fig. S5). The short spacer between the gene-specific position and the RID helps reduce biases from gene-specific RID annealing, whereas the spacer and reduced degeneracy (H rather than N) within the RID reduces secondary structure. All spacers were used as bioinformatics masks to properly identify RIDs within NGS reads. After cDNA synthesis, samples were subjected to a left-hand sided SPRIselect bead (Beckman Coulter, B23318) cleanup at 0.8×, incorporating an extra ethanol wash step, followed by elution into tris-EDTA (TE) buffer, separation into aliquots, and stored at −80°C.
ddPCR quantification
Target-specific cDNA was quantified by a custom ddPCR assay. Amplification was carried out by a deoxyinosine-containing 5′ J region primer (TAK_530) and a 3′ Illumina adapter–specific primer (TAK_522). Two separate LNA containing probes (TAK_498 and TAK_499) were used to quantify biological and spike-in copies, respectively (figs. S4 and S5). Final reaction mixtures consisted of 1× ddPCR Supermix (Bio-Rad, 186–3010), 250 nM of each probe, 900 nM of each amplifying primer, and a dilution of cDNA. ddPCR was carried out as specified by the manufacturer with the following cycling conditions (cycling done at 50% ramp rate): 95°C for 10 min; 45 cycles of 94°C for 30 s, 53°C for 30 s, 64°C for 1 min; 98°C for 10 min; and holding at 4°C indefinitely.
Multiplex PCR
Using the ddPCR target quantified cDNA measurements, we incorporated 150,000 copies (unless otherwise specified) into 25 μl of first-step multiplex PCR reactions, including 10% of the master pool synthetic spike-ins (see next section). Reaction mixtures consisted of cDNA, 500 nM multiplex primer mix (STR or TAK), 500 nM 3′ Illumina adapter–specific primer (TAK_423), and 1× KAPA HIFI HotStart Uracil+ ReadyMix (KAPA Biosystems, KK2802). The Uracil+ version enabled efficient high-fidelity amplification of TAK multiplex primer set that had deoxyinosines. Thermocycling was performed as follows: 95°C for 2 min; 9 cycles (unless otherwise stated) of 98°C for 20 s, 60°C for 45 s, 72°C for 60 s; 72°C for 5 min; and 4°C indefinitely. PCR reactions were then left-hand side SPRIselect bead cleaned and quantified using the same ddPCR protocols described above.
Adapter extension PCR
To control the amount of final yield after the second-step adapter extension PCR (that is, sufficient material needed for NGS, but overamplification results in PCR chimeras owing to high template/primer ratios), we used the qPCR-based KAPA Real-time PCR Library Amplification Kit (KAPA Biosystems, KK2702), which visualized when reaction saturation occurs on the basis of template amount and number of cycles. We then correlated these data to our ddPCR assay using a synthetic minigene from IDT, which had a full natural antibody gene and Illumina adapters (fig. S5). This correlation allowed us to determine the proper number of cycles to use for the second-step adapter extension PCR reaction on the basis of the desired number of ddPCR quantified copies of first-step multiplex PCR product. We then performed the second-step adapter extension PCR reaction by including 8.0 × 10⁵ ddPCR quantified copies in a 25-μl reaction, along with 1× KAPA HiFi HotStart ReadyMix (KAPA Biosystems, KK2602), 1 μM 5′ Illumina adapter extension primer (TAK_424), and 1 μM 3′ Illumina adapter extension primer (index-specific; for example, TAK_531). Thermocycling was performed as follows: 95°C for 5 min; 23 cycles (unless otherwise stated) of 98°C for 20 s, 65°C for 15 s, 72°C for 15 s; 72°C for 5 min; and 4°C indefinitely. Following second-step adapter extension PCR, reactions were cleaned using a double-sided SPRIselect bead cleanup process (0.5× to 0.8×), with an additional ethanol wash and elution in TE buffer.
Synthetic antibody RNA spike-ins
Sixteen synthetic spike-in clones were designed to incorporate a 5′ constant region (for singleplex PCR amplification), 7 different V-genes, 16 unique CDR3s (amino acid sequences), a J-gene, a partial IgG constant region (with a synthetic portion for a separate ddPCR probe and bioinformatic identification), a 3′ synthetic spacer (to make all clones identical in RNA length), and a final 3′ Eco RV site (to enable efficient run-off transcription) (fig. S2 and table S8). All synthetic clones were ordered as minigenes in the pIDTBlue vector (IDT), which incorporates a T7 promoter to allow for in vitro transcription. The minigenes were linearized with EcoRV-HF (NEB), purified using a PCR cleanup protocol with EconoSpin columns (Epoch Life Sciences), and in vitro transcribed using a T7 High Yield RNA Synthesis Kit (NEB E2040S) according to the manufacturer’s instructions, with subsequent deoxyribonuclease I treatment. Following RNA purification using the PureLink RNA Mini Kit, RNA was quantified by NanoDrop and using a Fragment Analyzer (Advanced Analytical DNF-489 Standard Sensitivity RNA Analysis Kit), mixed at varied concentrations, aliquoted, and stored at −80°C. A master pool of spike-in cDNA mixture was generated by reverse transcription (as described earlier), but with 500 ng of RNA mixture input per 20 μl of reaction. From the master pool of cDNA mixture, exact relative quantification of spike-in clones was done by replicate sample library preparation (n = 5). Library preparation was carried out as described earlier with the following modifications: the multiplex primer set used in the first-step multiplex PCR was replaced with a single primer (TAK_472) and 5.0 × 10⁵ spike-in cDNA copies (measured by ddPCR) were used in the first-step singleplex PCR reaction (fig. S2B). CLC Genomics Workbench preprocessed sequences (370,000) were randomly input from each of the five replicate data sets and processed in our VDJ annotation and analysis pipeline (table S1). The number of unique RIDs for each spike-in clone was counted and converted into frequency (%) and then averaged to produce the singleplex PCR (or relative) spike-in clonal frequency (fig. S2C). The spike-ins used throughout the study were derived from aliquots from the same initial master pool used for singleplex PCR replicate sequencing.
NGS with Illumina MiSeq (2 × 300 bp)
After library preparation, individual NGS libraries were characterized for quality and quantified by capillary electrophoresis using a Fragment Analyzer (Advanced Analytical DNF-473 Standard Sensitivity or DNF-474 High Sensitivity NGS Fragment Analysis Kit). The libraries from untreated mice did not produce the highly clean profiles exhibited in the libraries from hyperimmunized mice, likely due to a higher ratio of initial nonspecific/target transcripts. Samples were then pooled and analyzed on the Fragment Analyzer with the high-sensitivity NGS kit to confirm the target concentration of 4 nM. NGS was performed on the Illumina MiSeq platform with a MiSeq Reagent Kit V32 × 300 bp paired-end (Illumina MS-102-3003), using an input concentration of 16 pM with 2 to 5% PhiX (better results were obtained using 5% PhiX). Raw FASTQ data is publicly available at http://www.ncbi.nlm.nih.gov/bioproject/311999.
MAF error and bias correction pipeline
A complete overview of bioinformatic processing and error correction stages is shown in fig. S12. Steps 2 to 6 were integrated into a single workflow; the overall processing time of this workflow scales directly with the number of sequencing reads (fig. S23). The use of cluster computing enables parallel processing of data sets; thus, it is possible to process a typical MiSeq run (~16 to 18 Ig-seq data sets) at one time. The complete code of our pipeline and CLC Genomics Workbench workflow files are freely available (https://sissource.ethz.ch/sis/maf_scripts).
Bioinformatic preprocessing
Paired-end FASTQ files acquired from Illumina MiSeq were imported into CLC Genomics Workbench 7 on the ETH Zurich Euler High Performance Computing (HPC) cluster. A preprocessing workflow was then run, which consisted of the following steps: trimming of low-quality reads (default CLC quality trim process), merging of paired-end reads, removal of sequences not aligning to mouse IGH constant sequences, and length filtering. Following preprocessing, sequences were batch-renamed to specify each sequence with a unique sequence ID number.
Error correction on UIDs
A custom python script was used for further work, which was configurable for the user to specify a number of parameters, such as the number of preprocessed reads to be randomly sampled (fig. S24). Data sets in Fig. 1 used 4 × 10⁵ and those in Figs. 3 to 6 used 1 × 10⁶ preprocessed reads. FIDs and RIDs were identified and corrected by first identifying the most abundant RID and the most abundant FID belonging to the previously identified RID. All other FID-RID pairs were then searched to identify those that had up to two mismatches in both the FID and RID seeds. FID-RID pairs that were identified were then corrected to that of the seed FID-RID pair. A new seed FID-RID pair was then identified with the second most abundant FID, belonging to the initial most abundant RID and was corrected as above. This process continued until all FIDs belonging to an RID were used as a seed, then repeating the process with the second most abundant RID, and so on.
Error correction by consensus building
Consensus building was performed on sequences, trimmed of their FID and primer-binding region (CLC preprocessing). Here, the most abundant sequence belonging to an RID was used as a seed, and all other sequences in the RID group were aligned to this sequence. Consensus building was only triggered on sequences that were at least 95% similar to the full-length seed sequence to enable potential double-tagged sequences to be independently processed. The most abundant nucleotide at each position was deemed to be the correct sequence, and mismatches were corrected to the most abundant nucleotide sequence.
VDJ annotation
VDJ annotation was performed on both the consensus built and nonconsensus built sequences (trimmed of FID and primer binding regions). The sequencing reads were annotated using a self-written extension for the VDJ software package (https://github.com/laserson/vdj) (13). The script takes a FASTA file with the input sequences and three files with annotated reference sequences from the V-, D-, and J-gene germline segments (Species Mouse, Locus IG) available at Immunogenetics Database (IMGT, www.imgt.org) (54). Then, the input sequences are annotated and exported as IMGT compatible TSV files (table S3).
Each sequence was globally aligned against the V-gene reference set using the Needleman-Wunsch algorithm with an affine gap scoring scheme to avoid the introduction of gaps through mutations in the alignment. After removal of the leading and trailing gaps, the alignment was scored. The alignment with the best score was then used to derive mutation statistics at the nucleotide and amino acid level. Subsequently, we cut the sequence at the second Cys residue of the V-D-J-gene and aligned the rear part against the J-gene segment reference set using the same strategy as used for the V-gene. Mutation statistics were derived accordingly. The region between the second Cys of the V-gene and the J-gene Trp (or J-gene Phe) was labeled as the CDR3 and used as a template sequence to align against the D-gene segment reference set using the Smith-Waterman algorithm. Sequences with out-of-frame amino acid junctions or a stop codon in either the amino acid junction or the V-gene were labeled unproductive and productive otherwise. As a last step, information on the detected V-, D-, and J-gene segments, amino acid and nucleotide sequences, and somatic hypermutation statistics for each sequence were exported to an IMGT compliant (TSV) format. The VDJ annotated TSV files were used to generate a detailed TSV file with all relevant sequence information (for example, sequence ID, FID, RID, V-gene, J-gene, CDR3, somatic hypermutation statistics, isotype).
Clonal error correction and filtering
A new TSV file (CDR3_Tot_Table) was generated where each unique CDR3 of the consensus built data is given a row. We considered reads with matching V genes, J genes, and identical CDR3 amino acid sequences to be a clone; clones with matching CDR3 amino acid lengths and >80% amino acid CDR3 identity to be clonotypes; and a read was a given data acquired sequence. This table was then populated with all basic data based on the annotation (for example, number of reads, number of FIDs, number of RIDs, majority isotype, majority V-gene, majority J-gene, median somatic hypermutation statistics). In addition, the clones were searched in the previously generated nonconsensus built data tables to specify the number of reads for each clone without any error correction. The number of reads before and after consensus building for a given clone were compared; if the number of reads after consensus building was less than that of before consensus building, the clone was flagged and removed as a hotspot error [similar to the method of Shugay et al. (25)]. A user configurable component was also included to filter for chimera sequences that were present within a CDR3 clone that did not share the same V- and J-genes as the most abundant ones for the clone.
Key clonal attributes
The MAF bias corrected count was based on two values: (i) the count to be corrected (RID or read count) and (ii) the MAF factor (clonal or average V-gene FID/RID ratio). We termed the best combination “MAF clonal,” which uses the number of RIDs for a given clone and divides it by the MAF bias factor (FIDclonal count/RIDclonal count), which was then used to compute a percentage on the basis of the number of clones passing all filters for all data, unless otherwise specified. The MAF V-gene–based corrected values were obtained by computing the median FID/RID factor for all clones belonging to a V-gene (fig. S14). A given clone’s RIDclonal count was then corrected using the median V-gene ratio associated with a given clone. A similar table was generated whereby each clone was annotated with F1, F2, F3, etc., values. These Fn values are the number of unique RIDs seen n times (for example, an F10 value of 20 means 10 unique RIDs each have exactly 20 reads associated with them). The values from this table were then used to further compute values in the CDR3_Tot_Table. For example, nonparametric species richness estimators (for example, Chao1, ACEvar) use these values (see fig. S13 for more information). We also evaluated the ability to perform MAF library preparation on a sample and apply the MAF V-gene to read counts from other data sets (fig. S14). In addition to hotspot clonal error identification (output in the CDR3_Tot_Table), the scripts are configurable to use these parameters to perform additional filters (for example, F3+ must be at least 3) to ensure reliable detection and validation of clones using synthetic spike-in controls. Filtered CDR3 clones were also assigned a clonotype group number (grouping unique CDR3s with other CDR3s that share the same amino acid length, with at least 80% amino acid similarity, and the same V- and J-genes). The CDR3s were also annotated with values such as median somatic hypermutations, both uncorrected (median based on all reads) and corrected (median value of the median within RID groups). The intraclonal diversity index was defined by taking the total number of variants (either uncorrected built or corrected), dividing by the total number of reads (uncorrected) or RID counts (corrected), and multiplying by 100.
Statistical analysis
Data analysis was performed either during the MAF pipeline processing, R, GraphPad Prism 6, JMP 11, or Microsoft Excel. More details on statistical analysis can be found in the figure legends.
Supplementary Material
Acknowledgments
We would like to acknowledge ETH Zurich Genomics Facility Basel for Illumina sequencing support, in particular I. Nissen, M. Kohler, and C. Beisel. We would also like to thank H. Oller and A. Alitalo for assistance with animal authorization and experiments. We also acknowledge bioinformatic code support from C. Ramakrishnan and ETH Zurich high-performance computing cluster (EULER) support from S. Fux. We also thank U. Laserson for helpful guidance in modifying the VDJ annotation. Funding: This work was funded by the Whitaker International Program (to T.A.K.) and the Swiss National Science Foundation SystemsX.ch—AntibodyX RTD project (to S.T.R.). The professorship of S.T.R. is made possible by an endowment from the S. Leslie Misrock Foundation. Author contributions: T.A.K. and S.T.R. developed the methodology and wrote the manuscript; T.A.K., S.F., and A.R.G. designed and performed the experiments; T.A.K. designed the bioinformatic workflow; J.S. and H.-J.R. developed the code for bioinformatic processing; T.A.K., S.F., A.R.G., and S.T.R. analyzed the data. Competing interests: The authors declare that they have no competing interests. Data and materials availability: All data needed to evaluate the conclusions in the paper are present in the paper and/or the Supplementary Materials. Additional data related to this paper may be requested from the authors. Raw FASTQ data is publicly available at http://www.ncbi.nlm.nih.gov/bioproject/311999. The source code for MAF bioinformatics processing is publicly available at https://sissource.ethz.ch/sis/maf_scripts.
SUPPLEMENTARY MATERIALS
Supplementary material for this article is available at http://advances.sciencemag.org/cgi/content/full/2/3/e1501371/DC1
Materials and Methods
Fig. S1. The 5′UTR lengths of mouse IGHV transcripts.
Fig. S2. Antibody synthetic spike-in genes.
Fig. S3. Nucleotide sequence logos of the primer-binding regions of selected spike-in clones.
Fig. S4. Precise library quantification by linking qPCR to ddPCR.
Fig. S5. Annotated example of biological sequence obtained from MAF library preparation.
Fig. S6. Design of experiments (DoE) for library preparation optimization.
Fig. S7. Response surface methodology analysis of clonal frequency bias with uncorrected data.
Fig. S8. Response surface methodology analysis of CDR3 diversity.
Fig. S9. Response surface methodology analysis of clonal frequency bias with MAF-corrected data.
Fig. S10. Comparison of V-gene coverage using new reduced primer set (TAK) and previously published primer set (Reddy-2010).
Fig. S11. Schematic of multistage error correction pipeline.
Fig. S12. Flow chart of multistage error correction pipeline.
Fig. S13. Error correction effects on various bias correction methods.
Fig. S14. Bias correction using MAF V-gene bias factor.
Fig. S15. Comparison of bias correction with a new reduced primer set (TAK) and a previously published primer set (Reddy-2010).
Fig. S16. Comparison of V-gene (germlines) before and after MAF correction.
Fig. S17. The MAF bias factor across V-genes.
Fig. S18. Correlation of MAF bias correction factor across data sets.
Fig. S19. Nominal logistic regression modeling based on Ig-seq clonotype measurements.
Fig. S20. Comparison of the sensitivity and specificity of the nominal logistic regression models.
Fig. S21. Comparison of factor correlations with prediction probabilities of the nominal logistic regression models.
Fig. S22. Various immune profiling metrics from MAF-corrected Ig-seq data.
Fig. S23. Processing time of reads for MAF error and bias correction pipeline.
Fig. S24. Effect of the number of reads analyzed using final MAF sample preparation conditions.
Table S1. Ig-seq read count statistics for spike-ins following replicate library preparation by singleplex PCR (see fig. S2, B and C).
Table S2. Ig-seq read count statistics following MAF library preparation by multiplex PCR (see Fig. 2A).
Table S3. A comparison of the VDJ annotation tool used in this study (modified from Laserson et al. (12) with IMGT HighV-Quest.
Table. S4. Ig-seq read count statistics for DoE for library preparation optimization.
Table S5. A complete list of primers and sequences used in this study.
Table S6. Error correction statistics for spike in clones.
Table S7. Expanded Ig-seq processing statistics.
Table S8. Synthetic genes used in this study.
REFERENCES AND NOTES
- 1.Georgiou G., Ippolito G. C., Beausang J., Busse C. E., Wardemann H., Quake S. R., The promise and challenge of high-throughput sequencing of the antibody repertoire. Nat. Biotech. 32, 158–168 (2014). [DOI] [PMC free article] [PubMed] [Google Scholar]
- 2.Galson J. D., Pollard A. J., Trück J., Kelly D. F., Studying the antibody repertoire after vaccination: Practical applications. Trends Immunol. 35, 319–331 (2014). [DOI] [PubMed] [Google Scholar]
- 3.Calis J. J. A., Rosenberg B. R., Characterizing immune repertoires by high throughput sequencing: Strategies and applications. Trends Immunol. 35, 581–590 (2014). [DOI] [PMC free article] [PubMed] [Google Scholar]
- 4.Greiff V., Miho E., Menzel U., Reddy S. T., Bioinformatic and Statistical Analysis of Adaptive Immune Repertoires. Trends Immunol 36, 738–749 (2015). [DOI] [PubMed] [Google Scholar]
- 5.Kaplinsky J., Li A., Sun A., Coffre M., Koralov S. B., Arnaout R., Antibody repertoire deep sequencing reveals antigen-independent selection in maturing B cells. Proc. Natl. Acad. Sci. U.S.A. 111, E2622–E2629 (2014). [DOI] [PMC free article] [PubMed] [Google Scholar]
- 6.Uduman M., Shlomchik M. J., Vigneault F., Church G. M., Kleinstein S. H., Integrating B cell lineage information into statistical tests for detecting selection in Ig sequences. J. Immunol. 192, 867–874 (2014). [DOI] [PMC free article] [PubMed] [Google Scholar]
- 7.Jiang N., Weinstein J. A., Penland L., White R. A. III, Fisher D. S., Quake S. R., Determinism and stochasticity during maturation of the zebrafish antibody repertoire. Proc. Natl. Acad. Sci. U.S.A. 108, 5348–5353 (2011). [DOI] [PMC free article] [PubMed] [Google Scholar]
- 8.Weinstein J. A., Jiang N., White R. A. III, Fisher D. S., Quake S. R., High-throughput sequencing of the zebrafish antibody repertoire. Science 324, 807–810 (2009). [DOI] [PMC free article] [PubMed] [Google Scholar]
- 9.Sok D., Laserson U., Laserson J., Liu Y., Vigneault F., Julien J.-P., Briney B., Ramos A., Saye K. F., Le K., Mahan A., Wang S., Kardar M., Yaari G., Walker L. M., Simen B. B., St John E. P., Chan-Hui P.-Y., Swiderek K., Kleinstein S. H., Alter G., Seaman M. S., Chakraborty A. K., Koller D., Wilson I. A., Church G. M., Burton D. R., Poignard P., Trkola A., The effects of somatic hypermutation on neutralization and binding in the PGT121 family of broadly neutralizing HIV antibodies. PLOS Pathog 9, e1003754 (2013). [DOI] [PMC free article] [PubMed] [Google Scholar]
- 10.Jackson K. J. L., Liu Y., Roskin K. M., Glanville J., Hoh R. A., Seo K., Marshall E. L., Gurley T. C., Moody M. A., Haynes B. F., Walter E. B., Liao H.-X., Albrecht R. A., García-Sastre A., ChaparroRiggers J., Rajpal A., Pons J., Simen B. B., Hanczaruk B., Dekker C. L., Laserson J., Koller D., Davis M. M., Fire A. Z., Boyd S. D., Human responses to influenza vaccination show seroconversion signatures and convergent antibody rearrangements. Cell Host Microbe 16, 105–114 (2014). [DOI] [PMC free article] [PubMed] [Google Scholar]
- 11.Jiang N., He J., Weinstein J. A., Penland L., Sasaki S., He X.-S., Dekker C. L., Zheng N.-Y., Huang M., Sullivan M., Wilson P. C., Greenberg H. B., Davis M. M., Fisher D. S., Quake S. R., Lineage structure of the human antibody repertoire in response to influenza vaccination. Sci. Transl. Med. 5, 171ra19 (2013). [DOI] [PMC free article] [PubMed] [Google Scholar]
- 12.Lavinder J. J., Wine Y., Giesecke C., Ippolito G. C., Horton A. P., Lungu O. I., Hoi K. H., DeKosky B. J., Murrin E. M., Wirth M. M., Ellington A. D., Dörner T., Marcotte E. M., Boutz D. R., Georgiou G., Identification and characterization of the constituent human serum antibodies elicited by vaccination. Proc. Natl. Acad. Sci. U.S.A. 111, 2259–2264 (2014). [DOI] [PMC free article] [PubMed] [Google Scholar]
- 13.Laserson U., Vigneault F., Gadala-Maria D., Yaari G., Uduman M., Vander Heiden J. A., Kelton W., Taek Jung S., Liu Y., Laserson J., Chari R., Lee J.-H., Bachelet I., Hickey B., Lieberman-Aiden E., Hanczaruk B., Simen B. B., Egholm M., Koller D., Georgiou G., Kleinstein S. H., Church G. M., High-resolution antibody dynamics of vaccine-induced immune responses. Proc. Natl. Acad. Sci. U.S.A. 111, 4928–4933 (2014). [DOI] [PMC free article] [PubMed] [Google Scholar]
- 14.Parameswaran P., Liu Y., Roskin K. M., Jackson K. K. L., Dixit V. P., Lee J.-Y., Artiles K. L., Zompi S., Vargas M. J., Simen B. B., Hanczaruk B., McGowan K. R., Tariq M. A., Pourmand N., Koller D., Balmaseda A., Boyd S. D., Harris E., Fire A. Z., Convergent antibody signatures in human dengue. Cell Host Microbe 13, 691–700 (2013). [DOI] [PMC free article] [PubMed] [Google Scholar]
- 15.Boyd S. D., Marshall E. L., Merker J. D., Maniar J. M., Zhang L. N., Sahaf B., Jones C. D., Simen B. B., Hanczaruk B., Nguyen K. D., Nadeau K. C., Egholm M., Miklos D. B., Zehnder J. L., Fire A. Z., Measurement and clinical monitoring of human lymphocyte clonality by massively parallel V-D-J pyrosequencing. Sci. Transl. Med. 1, 12ra23 (2009). [DOI] [PMC free article] [PubMed] [Google Scholar]
- 16.Greiff V., Bhat P., Cook S. C., Menzel U., Kang W., Reddy S. T., A bioinformatic framework for immune repertoire diversity profiling enables detection of immunological status. Genome Med. 7, 49 (2015). [DOI] [PMC free article] [PubMed] [Google Scholar]
- 17.Reddy S. T., Ge X., Miklos A. E., Hughes R. A., Kang S. H., Hoi K. H., Chrysostomou C., Hunicke-Smith S. P., Iverson B. L., Tucker P. W., Ellington A. D., Georgiou G., Monoclonal antibodies isolated without screening by analyzing the variable-gene repertoire of plasma cells. Nat. Biotech. 28, 965–969 (2010). [DOI] [PubMed] [Google Scholar]
- 18.DeKosky B. J., Ippolito G. C., Deschner R. P., Lavinder J. J., Wine Y., Rawlings B. M., Varadarajan N., Giesecke C., Dörner T., Andrews S. F., Wilson P. C., Hunicke-Smith S. P., Willson C. G., Ellington A. D., Georgiou G., High-throughput sequencing of the paired human immunoglobulin heavy and light chain repertoire. Nat. Biotech. 31, 166–169 (2013). [DOI] [PMC free article] [PubMed] [Google Scholar]
- 19.Cheung W. C., Beausoleil S. A., Zhang X., Sato S., Schieferl S. M., Wieler J. S., Beaudet J. G., Ramenani R. K., Popova L., Comb M. J., Rush J., Polakiewicz R. D., A proteomics approach for the identification and cloning of monoclonal antibodies from serum. Nat. Biotech. 30, 447–452 (2012). [DOI] [PubMed] [Google Scholar]
- 20.Glanville J., Zhai W., Berka J., Telman D., Huerta G., Mehta G. R., Ni I., Mei L., Sundar P. D., Day G. M. R., Cox D., Rajpal A., Pons J., Precise determination of the diversity of a combinatorial antibody library gives insight into the human immunoglobulin repertoire. Proc. Natl. Acad. Sci. U.S.A. 106, 20216–20221 (2009). [DOI] [PMC free article] [PubMed] [Google Scholar]
- 21.Zhu J., Wu X., Zhang B., McKee K., O’Dell S., Soto C., Zhou T., Casazza J. P.; NISC Comparative Sequencing Program, Mullikin J. C., Kwong P. D., Mascola J. R., Shapiro L., De novo identification of VRC01 class HIV-1–neutralizing antibodies by next-generation sequencing of B-cell transcripts. Proc. Natl. Acad. Sci. U.S.A. 110, E4088–E4097 (2013). [DOI] [PMC free article] [PubMed] [Google Scholar]
- 22.Fridy P. C., Li Y., Keegan S., Thompson M. K., Nudelman I., Scheid J. F., Oeffinger M., Nussenzweig M. C., Fenyö D., Chait B. T., Rout M. P., A robust pipeline for rapid production of versatile nanobody repertoires. Nat. Methods 11, 1253–1260 (2014). [DOI] [PMC free article] [PubMed] [Google Scholar]
- 23.Glanville J., D’Angelo S., Khan T. A., Reddy S. T., Naranjo L., Ferrara F., Bradbury A. R. M., Deep sequencing in library selection projects: What insight does it bring? Curr. Opin. Struct. Biol. 33, 146–160 (2015). [DOI] [PMC free article] [PubMed] [Google Scholar]
- 24.Baum P. D., Venturi V., Price D. A., Wrestling with the repertoire: The promise and perils of next generation sequencing for antigen receptors. Eur. J. Immunol. 42, 2834–2839 (2012). [DOI] [PubMed] [Google Scholar]
- 25.Shugay M., Britanova O. V., Merzlyak E. M., Turchaninova M. A., Mamedov I. Z., Tuganbaev T. R., Bolotin D. A., Staroverov D. B., Putintseva E. V., Plevova K., Linnemann C., Shagin D., Pospisilova S., Lukyanov S., Schumacher T. N., Chudakov D. M., Towards error-free profiling of immune repertoires. Nat. Methods 11, 653–655 (2014). [DOI] [PubMed] [Google Scholar]
- 26.DeKosky B. J., Kojima T., Rodin A., Charab W., Ippolito G. C., Ellington A. D., Georgiou G., In-depth determination and analysis of the human paired heavy- and light-chain antibody repertoire. Nat. Med. 21, 86–91 (2015). [DOI] [PubMed] [Google Scholar]
- 27.Vollmers C., Sit R. V., Weinstein J. A., Dekker C. L., Quake S. R., Genetic measurement of memory B-cell recall using antibody repertoire sequencing. Proc. Natl. Acad. Sci. U.S.A. 110, 13463–13468 (2013). [DOI] [PMC free article] [PubMed] [Google Scholar]
- 28.Lu J., Panavas T., Thys K., Aerssens J., Naso M., Fisher J., Rycyzyn M., Sweet R. W., IgG variable region and VH CDR3 diversity in unimmunized mice analyzed by massively parallel sequencing. Mol. Immunol. 57, 274–283 (2014). [DOI] [PubMed] [Google Scholar]
- 29.He L., Sok D., Azadnia P., Hsueh J., Landais E., Simek M., Koff W. C., Poignard P., Burton D. R., Zhu J., Toward a more accurate view of human B-cell repertoire by next-generation sequencing, unbiased repertoire capture and single-molecule barcoding. Sci. Rep. 4, 6778 (2014). [DOI] [PMC free article] [PubMed] [Google Scholar]
- 30.Carlson C. S., Emerson R. O., Sherwood A. M., Desmarais C., Chung M.-W., Parsons J. M., Steen M. S., LaMadrid-Herrmannsfeldt M. A., Williamson D. W., Livingston R. J., Wu D., Wood B. L., Rieder M. J., Robins H., Using synthetic templates to design an unbiased multiplex PCR assay. Nat. Commun. 4, 2680 (2013). [DOI] [PubMed] [Google Scholar]
- 31.Francica J. R., Sheng Z., Zhang Z., Nishimura Y., Shingai M., Ramesh A., Keele B. F., Schmidt S. D., Flynn B. J., Darko S., Lynch R. M., Yamamoto T., Matus-Nicodemos R., Wolinsky D.; NISC Comparative Sequencing Program, Nason M., Valiante N. M., Malyala P., De Gregorio E., Barnett S. W., Singh M., O’Hagan D. T., Koup R. A., Mascola J. R., Martin M. A., Kepler T. B., Douek D. C., Shapiro L., Seder R. A., Analysis of immunoglobulin transcripts and hypermutation following SHIVAD8 infection and protein-plus-adjuvant immunization. Nat. Commun. 6, 6565 (2015). [DOI] [PMC free article] [PubMed] [Google Scholar]
- 32.Tang D. T. P., Plessy C., Salimullah M., Suzuki A. M., Calligaris R., Gustincich S., Carninci P., Suppression of artifacts and barcode bias in high-throughput transcriptome analyses utilizing template switching. Nucleic Acids Res. 41, e44 (2013). [DOI] [PMC free article] [PubMed] [Google Scholar]
- 33.Fu G. K., Wilhelmy J., Stern D., Fan H. C., Fodor S. P. A., Digital encoding of cellular mRNAs enabling precise and absolute gene expression measurement by single-molecule counting. Anal. Chem. 86, 2867–2870 (2014). [DOI] [PMC free article] [PubMed] [Google Scholar]
- 34.Cocquet J., Chong A., Zhang G., Veitia R. A., Reverse transcriptase template switching and false alternative transcripts. Genomics 88, 127–131 (2006). [DOI] [PubMed] [Google Scholar]
- 35.Best K., Oakes T., Heather J. M., Shawe-Taylor J., Chain B., Computational analysis of stochastic heterogeneity in PCR amplification efficiency revealed by single molecule barcoding. Sci. Rep. 5, 14629 (2015). [DOI] [PMC free article] [PubMed] [Google Scholar]
- 36.Jiang L., Schlesinger F., Davis C. A., Zhang Y., Li R., Salit M., Gingeras T. R., Oliver B., Synthetic spike-in standards for RNA-seq experiments. Genome Res. 21, 1543–1551 (2011). [DOI] [PMC free article] [PubMed] [Google Scholar]
- 37.Krebber A., Bornhauser S., Burmester J., Honegger A., Willuda J., Bosshard H. R., Plückthun A., Reliable cloning of functional antibody variable domains from hybridomas and spleen cell repertoires employing a reengineered phage display system. J. Immunol. Methods 201, 35–55 (1997). [DOI] [PubMed] [Google Scholar]
- 38.Shiroguchi K., Jia T. Z., Sims P. A., Xie X. S., Digital RNA sequencing minimizes sequence-dependent bias and amplification noise with optimized single-molecule barcodes. Proc. Natl. Acad. Sci. U.S.A. 109, 1347–1352 (2012). [DOI] [PMC free article] [PubMed] [Google Scholar]
- 39.Kinde I., Wu J., Papadopoulos N., Kinzler K. W., Vogelstein B., Detection and quantification of rare mutations with massively parallel sequencing. Proc. Natl. Acad. Sci. U.S.A. 108, 9530–9535 (2011). [DOI] [PMC free article] [PubMed] [Google Scholar]
- 40.Deakin C. T., Deakin J. J., Ginn S. L., Young P., Humphreys D., Suter C. M., Alexander I. E., Hallwirth C. V., Impact of next-generation sequencing error on analysis of barcoded plasmid libraries of known complexity and sequence. Nucleic Acids Res. 42, e129 (2014). [DOI] [PMC free article] [PubMed] [Google Scholar]
- 41.Brodin J., Hedskog C., Heddini A., Benard E., Neher R. A., Mild M., Albert J., Challenges with using primer IDs to improve accuracy of next generation sequencing. PLOS One 10, e0119123 (2015). [DOI] [PMC free article] [PubMed] [Google Scholar]
- 42.Egorov E. S., Merzlyak E. M., Shelenkov A. A., Britanova O. V., Sharonov G. V., Staroverov D. B., Bolotin D. A., Davydov A. N., Barsova E., Lebedev Y. B., Shugay M., Chudakov D. M., Quantitative profiling of immune repertoires for minor lymphocyte counts using unique molecular identifiers. J. Immunol. 194, 6155–6163 (2015). [DOI] [PubMed] [Google Scholar]
- 43.Kivioja T., Vähärautio A., Karlsson K., Bonke M., Enge M., Linnarsson S., Taipale J., Counting absolute numbers of molecules using unique molecular identifiers. Nat. Methods 9, 72–74 (2011). [DOI] [PubMed] [Google Scholar]
- 44.N. J. Gotelli, R. K. Colwell, Estimating species richness. Biological Diversity: Frontiers in Measurement and Assessment, A. E. Magurran, B. J. McGill, Eds. (Oxford Univ. Press, New York, 2011), pp. 39–54. [Google Scholar]
- 45.Zhu J., Ofek G., Yang Y., Zhang B., Louder M. K., Lu G., McKee K., Pancera M., Skinner J., Zhang Z., Parks R., Eudailey J., Lloyd K. E., Blinn J., Alam S. M., Haynes B. F., Simek M., Burton D. R., Koff W. C.; NISC Comparative Sequencing Program, Mullikin J. C., Mascola J. R., Shapiro L., Kwong P. D., Mining the antibodyome for HIV-1–neutralizing antibodies with next-generation sequencing and phylogenetic pairing of heavy/light chains. Proc. Natl. Acad. Sci. U.S.A. 110, 6470–6475 (2013). [DOI] [PMC free article] [PubMed] [Google Scholar]
- 46.Liao H.-X., Lynch R., Zhou T., Gao F., Alam S. M., Boyd S. D., Fire A. Z., Roskin K. M., Schramm C. A., Zhang Z., Zhu J., Shapiro L.; NISC Comparative Sequencing Program, Mullikin J. C., Gnanakaran S., Hraber P., Wiehe K., Kelsoe G., Yang G., Xia S.-M., Montefiori D. C., Parks R., Lloyd K. E., Scearce R. M., Soderberg K. A., Cohen M., Kamanga G., Louder M. K., Tran L. M., Chen Y., Cai F., Chen S., Moquin S., Du X., Joyce M. G., Srivatsan S., Zhang B., Zheng A., Shaw G. M., Hahn B. H., Kepler T. B., Korber B. T. M., Kwong P. D., Mascola J. R., Haynes B. F., Co-evolution of a broadly neutralizing HIV-1 antibody and founder virus. Nature 496, 469–476 (2013). [DOI] [PMC free article] [PubMed] [Google Scholar]
- 47.Woodsworth D. J., Castellarin M., Holt R. A., Sequence analysis of T-cell repertoires in health and disease. Genome Med. 5, 98 (2013). [DOI] [PMC free article] [PubMed] [Google Scholar]
- 48.Wang B., Kluwe C. A., Lungu O. I., DeKosky B. J., Kerr S. A., Johnson E. L., Jung J., Rezigh A. B., Carroll S. M., Reyes A. N., Bentz J. R., Villanueva I., Altman A. L., Davey R. A., Ellington A. D., Georgiou G., Facile discovery of a diverse panel of anti-Ebola virus antibodies by immune repertoire mining. Sci. Rep. 5, 13926 (2015). [DOI] [PMC free article] [PubMed] [Google Scholar]
- 49.Jarasch A., Koll H., Regula J. T., Bader M., Papadimitriou A., Kettenberger H., Developability assessment during the selection of novel therapeutic antibodies. J. Pharm. Sci. 104, 1885–1898 (2015). [DOI] [PubMed] [Google Scholar]
- 50.Busse C. E., Czogiel I., Braun P., Arndt P. F., Wardemann H., Single-cell based high-throughput sequencing of full-length immunoglobulin heavy and light chain genes. Eur. J. Immunol. 44, 597–603 (2014). [DOI] [PubMed] [Google Scholar]
- 51.Turchaninova M. A., Britanova O. V., Bolotin D. A., Shugay M., Putintseva E. V., Staroverov D. B., Sharonov G., Shcherbo D., Zvyagin I. V., Mamedov I. Z., Linnemann C., Schumacher T. N., Chudakov D. M., Pairing of T-cell receptor chains via emulsion PCR. Eur. J. Immunol. 43, 2507–2515 (2013). [DOI] [PubMed] [Google Scholar]
- 52.Howie B., Sherwood A. M., Berkebile A. D., Berka J., Emerson R. O., Williamson D. W., Kirsch I., Vignali M., Rieder M. J., Carlson C. S., Robins H. S., High-throughput pairing of T cell receptor α and β sequences. Sci. Transl. Med. 7, 301ra131 (2015). [DOI] [PubMed] [Google Scholar]
- 53.Wine Y., Boutz D. R., Lavinder J. J., Miklos A. E., Hughes R. A., Hoi K. H., Jung S. T., Horton A. P., Murrin E. M., Ellington A. D., Marcotte E. M., Georgiou G., Molecular deconvolution of the monoclonal antibodies that comprise the polyclonal serum response. Proc. Natl. Acad. Sci. U.S.A. 110, 2993–2998 (2013). [DOI] [PMC free article] [PubMed] [Google Scholar]
- 54.Lefranc M. P., Giudicelli V., Ginestoux C., Jabado-Michaloud J., Folch G., Bellahcene F., Wu Y., Gemrot E., Brochet X., Lane J., Regnier L., Ehrenmann F., Lefranc G., Duroux P., IMGT®, the international ImMunoGeneTics information system®. Nucleic Acids Res. 37, D1006–D1012 (2009). [DOI] [PMC free article] [PubMed] [Google Scholar]
Associated Data
This section collects any data citations, data availability statements, or supplementary materials included in this article.
Supplementary Materials
Supplementary material for this article is available at http://advances.sciencemag.org/cgi/content/full/2/3/e1501371/DC1
Materials and Methods
Fig. S1. The 5′UTR lengths of mouse IGHV transcripts.
Fig. S2. Antibody synthetic spike-in genes.
Fig. S3. Nucleotide sequence logos of the primer-binding regions of selected spike-in clones.
Fig. S4. Precise library quantification by linking qPCR to ddPCR.
Fig. S5. Annotated example of biological sequence obtained from MAF library preparation.
Fig. S6. Design of experiments (DoE) for library preparation optimization.
Fig. S7. Response surface methodology analysis of clonal frequency bias with uncorrected data.
Fig. S8. Response surface methodology analysis of CDR3 diversity.
Fig. S9. Response surface methodology analysis of clonal frequency bias with MAF-corrected data.
Fig. S10. Comparison of V-gene coverage using new reduced primer set (TAK) and previously published primer set (Reddy-2010).
Fig. S11. Schematic of multistage error correction pipeline.
Fig. S12. Flow chart of multistage error correction pipeline.
Fig. S13. Error correction effects on various bias correction methods.
Fig. S14. Bias correction using MAF V-gene bias factor.
Fig. S15. Comparison of bias correction with a new reduced primer set (TAK) and a previously published primer set (Reddy-2010).
Fig. S16. Comparison of V-gene (germlines) before and after MAF correction.
Fig. S17. The MAF bias factor across V-genes.
Fig. S18. Correlation of MAF bias correction factor across data sets.
Fig. S19. Nominal logistic regression modeling based on Ig-seq clonotype measurements.
Fig. S20. Comparison of the sensitivity and specificity of the nominal logistic regression models.
Fig. S21. Comparison of factor correlations with prediction probabilities of the nominal logistic regression models.
Fig. S22. Various immune profiling metrics from MAF-corrected Ig-seq data.
Fig. S23. Processing time of reads for MAF error and bias correction pipeline.
Fig. S24. Effect of the number of reads analyzed using final MAF sample preparation conditions.
Table S1. Ig-seq read count statistics for spike-ins following replicate library preparation by singleplex PCR (see fig. S2, B and C).
Table S2. Ig-seq read count statistics following MAF library preparation by multiplex PCR (see Fig. 2A).
Table S3. A comparison of the VDJ annotation tool used in this study (modified from Laserson et al. (12) with IMGT HighV-Quest.
Table. S4. Ig-seq read count statistics for DoE for library preparation optimization.
Table S5. A complete list of primers and sequences used in this study.
Table S6. Error correction statistics for spike in clones.
Table S7. Expanded Ig-seq processing statistics.
Table S8. Synthetic genes used in this study.