

Abstract
Diminished bone density and skeletal fractures are common morbidities during and following therapy for acute lymphoblastic leukemia (ALL). While cumulative doses of osteotoxic chemotherapy for ALL have been reported to adversely impact bone density, the timing of onset of this effect as well as other changes to bone structure are not well characterized. We therefore conducted a prospective cohort study in pre-adolescent and adolescent patients (10-21 years) newly diagnosed with ALL (n=38) to explore leukemia-related changes to bone at diagnosis and the subsequent impact of the first phase of chemotherapy (“Induction”). Using quantitative computerized tomography (QCT), we found that pre-chemotherapy bone properties were similar to age- and sex-matched controls. Subsequently over the one month Induction period, however, cancellous volumetric bone mineral density (vBMD) decreased markedly (-26.8%, p<0.001) with sparing of cortical vBMD (tibia -0.0%, p=0.860, femur -0.7%, p=0.290). The tibia underwent significant cortical thinning (average cortical thickness -1.2%, p<0.001; cortical area -0.4%, p=0.014), while the femur was less affected. Areal BMD (aBMD) concurrently measured by dual-energy X-ray absorptiometry (DXA) underestimated changes from baseline as compared to vBMD. Biochemical evidence revealed prevalent Vitamin D insufficiency and a net resorptive state at start and end of Induction. Our findings demonstrate for the first time that significant alterations to cancellous and cortical bone develop during the first month of treatment, far earlier during ALL therapy than previously considered. Given that osteotoxic chemotherapy is integral to curative regimens for ALL, these results provide reason to re-evaluate traditional approaches toward chemotherapy-associated bone toxicity and highlight the urgent need for investigation into interventions to mitigate this common adverse effect.
Keywords: Acute lymphoblastic leukemia, Chemotherapy, Bone, Bone mineral density, QCT, DXA
1. Introduction
Chemotherapy for pediatric acute lymphoblastic leukemia (ALL) is known to adversely impact bone density and is associated with skeletal fractures [1-4]. Recent reports have described the onset of osteotoxicity earlier than previously thought with bone changes now understood to primarily occur during active therapy [5, 6] with potential improvement for some in the years following therapy [7, 8]. While the etiology for the adverse influence of ALL therapy on bone is likely multi-factorial, a significant contributor is prolonged and repetitive high-dose glucocorticoid steroids given throughout the two to three years of ALL treatment [9]. Prior studies of osteotoxicity have therefore principally focused on the cumulative effects of ALL treatment on bone density after months or even years of ALL therapy [10-14]. Yet, ALL therapy commonly begins with a treatment phase (Induction) that relies o[8]n an established backbone of glucocorticoid steroids to obtain the crucial initial remission. Recently, the large Canadian “STeroid-associated Osteoporosis in the Pediatric Population (STOPP)” clinical trial revealed that occult fractures and vertebral compression are already frequent occurrences even during this first treatment phase. However, many studies that have examined bone during this early time period, including the STOPP trial [15] and others [13, 16], have grouped much, or all, of Induction chemotherapy into a single cross-sectional time-point, thereby precluding examination of changes to bone during Induction itself from the days or weeks of osteotoxic chemotherapy [16].
In the present study, we sought to address this knowledge gap through focusing specifically on changes to bone during the Induction phase and to gain greater insight into potential changes due to leukemia infiltration of the marrow even prior to therapy. Use of the advanced imaging modality of quantitative computerized tomography (QCT) provided the opportunity to gain detailed information on bone properties, such as three-dimensional volumetric BMD (vBMD), bone geometry, and other contributors to bone strength. As much of the existing bone density literature in ALL uses the well-validated, and more commonly available, dual-energy x-ray absorptiometry (DXA) to assess areal BMD (aBMD) [12, 17, 18], we concurrently assessed whole body aBMD in our cohort with DXA as well. To our knowledge, this is the first study to use QCT to determine detailed bone structure and density at the time of diagnosis and to focus on early changes from Induction therapy for childhood ALL.
2. Materials and Methods
2.1 Study Population
Pre-adolescents, adolescents and young adults (AYA) at least ten and less than 21 years of age newly diagnosed with National Cancer Institute/Rome High-Risk B-Precursor (HR BP-ALL) or T-cell ALL were enrolled in a prospective study of osteotoxicity within 24 hours from the initiation of Induction chemotherapy. An AYA population was selected for study as an at-risk target population with greater rates of chemotherapy-induced osteotoxicity [19, 20]. All patients were treated following Children's Oncology Group (COG) protocols (AALL0232, AALL1131, AALL0434) and uniformly received a 28 day Induction regimen using vincristine, pegylated L-asparaginase, anthracycline (daunorubicin or doxorubicin), and a glucocorticoid (either prednisone 60mg/m2/day for 28 days or dexamethasone 10mg/m2/day for 14 days). Due to toxicity from the treatment intensity of Induction chemotherapy, not all subjects were able to complete all imaging and assessments (Supplemental Fig. 1, Consort diagram). Demographic and treatment information included age, sex, ethnicity, Body Mass Index percentile (BMI%), leukemia phenotype, treatment regimen, and cumulative steroid dose delivered. For evaluation of bone density, geometry, and estimated biomechanical resistance to force at the time of diagnosis (i.e. due to onset of the leukemia), bone density, geometry, and structural properties in the treatment group were compared to healthy children recruited separately at our institution for prospective studies of bone. The individual cohorts for vertebral and tibia comparisons were drawn from two separate studies of children free of chronic disease, not on steroids or medications affecting growth and development, and without metal implants precluding imaging. Matched controls were selected from these healthy cohorts based on age (+/- 0.1 years) and sex for comparison of bone measures and body composition. No control group for femur comparison was available. The clinical trial was approved by the Institutional Review Board and federally registered (NCT01317940). Informed consent was obtained for all subjects.
2.2 Imaging Protocols
Subjects underwent imaging within 96 hours from start of chemotherapy and again 28-35 days later at the end of the Induction phase and prior to any subsequent chemotherapy. Subjects were imaged using QCT; to reduce operator-induced intra-patient (for serial imaging) and inter-patient variability in radiographic assessment, all imaging was performed primarily by the same certified radiology technician. The lumbar spine was assessed in all participants using a scan of the L1-L3 vertebrae, and femurs and tibias were assessed at the mid-shaft. For the spine, the site to be scanned was identified with a lateral scout view, and a single 10-mm axial slice was obtained at the mid-portion of each of the three vertebral bodies – L1, L2, and L3. For the femur, the site to be scanned was identified visually as the midpoint between the most distal and central aspect of the patella and the greater trochanter, and a single 10 mm slice was obtained at the femoral mid-shaft. For the tibia, contiguous 1-mm slices were obtained covering the entire tibia. One slice halfway between the tibial plateau and the most distal point of the medial malleolus was then selected for analysis. All femur and spine scans were performed on the same scanner (General Electric LightSpeed QX/I, Milwaukee, WI) using the same mineral reference phantom for simultaneous calibration (CT-T bone densitometry package; General Electric). All tibia scans were completed using a different scanner (Philips Gemini GXL, Philips Medical Systems Inc., Cleveland, OH) and mineral reference phantom (Mindways Model 3 CT Calibration Phantom, Philips Gemini GXL, Philips Medical Systems Inc., Cleveland, OH).
Image analysis for the femur and tibia was done using custom algorithms in Matlab version R2013b (Mathworks, Natick, MA). For the diaphysis, geometric properties were calculated using contours from edge detection based on the density gradient between neighboring voxels and included average cortical bone density, total bone area, cortical bone area, medullary canal area, average cortical bone thickness, maximum principal (Imax), minimum (Imin) principal, and polar (J) moments of inertia, and average marrow density. Of note, the site was changed from tibia to femur midway through the study due to logistical changes at our institution; nonetheless, this adjustment provided the ability for us to compare change in cortical bone at two lower extremity sites.
For aBMD, a fan beam DXA densitometer (Delphi W; Hologic, Inc., Waltham, MA) in array mode was used and analyzed with the manufacturer's software. The coefficients of variation for measurements of fat, lean mass, and bone mineral content (BMC) are between 1.2 and 5% [21]. Since the primary comparison to a healthy cohort was established with QCT, to limit radiation exposure only whole-body DXA was performed to compare changes in BMD by the two modalities. Percent change from baseline during Induction for aBMD was calculated from whole body DXA for “Total body less head” (TBLH) and for the spine (total, thoracic, lumbar) from BMC divided by bone area.
2.3 Biochemical Analysis of Bone Metabolism
Serum from the ALL cohort was analyzed for markers of bone metabolism at diagnosis and end of Induction. Blood was collected within 24 hours of beginning therapy; in 92% of patients (35/38), samples were collected prior to the start of chemotherapy. Vitamin D status was evaluated via 25-hydroxy vitamin D (25OHD) and 1,25-dihydroxy vitamin D (1,25OHD) performed by liquid chromatography tandem mass spectrometry at Quest Diagnostics Nichols Institute (San Juan Capistrano, CA). Phosphorus, corrected calcium (cCa, calculated due to prevalent hypo-albuminemia from inflammation, malnutrition, and chemotherapy effect), intact parathyroid hormone (PTH), bone-specific alkaline phosphatase (BS-Alk), osteocalcin (Ost), and c-telopeptide (Ctx) were analyzed as markers of bone turnover.
2.4 Statistical Analysis
BMI percentiles (BMI%) were calculated for each subject from population age- and sex-specific norms as per the Centers for Disease Control and Prevention[22]. For comparison of age- and sex- matched controls, continuous variables were analyzed by independent t-tests and categorical variables by Fisher exact test of proportions. As no significant differences were noted with respect to body size, no specific adjustment was made for tibial length (as above, no comparison was available for femurs); nonetheless, a confirmatory analysis was performed including height as a covariate for approximate tibial adjustment and revealed no significant differences for all QCT comparisons (data not shown). For comparison of change in bone during Induction, significance was determined using paired t-tests to compare pre- and post-Induction QCT measurements and aBMD by DXA. Mean percent change from baseline was also calculated for each measure and presented for ease of clinical interpretability. The effect of steroid type and/or cumulative steroid dose on percent change in QCT measurements was analyzed using the K-S test for non-parametric continuous distributions. As per the most recent 2011 Institute of Medicine report, Vitamin D status was categorized as insufficient or deficient based on a serum 25OHD <20ng/ml or <12ng/ml respectively [23]. Biochemical values of bone metabolism and Vitamin D status pre- and post-Induction were analyzed using a paired t-test or non-parametric paired Wilcoxon rank-sign test. All analyses were two-sided with significance set at p<0.05. Calculations were performed in STATA (StataCorp. 2009. Stata Statistical Software: Release 11. College Station, TX: StataCorp LP).
3. Results
3.1 Effect of Leukemia on Bone at Diagnosis
Of the 51 subjects enrolled on study, 38 were able to complete imaging at diagnosis and were included in the analysis for comparison to healthy controls. The majority of subjects in the ALL cohort were male (58%, n=22/38), Hispanic (84%, n=32/38), with an average age of 14.6 years (range 9.9– 19.6). Eighteen of these 38 subjects had imaging at the tibia site. As shown in Tables 1 and 2, the subjects in the age- and sex- matched groups did not differ significantly in height, weight, or body composition (by BMI% or DXA respectively). In the tibia sub-cohort a slight but significant preponderance of Hispanic individuals was present in the ALL group. Subjects and controls in the vertebrae and cortical bone subsets were well matched by age (p=0.989 and 0.699, respectively [Table 1 and 2]).
Table 1. Comparison of ALL cohort at diagnosis to age- and sex-matched healthy controls (n=38).
| Measures | At Diagnosis Mean ±SD | Control Subjects Mean ±SD | p-value1 |
|---|---|---|---|
| Subjects Characteristics | |||
| Age (Years) | 14.6 ±2.7 | 14.6 ±2.7 | 0.989 |
| Sex, n (%) Male | 22 (58) | 22 (58) | 1.000 |
| Ethnicity, n (%), Hispanic | 32 (84) | 26 (68) | 0.176 |
| Height (cm) | 159.5 ±12.1 | 159.5 ±11.9 | 0.986 |
| Weight (kg) | 62.8 ±22.5 | 57.8 ±14.3 | 0.252 |
| BMI Percentile | 69.9 ±33.1 | 63.32 ±26.1 | 0.597 |
| Underweight, n (%) | 0 (0) | 2 (5) | - |
| Normal, n (%) | 25 (66) | 16 (42) | - |
| Overweight, n (%) | 7 (18) | 10 (26) | - |
| Obese, n (%) | 6 (16) | 10 (26) | - |
| Characteristics of Cancellous Bone2 | |||
| Vertebral Bone Density (mg/cm3) | 180.9 ±34.0 | 172.5 ±26.4 | 0.230 |
Two-sided independent t-tests or Fisher exact test. Significance set at α<0.05. BMI percentiles compared, category presented descriptively only;
As measured with quantitative computed tomography (qCT). See methods for additional details.
BMI= body mass index. ALL=Acute lymphoblastic leukemia.
Table 2. Comparison of ALL tibia sub-cohort at diagnosis to age- and sex- matched healthy controls (n=18).
| Measures | At Diagnosis Mean ±SD | Control Subjects Mean ±SD | p-value1 |
|---|---|---|---|
| Subjects Characteristics | |||
| Age (Years) | 14.3 ±2.7 | 14.0 ±2.4 | 0.699 |
| Sex, n(%), Male | 9 (50%) | 9 (50%) | 1.000 |
| Ethnicity, n(%), Hispanic | 15 (83%) | 10 (56%) | 0.035 |
| Height (cm) | 160.3 ±14.0 | 159.7 ±153.4 | 0.899 |
| Weight (kg) | 57.2 ±22.8 | 57.3 ±17.2 | 0.995 |
| BMI Percentile | 56.5 ±38.8 | 60.2 ±32.3 | 0.756 |
| Characteristics of Cortical Bone3 | |||
| Bone Density (mg/cm3) | 1,036.7 ±72.3 | 1,041.0 ±45.9 | 0.583 |
| Cortical Area (mm2) | 307.7 ±83.5 | 310.0 ±16.9 | 0.924 |
| Medullary Canal Area (mm3) | 95.2 ±32.4 | 95.7 ±26.5 | 0.958 |
| Max Cortical Thickness (mm) | 10.1 ±2.0 | 10.4 ±1.9 | 0.633 |
| Avg Cortical Thickness (mm) | 5.8 ±1.0 | 5.9 ±0.8 | 0.755 |
| Imax (mm4) | 19,555 ±10,062 | 19,584 ±85,136 | 0.993 |
| Imin (mm4) | 8,959 ±4,459 | 8,924 ±3,649 | 0.980 |
| J (mm4) | 28,514 ±14,350 | 28,509 ±11,940 | 0.999 |
| Avg Marrow Density (mg/cm3)4 | 42.5 ±34.1 | -3.7 ±18.5 | <0.001 |
Two-sided independent t-tests or Fisher's exact test. Significance set at α<0.05 (bolded);
As measured by dual-energy X-ray absorptiometry;
As measured with peripheral quantitative computed tomography (pQCT). See methods for additional details;
Calculated by imaging software in reference to density of water, a negative value indicates less dense than water (e.g. fat).
BMI = body mass index. Avg= average. I = principal moment of inertia. J = polar moment of inertia. ALL=Acute lymphoblastic leukemia
No significant differences were found between healthy volunteers and ALL patients at the time of diagnosis in assessment of vBMD of cancellous or cortical bone, nor of bone geometry or structural properties (Tables 1 and 2). The ALL cohort was noted to have a higher average marrow density when compared to the healthy controls (42.5±34.1 mg/cm3 vs -3.7±18.5 mg/cm3 respectively, p<0.001) as expected due to the high cellularity of the leukemia-infiltrated bone marrow. Of note, the average medullary canal area was not larger in the ALL group (95.2±32.4mm2 to 95.7±26.5mm2, p=0.958). Only one patient in the ALL cohort had a clinically symptomatic fracture at time of diagnosis (compression fractures of the lumbar vertebrae). This patient had the lowest cancellous vBMD and average cortical thickness in the ALL cohort, but demonstrated no other differences in bone density or geometry as compared to the healthy control group or to the remainder of the ALL cohort.
3.2 Changes in Bone Structure during Induction
Of the 38 subjects who completed imaging at diagnosis, 35 (92%, n=35/38) were sufficiently well enough to be imaged upon completion of Induction (Table 3). At the end of Induction, cancellous vBMD (as measured in the spine) exhibited significant declines, from 178.5±33.1 mg/cm3 to 131.0±35.4 mg/cm3 (p<0.001), representing a median loss of 26.8% (95%CI -34.1,-21.6). In contrast, cortical vBMD, analyzed at either the tibia (n=18/35) or femur (n=17/35), was relatively spared with no significant changes during the same period. Cortical bone was not unaffected, however, with early changes to key elements of bone geometry affecting the tibia more than the femur: by the end of the 28 day Induction period, statistically significant decreases from baseline in cortical area in the tibia were already present (-0.4% [95%CI -0.7,-0.1], p=0.014) along with thinning of the cortical bone as evidenced by decreased average thickness (-1.2% [95%CI -1.5, -0.4], p<0.001). These changes corresponded to an increased medullary canal area (+1.7% [95%CI 0.1, 3.6], p=0.004). It should be noted that although substantially variability in these measures was present between subjects, the relative changes in these values were highly consistent. The femur evidenced similar trends in thinning of the cortical bone, although these did not reach statistical significance by the end of Induction. No significant changes were noted in the moments of inertia: Imin, Imax, J.
Table 3. Changes in Volumetric Bone Mineral Density, Geometry, and Strength during Induction by qCT (n=35).
| Bone Measures1 | Percent Change2 Median (95%CI) | At Diagnosis (Mean ±SD) | End-Induction (Mean ±SD) | p-value3 |
|---|---|---|---|---|
| Cancellous vBMD (mg/cm3) | ||||
| Vertebrae | -26.8 (-34.1,-21.6) | 178.5 ±33.1 | 131.0 ±35.4 | <0.001 |
|
| ||||
| Cortical vBMD (mg/cm3) | ||||
| Overall | 0.2 (-0.6,1.0) | N/A | ||
| Tibia | 0.0 (-0.7,0.9) | 1,036.7 ±72.3 | 1,037.2 ±69.0 | 0.860 |
| Femur | 0.7 (-0.8, 1.9) | 1,199.6 ±36.2 | 1,205.8 ±42.3 | 0.290 |
|
| ||||
| Cortical Area (mm2) | ||||
| Overall | -0.3 (-0.7,0.2) | N/A | ||
| Tibia | -0.4 (-0.7,-0.1) | 307.7 ±83.5 | 306.4 ±82.9 | 0.014 |
| Femur | 0.1 (-2.1,2.0) | 393.67 ±85.9 | 384.4 ±88.2 | 0.840 |
|
| ||||
| Medullary Canal Area (mm3) | ||||
| Overall | 2.1 (0.6,4.4) | N/A | ||
| Tibia | 1.7 (0.1, 3.6) | 95.2 ±32.4 | 97.1 ±32.8 | 0.004 |
| Femur | 4.4 (-6.5,8.2) | 124.0 ±22.3 | 128.8 ±28.2 | 0.430 |
|
| ||||
| Max Cortical Thickness (mm) | ||||
| Overall | -0.9 (-1.4,-0.1) | N/A | ||
| Tibia | -0.8 (-1.4,-0.1) | 10.1 ±2.0 | 10.0 ±1.9 | 0.012 |
| Femur | -1.2 (-3.4, 0.2) | 8.9 ±1.8 | 8.8 ±1.8 | 0.420 |
|
| ||||
| Avg Cortical Thickness (mm) | ||||
| Overall | -1.1 (-1.5,-0.1) | N/A | ||
| Tibia | -1.2 (-1.5,-0.4) | 5.9 ±1.0 | 5.8 ±1.0 | <0.001 |
| Femur | -0.3 (-4.2,3.1) | 6.4 ±1.1 | 6.4 ±1.2 | 0.740 |
|
| ||||
| Imax (mm4) | ||||
| Overall | 0.1 (-0.4,0.9) | N/A | ||
| Tibia | 0.5 (-0.4,1.0) | 19,555 ±10,062 | 19,599 ±10,027 | 0.550 |
| Femur | -0.1 (-2.4,1.5) | 24,686 ±10,787 | 24,731 ±10,504 | 0.860 |
|
| ||||
| Imin (mm4) | ||||
| Overall | 0.5 (-0.3,0.9) | N/A | ||
| Tibia | 0.2 (-0.3,0.7) | 8,959 ±4,459 | 8,952 ±4,399 | 0.850 |
| Femur | 2.4 (-0.3,2.9) | 16,494 ±6,050 | 16,913 ±5,888 | 0.063 |
|
| ||||
| J (mm4) | ||||
| Overall | 0.5 (-0.3,0.8) | N/A | ||
| Tibia | 0.3 (-0.4,0.7) | 28,514 ±14,350 | 28,551 ±14,256 | 0.730 |
| Femur | 0.6 (-0.8,1.9) | 41,181 ±16,472 | 41,644 ±16,132 | 0.180 |
qCT as measured mid-shaft at tibia (n=18) and femur (n=17). See methods and supplementary material for additional details.
Median percent change calculated from baseline.
Two-sided paired t-test comparing at diagnosis versus end induction; significance set at α<0.05 (bolded).
vBMD = volumetric bone mineral density, 95%CI = 95% Confidence Interval. Avg= Average. I = principal moment of inertia. J = polar moment of inertia.
Comparison of steroid type revealed no significant differences noted in vBMD, bone geometry, and bone structural properties between those who received a 28-day prednisone-based Induction (83%, n=29/35, mean cumulative dose 2,776±504.4 mg) versus a 14-day dexamethasone-based Induction (17%, n=6/35, mean cumulative dose 230±63.4 mg) (Table 4). Those who received the prednisone-based Induction had slightly greater declines in cancellous vBMD although this did not reach statistical significance. Concurrent evaluation of change in bone density by DXA revealed aBMD for TBLH was normal at time of diagnosis per population norms (z-score 0.28, SD 1.18) but then decreased from baseline during Induction for TBLH (-2.5% [95%CI -3.2, -1.8], p<0.001) and in the spine (total spine -2.7% [95%CI -4.6, 0.2], p<0.003; thoracic -0.1%[95%CI -3.4, 0.8], p<0.171; lumbar -2.0% [95%CI -5.9, 0.77], p<0.013). While this loss of bone mineral density was consistent with that found using vBMD, the magnitudes of change were consistently less than that found when bone type was delineated by QCT.
Table 4. Comparison of Percent Change1 from Baseline in Bone Measures by Steroid Type.
| Bone Measures1 | Prednisone Median2 (%) [95%CI] | Dexamethasone Median2 (%) [95%CI] | p-value3 |
|---|---|---|---|
| Cancellous vBMD (mg/cm3) | -27.9 [-34.2, -21.7] | -21.1 [-38.3, -7.2] | 0.283 |
| Cortical vBMD (mg/cm3) | 0.2 [-0.7, 1.3] | 0.3 [-0.6, 0.9] | 0.238 |
| Cortical Area (mm2) | -0.3 [-1.0, 0.0] | 0.2 [-1.0, 6.2] | 0.410 |
| Medullary Canal Area (mm2) | 3.1 [0.2, 4.6] | 0.6 [-23.9, 4.3] | 0.156 |
| Max Cortical Thickness (mm) | -0.9 [-1.6, 0.1] | -0.5 [-1.1, 0.1] | 0.113 |
| Avg Cortical Thickness (mm) | -1.3 [-1.6, -0.2] | -0.2 [-1.4, 10.8] | 0.225 |
| Imax (mm4) | -0.1 [-0.5, 0.9] | 0.5 [-5.4, 1.3] | 0.742 |
| Imin (mm4) | 0.4 [-0.3, 1.2] | 0.7 [-2.1, 3.4] | 0.855 |
| J (mm4) | 0.5 [-0.4, 0.8] | 0.5 [-2.0, 1.8] | 0.643 |
Bone measures presented for combined tibia+femur cohorts. See methods for additional details.
Median percent change calculated from baseline
Two-sample K-S test; significance set at α<0.05.
vBMD = volumetric bone mineral density, 95%CI = 95% Confidence Interval. Avg= Average. I = moment of inertia. J = polar moment of inertia
3.3 Biochemical Markers of Bone Metabolism
Changes during Induction to markers of bone metabolism were also examined. At diagnosis, all 38 subjects were evaluable and two thirds of the cohort (n=25/38, 66%) were either Vitamin D insufficient (<20 ng/mL; n=21/38, 55%) or deficient (<12 ng/mL; n=4/38, 11%) and remained so at the end of Induction (n=20/38 and 2/38 respectively). The active moiety 1,25OHD was within normal limits and did not change over Induction (mean 47.6±27.9 pg/ml vs 45.6±18.4 pg/ml, p=0.758). Significant changes from baseline were seen in Ctx, phosphorus, and cCa (Fig. 1A, 1E, 1F). At diagnosis, serum phosphorus was elevated as would be expected due to leukemia burden and then declined once in remission. Serum markers of bone metabolism demonstrated an overall balance toward bone resorption at the end of Induction with marked elevation in Ctx (Fig. 1A) but no corresponding increases in indicators of bone formation (Ost/Fig. 1B, BS-Alk/Fig. 1C). These findings are consistent with the observed declines in bone mineral density and cortical bone during Induction.
Figure 1. Change in Markers of Bone Metabolism during Induction.
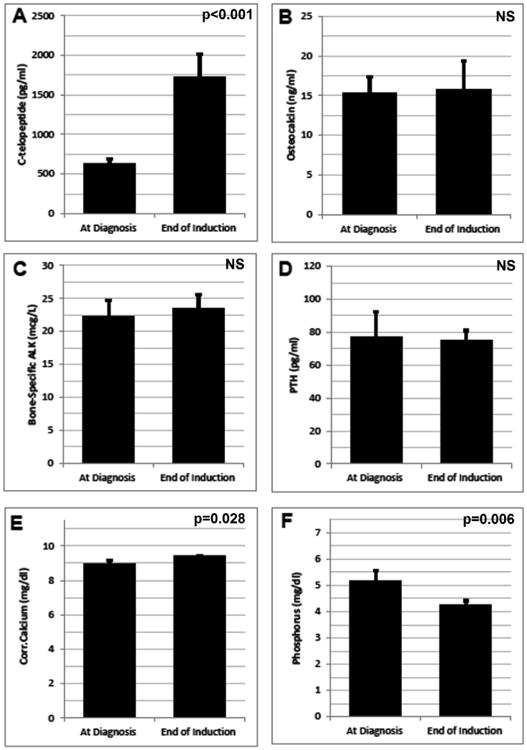
Serum markers of bone metabolism were measured at time of diagnosis and again at the end of Induction. Mean ±SEM for the subset with complete pre- and post- imaging are depicted above, (A) C-telopeptide, (B) Osteocalcin, (C) Bone-specific alkaline phosphatase (D) parathyroid hormone [PTH], (E) Corrected Calcium (corrected for serum albumin), and (F) phosphorus. For the PTH assay, normal values by age (in years) are as follows: 10-13 (11-74 pg/ml), 14-17 (9-69 pg/ml), >17 (14-64 pg/ml). All statistical comparisons performed via paired t-test or paired Wilcoxon sign-rank text, significance set at p<0.05. NS = not significant.
4. Discussion
We present here the first detailed study using QCT to examine bone density and structure at diagnosis and during early therapy for newly diagnosed pediatric ALL. We documented a dramatic decline in cancellous vBMD during the first month of treatment, along with evidence of early thinning of cortical bone, as measured by QCT. We did not detect declines in moments of inertia derived from imaging technology of the bone during Induction. This suggests that bone strength in the diaphysis may be relatively preserved, although the relationship of these parameters to bone fragility has not been conclusively proven in vivo. While the disparity between cancellous and cortical bone may not be surprising given that cortical bone resorption is a slower process compared to cancellous bone [24], the presence of significant changes even in cortical bone during such a short time-frame is potentially concerning. A corresponding evaluation of aBMD by the more commonly available DXA revealed the same significant pattern of bone loss within the first month, albeit with pronounced underestimation relative to vBMD. This discrepancy between aBMD and vBMD has been previously reported in other pediatric populations [25, 26] and raises the question of what potential role QCT may contribute to surveillance of osteotoxicity. Nonetheless, serum markers of bone metabolism corresponded with the findings on imaging and were consistent with a net resorptive state. To our knowledge, this is the first report indicating that clinically significant bone loss from ALL therapy is already evident by the end of the first month of therapy, rather than after months of treatment and inactivity. Further, because there was no difference in bone characteristics between patients at diagnosis and healthy controls, our findings indicate that bone morbidity at end of Induction primarily represents effects of treatment rather than the leukemia itself.
These findings were most pronounced in the vertebrae, where children in our cohort lost from 6 – 54% of their starting vBMD within a single month. For context, studies of the lumbar spine in healthy adults have demonstrated loss of approximately one to three percent of cancellous vBMD per year over decades [27]. The relative susceptibility of cancellous bone to Induction chemotherapy could account for the high prevalence of vertebral fractures noted in ALL populations [13], but does not explain the 8-10% prevalence of vertebral or other fractures prior to chemotherapy [13, 28]. In fact, comparisons of bone measures at diagnosis to a group of non-leukemic controls showed no significant differences across all measures of bone density, geometry, and structural properties. Similarly, the aBMD was not markedly different in the ALL cohort as compared to population norms [29]. As only one child in our cohort experienced a pre-chemotherapy clinically symptomatic vertebral fracture, we were unable to explore this further. The etiology of these fractures remains unclear and additional investigation is needed to assess bone geometry and strength in children with fractures at diagnosis versus those without.
Conversely, we found vBMD of cortical bone was almost completely spared in our cohort. Fracture risk to long bones, however, is associated with changes to bone geometry, specifically cortical area and cortical thickness, even without deterioration of vBMD [30-32]. In our cohort, even during this short period, cortical bone showed evidence of such cortical thinning, with the tibia affected more than the femur. While risk for fracture during Induction is mitigated by the relative inactivity of children during this period [33], these early changes to bone likely contribute to increased fracture risk when activity increases later in treatment [10, 34]. The greater sensitivity of the tibia to chemotherapy found at this early point is also consistent with the nine-fold increased risk for later fracture in the tibia versus femur [10]. As our study was not powered to quantify the effect size for changes in individual aspects of bone geometry, however, further research remains necessary to elucidate the contribution of these early changes to fracture risk, assess changes from continued chemotherapy, and to determine whether the sensitivity offered by QCT should therefore be incorporated into clinical monitoring.
Despite normal bone density and structure at diagnosis, we found the prevalence of Vitamin D insufficiency and deficiency to be double that reported in the general population (less than one-third) [35]. While the cohort had normal levels of the active Vitamin D 1,25OHD moiety (as well as calcium), the lack of adequate Vitamin D stores may have impaired the ability to adequately compensate for the effects of osteotoxic chemotherapy. Previous cohorts have shown decreased bone turnover (both formation and resorption) during a steroid-based Induction regimen [36]. In our cohort, however, we found biochemical evidence of increased bone degradation, without increases in bone formation/modelling/remodeling, which would signify a net resorptive state. As clearance of bone turnover markers may be affected by chemotherapy and/or the initial associated hyper-hydration, interpretation of bone marrow markers is challenging in the context of ALL therapy. Nonetheless, the overall resorptive trend identified via the serum markers is consistent with the changes noted to bone density and structure on imaging.
The strengths of this study lie in the use of QCT and simultaneous DXA to provide a detailed analysis of early changes to bone density, structure, and geometry in a prospective AYA cohort. We recognize, however, the limitations of these imaging modalities in their inability to delineate the contributions from bone mineral, cellular composition, lipids, and water to the measured tissue density. The changes seen in this study, and in others relying on QCT, thus actually reflect differences in the multiple components that constitute cancellous bone, including changes in marrow cellularity from leukemia, and not mineral content alone. While it is therefore not possible to quantify the decrease in bone mineral content per se, the comparison to a healthy cohort shows these declines are not due to false elevations of vBMD from changes in the marrow compartment alone, but represent true changes from baseline in “whole” cancellous vBMD, a measure strongly associated with risk for fracture in children [27, 31]. Further, vertebral morphometry was not measured in the study, and therefore changes to vertebral height and occult fractures could not be assessed. The low prevalence (1/38) of diagnosed fractures (ie. due to symptoms) and the absence of vertebral morphometry precluded analysis of the relative contributions to fracture risk from changes to bone density and structure. Similarly, the high prevalence of Vitamin D insufficiency/deficiency prevented analysis of its influence on changes in bone during Induction. We acknowledge that we could not compare sexual maturity level to the healthy control groups as the data was not available; while this is mitigated somewhat by matching of age and sex, this could contribute some additional variability not incorporated. We would note, however, that this does not affect the primary finding of our study regarding changes in bone during Induction.
Our study cohort represented a predominantly Hispanic AYA population. Whether ethnicity contributes to bone density is controversial [37, 38], but further study is needed across younger age groups and a wider demographic to determine if the effects are consistent across populations. Nonetheless, the early changes to bone found in this study emphasize the need to develop effective interventions and raises the question of whether preventive measures beginning at the time of diagnosis may be necessary to mitigate the adverse influence of osteotoxic chemotherapy. Previous studies to positively influence bone density using Vitamin D[39] or exercise [40] were both implemented subsequent to Induction and were not successful. However, using a combination approach of both Vitamin D and exercise, as is typically recommended [41], and beginning the intervention concurrent with Induction therapy, may provide benefit where the previous studies did not. Bisphosphonate therapy during leukemia treatment might be an alternative approach, and one that has been demonstrated to increase bone mineral density in children with leukemia[42]. Inclusion early in therapy in a preventive approach might prove effective to maintain bone density and architecture, although any oncologic effects from inclusion into Induction chemotherapy and the mostly unknown long-term side effects of such approaches would have to be carefully considered. With increasing long-term survival from pediatric ALL, increasing attention needs to be focused on determining the significance of these early changes to bone density and structure as a threshold step toward future study of rationally-directed interventions to prevent acute and delayed morbidity.
Supplementary Material
Highlights.
Newly diagnosed leukemia does not significantly affect bone density and structure as compared to a healthy cohort of children
Osteotoxic chemotherapy for childhood acute lymphoblastic leukemia significantly affects bone health during the initial month of chemotherapy alone
DXA underestimates specific aspects of osteotoxicity as compared to QCT
Further research is necessary to delineate the clinical role of qCT in monitoring changes to bone during ALL chemotherapy
Acknowledgments
We would like to thank the Leukemia and Lymphoma Society, the Southern California Clinical and Translational Science Institute (under the National Center for Advancing Translational Sciences), and the Eunice Kennedy Shriver National Institute of Child Health and Human Development for their generous support of this research. We would also like to thank the patients and families who participated and Swati Gulati and Devin Murphy, the study coordinators, for their enthusiasm and dedication to the study.
Research reported in this publication was supported by:
A Translational Research Program grant (LLS-6249-11) from the Leukemia and Lymphoma Society
The Eunice Kennedy Shriver National Institute of Child Health and Human Development/NIH (5R01HD059826).
The National Center for Advancing Translational Sciences/NIH (UL1TR000130) via the Southern California Clinical and Translational Science Institute at the Children's Hospital Los Angeles.
The content contained herein is solely the responsibility of the authors and does not necessarily represent the official views of the National Institutes of Health.
Footnotes
These results have not been previously presented
Clinical Trial Registration # NCT01317940
Disclosure Statement: The authors have nothing to disclose
Publisher's Disclaimer: This is a PDF file of an unedited manuscript that has been accepted for publication. As a service to our customers we are providing this early version of the manuscript. The manuscript will undergo copyediting, typesetting, and review of the resulting proof before it is published in its final citable form. Please note that during the production process errors may be discovered which could affect the content, and all legal disclaimers that apply to the journal pertain.
References
- 1.Elmantaser M, Stewart G, Young D, Duncan R, Gibson B, Ahmed SF. Skeletal morbidity in children receiving chemotherapy for acute lymphoblastic leukaemia. Arch Dis Child. 2010;95:805–9. doi: 10.1136/adc.2009.172528. [DOI] [PubMed] [Google Scholar]
- 2.van der Sluis IM, van den Heuvel-Eibrink MM, Hählen K, Krenning EP, de Muinck Keizer-Schrama SM. Altered bone mineral density and body composition, and increased fracture risk in childhood acute lymphoblastic leukemia. J Pediatr. 2002;141:204–10. doi: 10.1067/mpd.2002.125728. [DOI] [PubMed] [Google Scholar]
- 3.Haddy TB, Mosher RB, Reaman GH. Late effects in long-term survivors after treatment for childhood acute leukemia. Clin Pediatr (Phila) 2009;48:601–8. doi: 10.1177/0009922809332680. [DOI] [PubMed] [Google Scholar]
- 4.den Hoed MA, Klap BC, te Winkel ML, Pieters R, van Waas M, Neggers SJ, Boot AM, Blijdorp K, van Dorp W, Pluijm SM, van den Heuvel-Eibrink MM. Bone mineral density after childhood cancer in 346 long-term adult survivors of childhood cancer. Osteoporos Int. 2015;26:521–9. doi: 10.1007/s00198-014-2878-z. [DOI] [PubMed] [Google Scholar]
- 5.Hogler W, Wehl G, van Staa T, Meister B, Klein-Franke A, Kropshofer G. Incidence of skeletal complications during treatment of childhood acute lymphoblastic leukemia: comparison of fracture risk with the General Practice Research Database. Pediatr Blood Cancer. 2007;48:21–7. doi: 10.1002/pbc.20701. [DOI] [PubMed] [Google Scholar]
- 6.Cummings EA, Ma J, Fernandez CV, Halton J, Alos N, Miettunen PM, Jaremko JL, Ho J, Shenouda N, Matzinger MA, Lentle B, Stephure D, Stein R, Sbrocchi AM, Rodd C, Lang B, Israels S, Grant RM, Couch R, Barr R, Hay J, Rauch F, Siminoski K, Ward LM, Canadian SC. Incident Vertebral Fractures in Children With Leukemia During the Four Years Following Diagnosis. J Clin Endocrinol Metab. 2015;100:3408–17. doi: 10.1210/JC.2015-2176. [DOI] [PMC free article] [PubMed] [Google Scholar]
- 7.Gurney JG, Kaste SC, Liu W, Srivastava DK, Chemaitilly W, Ness KK, Lanctot JQ, Ojha RP, Nottage KA, Wilson CL, Li Z, Robison LL, Hudson MM. Bone mineral density among long-term survivors of childhood acute lymphoblastic leukemia: results from the St. Jude Lifetime Cohort Study. Pediatr Blood Cancer. 2014;61:1270–6. doi: 10.1002/pbc.25010. [DOI] [PMC free article] [PubMed] [Google Scholar]
- 8.Marinovic D, Dorgeret S, Lescoeur B, Alberti C, Noel M, Czernichow P, Sebag G, Vilmer E, Leger J. Improvement in bone mineral density and body composition in survivors of childhood acute lymphoblastic leukemia: a 1-year prospective study. Pediatrics. 2005;116:e102–8. doi: 10.1542/peds.2004-1838. [DOI] [PubMed] [Google Scholar]
- 9.Frenkel B, White W, Tuckermann J. Glucocorticoid-Induced Osteoporosis. Adv Exp Med Biol. 2015;872:179–215. doi: 10.1007/978-1-4939-2895-8_8. [DOI] [PMC free article] [PubMed] [Google Scholar]
- 10.Strauss AJ, Su JT, Dalton VM, Gelber RD, Sallan SE, Silverman LB. Bony morbidity in children treated for acute lymphoblastic leukemia. J Clin Oncol. 2001;19:3066–72. doi: 10.1200/JCO.2001.19.12.3066. [DOI] [PubMed] [Google Scholar]
- 11.Atkinson SA, Halton JM, Bradley C, Wu B, Barr RD. Bone and Mineral Abnormalities in Childhood Acute Lymphoblastic Leukemia: Influence of Disease, Drugs, and Nutrition. Int J Cancer. 1998;(11):35–39. [PubMed] [Google Scholar]
- 12.Boot AM, van den Heuvel-Eibrink MM, Hahlen K, Krenning EP, de Muinck Keizer-Schrama SM. Bone mineral density in children with acute lymphoblastic leukaemia. Eur J Cancer. 1999;35:1693–7. doi: 10.1016/s0959-8049(99)00143-4. [DOI] [PubMed] [Google Scholar]
- 13.Alos N, Grant RM, Ramsay T, Halton J, Cummings EA, Miettunen PM, Abish S, Atkinson S, Barr R, Cabral DA, Cairney E, Couch R, Dix DB, Fernandez CV, Hay J, Israels S, Laverdiere C, Lentle B, Lewis V, Matzinger M, Rodd C, Shenouda N, Stein R, Stephure D, Taback S, Wilson B, Williams K, Rauch F, Siminoski K, Ward LM. High incidence of vertebral fractures in children with acute lymphoblastic leukemia 12 months after the initiation of therapy. J Clin Oncol. 2012;30:2760–7. doi: 10.1200/JCO.2011.40.4830. [DOI] [PMC free article] [PubMed] [Google Scholar]
- 14.te Winkel ML, Pieters R, Hop WCJ, Roos JC, Bokkerink JPM, Leeuw JA, Bruin MCA, Kollen WJW, Veerman AJP, de Groot-Kruseman HA, van der Sluis IM, van den Heuvel-Eibrink MM. Bone mineral density at diagnosis determines fracture rate in children with acute lymphoblastic leukemia treated according to the DCOG-ALL9 protocol. Bone. 2014;59:223–228. doi: 10.1016/j.bone.2013.11.017. [DOI] [PubMed] [Google Scholar]
- 15.Halton J, Gaboury I, Grant R, Alos N, Cummings EA, Matzinger M, Shenouda N, Lentle B, Abish S, Atkinson S, Cairney E, Dix D, Israels S, Stephure D, Wilson B, Hay J, Moher D, Rauch F, Siminoski K, Ward LM. Advanced Vertebral Fracture Among Newly Diagnosed Children With Acute Lymphoblastic Leukemia: Results of the Canadian Steroid-Associated Osteoporosis in the Pediatric Population (STOPP) Research Program. Journal of Bone and Mineral Research. 2009;24:1326–1334. doi: 10.1359/jbmr.090202. [DOI] [PMC free article] [PubMed] [Google Scholar]
- 16.Ness KK, Baker KS, Dengel DR, Youngren N, Sibley S, Mertens AC, Gurney JG. Body composition, muscle strength deficits and mobility limitations in adult survivors of childhood acute lymphoblastic leukemia. Pediatr Blood Cancer. 2007;49:975–81. doi: 10.1002/pbc.21091. [DOI] [PubMed] [Google Scholar]
- 17.te Winkel ML, Pieters R, Hop WC, Roos JC, Bokkerink JP, Leeuw JA, Bruin MC, Kollen WJ, Veerman AJ, de Groot-Kruseman HA, van der Sluis IM, van den Heuvel-Eibrink MM. Bone mineral density at diagnosis determines fracture rate in children with acute lymphoblastic leukemia treated according to the DCOG-ALL9 protocol. Bone. 2014;59:223–8. doi: 10.1016/j.bone.2013.11.017. [DOI] [PubMed] [Google Scholar]
- 18.Arikoski P, Komulainen J, Riikonen P, Voutilainen R, Knip M, Kroger H. Alterations in bone turnover and impaired development of bone mineral density in newly diagnosed children with cancer: a 1-year prospective study. J Clin Endocrinol Metab. 1999;84:3174–81. doi: 10.1210/jcem.84.9.5968. [DOI] [PubMed] [Google Scholar]
- 19.Mattano LA, Jr, Devidas M, Nachman JB, Sather HN, Hunger SP, Steinherz PG, Gaynon PS, Seibel NL, Children's Oncology G. Effect of alternate-week versus continuous dexamethasone scheduling on the risk of osteonecrosis in paediatric patients with acute lymphoblastic leukaemia: results from the CCG-1961 randomised cohort trial. Lancet Oncol. 2012;13:906–15. doi: 10.1016/S1470-2045(12)70274-7. [DOI] [PMC free article] [PubMed] [Google Scholar]
- 20.Rayar MS, Nayiager T, Webber CE, Barr RD, Athale UH. Predictors of bony morbidity in children with acute lymphoblastic leukemia. Pediatr Blood Cancer. 2012;59:77–82. doi: 10.1002/pbc.24040. [DOI] [PubMed] [Google Scholar]
- 21.Aasen G, Fagertun H, Halse J. Body composition analysis by dual X-ray absorptiometry: in vivo and in vitro comparison of three different fan-beam instruments. Scand J Clin Lab Invest. 2006;66:659–66. doi: 10.1080/00365510600898214. [DOI] [PubMed] [Google Scholar]
- 22.Kuczmarski R, Ogden C, Grummer-Strawn L, Flegal K, Guo S, Wei R, Mei Z, Curtin L, Roche A, Johnson C. Advance data from vital and health statistics. Hyattsville, MD: National Center for Health Statistics; 2000. CDC growth charts: United States. [PubMed] [Google Scholar]
- 23.Medicine Io. Dietary Reference Intakes for Calcium and Vitamin D. Washington, DC: The National Academies Press; 2011. [PubMed] [Google Scholar]
- 24.Hahn TJ, Boisseau VC, Avioli LV. Effect of chronic corticosteroid administration on diaphyseal and metaphyseal bone mass. J Clin Endocrinol Metab. 1974;39:274–82. doi: 10.1210/jcem-39-2-274. [DOI] [PubMed] [Google Scholar]
- 25.Wren TA, Liu X, Pitukcheewanont P, Gilsanz V. Bone densitometry in pediatric populations: discrepancies in the diagnosis of osteoporosis by DXA and CT. J Pediatr. 2005;146:776–9. doi: 10.1016/j.jpeds.2005.01.028. [DOI] [PubMed] [Google Scholar]
- 26.Wren TA, Liu X, Pitukcheewanont P, Gilsanz V. Bone acquisition in healthy children and adolescents: comparisons of dual-energy x-ray absorptiometry and computed tomography measures. J Clin Endocrinol Metab. 2005;90:1925–8. doi: 10.1210/jc.2004-1351. [DOI] [PubMed] [Google Scholar]
- 27.Riggs BL, Melton LJ, Robb RA, Camp JJ, Atkinson EJ, McDaniel L, Amin S, Rouleau PA, Khosla S. A population-based assessment of rates of bone loss at multiple skeletal sites: evidence for substantial trabecular bone loss in young adult women and men. J Bone Miner Res. 2008;23:205–14. doi: 10.1359/JBMR.071020. [DOI] [PMC free article] [PubMed] [Google Scholar]
- 28.Halton JM, Atkinson SA, Fraher L, Webber C, Gill GJ, Dawson S, Barr RD. Altered mineral metabolism and bone mass in children during treatment for acute lymphoblastic leukemia. J Bone Miner Res. 1996;11:1774–83. doi: 10.1002/jbmr.5650111122. [DOI] [PubMed] [Google Scholar]
- 29.Zemel BS, Kalkwarf HJ, Gilsanz V, Lappe JM, Oberfield S, Shepherd JA, Frederick MM, Huang X, Lu M, Mahboubi S, Hangartner T, Winer KK. Revised reference curves for bone mineral content and areal bone mineral density according to age and sex for black and non-black children: results of the bone mineral density in childhood study. J Clin Endocrinol Metab. 2011;96:3160–9. doi: 10.1210/jc.2011-1111. [DOI] [PMC free article] [PubMed] [Google Scholar]
- 30.Taes Y, Lapauw B, Griet V, De Bacquer D, Goemaere S, Zmierczak H, Kaufman JM. Prevalent fractures are related to cortical bone geometry in young healthy men at age of peak bone mass. J Bone Miner Res. 2010;25:1433–40. doi: 10.1002/jbmr.17. [DOI] [PubMed] [Google Scholar]
- 31.Kalkwarf HJ, Laor T, Bean JA. Fracture risk in children with a forearm injury is associated with volumetric bone density and cortical area (by peripheral QCT) and areal bone density (by DXA) Osteoporos Int. 2011;22:607–16. doi: 10.1007/s00198-010-1333-z. [DOI] [PMC free article] [PubMed] [Google Scholar]
- 32.Dennison EM, Jameson KA, Edwards MH, Denison HJ, Aihie Sayer A, Cooper C. Peripheral quantitative computed tomography measures are associated with adult fracture risk: the Hertfordshire Cohort Study. Bone. 2014;64:13–7. doi: 10.1016/j.bone.2014.03.040. [DOI] [PubMed] [Google Scholar]
- 33.Gohar SF, Comito M, Price J, Marchese V. Feasibility and parent satisfaction of a physical therapy intervention program for children with acute lymphoblastic leukemia in the first 6 months of medical treatment. Pediatr Blood Cancer. 2011;56:799–804. doi: 10.1002/pbc.22713. [DOI] [PubMed] [Google Scholar]
- 34.Kohler JA, Moon RJ, Sands R, Doherty LJ, Taylor PA, Cooper C, Dennison EM, Davies JH. Selective reduction in trabecular volumetric bone mineral density during treatment for childhood acute lymphoblastic leukemia. Bone. 2012;51:765–70. doi: 10.1016/j.bone.2012.06.025. [DOI] [PubMed] [Google Scholar]
- 35.Looker AC, Johnson CL, Lacher DA, Pfeiffer CM, Schleicher RL, Sempos CT. NCHS Data Brief. Vol. 59. U.S. Department of Health and Human Services; [Last Accessed 12-3-2015]. 2011. Vitamin D Status: United States, 2001-2006. Available online, http://www.cdc.gov/nchs/data/databriefs/db59.pdf. [PubMed] [Google Scholar]
- 36.Crofton PM, Ahmed SF, Wade JC, Stephen R, Elmlinger MW, Ranke MB, Kelnar CJ, Wallace WH. Effects of intensive chemotherapy on bone and collagen turnover and the growth hormone axis in children with acute lymphoblastic leukemia. J Clin Endocrinol Metab. 1998;83:3121–9. doi: 10.1210/jcem.83.9.5133. [DOI] [PubMed] [Google Scholar]
- 37.Looker AC, Borrud LG, Hughes JP, Fan B, Shepherd JA, Sherman M. Total body bone area, bone mineral content, and bone mineral density for individuals aged 8 years and over: United States 1999-2006. Vital Health Stat. 2013;11:1–78. [PubMed] [Google Scholar]
- 38.van Ballegooijen AJ, Robinson-Cohen C, Katz R, Criqui M, Budoff M, Li D, Siscovick D, Hoofnagle A, Shea SJ, Burke G, de Boer IH, Kestenbaum B. Vitamin D metabolites and bone mineral density: The multi-ethnic study of atherosclerosis. Bone. 2015;78:186–93. doi: 10.1016/j.bone.2015.05.008. [DOI] [PMC free article] [PubMed] [Google Scholar]
- 39.Díaz PR, Neira LC, Fischer SG, Teresa Torres MC, Milinarsky AT, Giadrosich VR, Arriagada MM, Arinoviche RS, Casanova DM. Effect of 1,25(OH)2-vitamin D on bone mass in children with acute lymphoblastic leukemia. J Pediatr Hematol Oncol. 2008;30:15–9. doi: 10.1097/MPH.0b013e318159a522. [DOI] [PubMed] [Google Scholar]
- 40.Hartman A, te Winkel ML, van Beek RD, de Muinck Keizer-Schrama SM, Kemper HC, Hop WC, van den Heuvel-Eibrink MM, Pieters R. A randomized trial investigating an exercise program to prevent reduction of bone mineral density and impairment of motor performance during treatment for childhood acute lymphoblastic leukemia. Pediatr Blood Cancer. 2009;53:64–71. doi: 10.1002/pbc.21942. [DOI] [PubMed] [Google Scholar]
- 41.Cosman F, de Beur SJ, LeBoff MS, Lewiecki EM, Tanner B, Randall S, Lindsay R National Osteoporosis F. Clinician's Guide to Prevention and Treatment of Osteoporosis. Osteoporos Int. 2014;25:2359–81. doi: 10.1007/s00198-014-2794-2. [DOI] [PMC free article] [PubMed] [Google Scholar]
- 42.Lethaby C, Wiernikowski J, Sala A, Naronha M, Webber C, Barr RD. Bisphosphonate therapy for reduced bone mineral density during treatment of acute lymphoblastic leukemia in childhood and adolescence: a report of preliminary experience. J Pediatr Hematol Oncol. 2007;29:613–6. doi: 10.1097/MPH.0b013e318142b7a1. [DOI] [PubMed] [Google Scholar]
Associated Data
This section collects any data citations, data availability statements, or supplementary materials included in this article.