

Abstract
Myocardial fuel and energy metabolic derangements contribute to the pathogenesis of heart failure. Recent evidence implicates posttranslational mechanisms in the energy metabolic disturbances that contribute to the pathogenesis of heart failure. We hypothesized that accumulation of metabolite intermediates of fuel oxidation pathways drives posttranslational modifications of mitochondrial proteins during the development of heart failure. Myocardial acetylproteomics demonstrated extensive mitochondrial protein lysine hyperacetylation in the early stages of heart failure in well-defined mouse models and the in end-stage failing human heart. To determine the functional impact of increased mitochondrial protein acetylation, we focused on succinate dehydrogenase A (SDHA), a critical component of both the tricarboxylic acid (TCA) cycle and respiratory complex II. An acetyl-mimetic mutation targeting an SDHA lysine residue shown to be hyperacetylated in the failing human heart reduced catalytic function and reduced complex II–driven respiration. These results identify alterations in mitochondrial acetyl-CoA homeostasis as a potential driver of the development of energy metabolic derangements that contribute to heart failure.
Heart failure patients have increased levels of acetylated cardiac mitochondrial proteins that may contribute to metabolic derangements.
Introduction
The adult mammalian heart requires enormous amounts of energy to sustain contractile function. Given that cardiomyocyte energy stores are limited, ATP must be continually generated by oxidation of carbon fuels, necessitating a high-capacity finely tuned mitochondrial system (1–5). Significant evidence suggests that insufficient capacity for mitochondrial fuel oxidation and ATP production is causally linked to the development of heart failure (HF). For example, human genetic defects in mitochondrial fatty acid oxidation (FAO), the chief fuel utilization pathway in heart, or derangements in oxidative phosphorylation (OXPHOS)/electron transport complex (ETC), cause cardiomyopathy (6). Studies conducted in animal models of HF have shown reduced capacity for mitochondrial FAO and increased reliance on glycolysis (7–16). Cardiac magnetic resonance spectroscopy studies in humans have shown that myocardial “high-energy” phosphocreatine (PCr) stores are reduced with pathological ventricular hypertrophy and decline further during the transition to HF (17–21). Notably, the [PCr]/[ATP] ratio correlates with HF severity and is a strong predictor of cardiovascular mortality (22, 23).
The mechanisms involved in curtailing the ability of the failing heart to satisfy its voracious appetite for ATP are a subject of intense investigation. To date, most studies have focused on late-stage HF. The results of such studies have identified widespread changes in energy metabolic gene expression associated with structural and functional mitochondrial abnormalities, cardiomyocyte death, and fibrosis, likely reflecting the final common pathway of late-stage disease (24–27). However, the primary events involved in energy metabolic remodeling en route to HF have not been well characterized. Recently, we employed an unbiased systems biology approach to identify molecular signatures of altered energy metabolism in the hypertrophied and early-stage failing mouse heart using integrated transcriptomics and metabolomics (28). This strategy unveiled the surprising finding that transcription of the majority of genes involved in mitochondrial energy transduction and OXPHOS is not altered in the hypertrophied and failing heart, with the notable exception of a progressive downregulation of genes involved in FAO. In striking contrast, tissue metabolite pools were broadly perturbed in the failing heart and distinguished the onset of contractile dysfunction and ventricular remodeling. These integrated profiling results strongly suggest that posttranslational mechanisms are an important contributor to the derangements in mitochondrial carbon flux during development of HF.
The results of our recent metabolomic profile of the failing mouse heart (28) revealed a potential mechanism whereby mitochondrial proteins may be altered at the posttranslational level. Notably, levels of acetylcarnitine (C2-carnitine), which are thought to reflect changes in the mitochondrial pool of acetyl-CoA, were increased in the failing heart but not in compensated cardiac hypertrophy (28). Consistent with this finding, acetyl-CoA levels were recently shown to be increased in the failing human heart (29). There is evidence that increased acetyl-CoA concentration can drive acetylation of nonhistone proteins (30, 31). In addition, emerging evidence indicates that increased lysine acetylation may result in enzymatic dysfunction (30, 32, 33). Accordingly, the observed expansion of the acetyl-CoA pool in the failing heart suggests that increased mitochondrial protein acetylation may contribute to derangements in mitochondrial energy metabolism in the failing heart. To address this possibility, we conducted unbiased, mass spectrometric–based, acetylproteomic studies on heart samples from well-defined mouse models of cardiac remodeling and in the failing human heart. The results demonstrate a striking increase in mitochondrial protein lysine acetylation in the failing heart. Our results also suggest that alterations in protein acetylation can affect mitochondrial fuel oxidation and respiration, contributing to the vicious cycle of “energy starvation” that contributes to the syndrome of HF.
Results
Increased lysine acetylation of mitochondrial proteins in the failing mouse heart.
The mitochondrial acetylproteome was profiled in cardiac samples from well-defined mouse models of compensated pathologic cardiac hypertrophy and HF using mass spectrometry. Established mouse models of pressure overload–induced cardiac hypertrophy and failure were used for these studies. In brief, transverse aortic constriction (TAC) was performed on C57BL/6J mice (34). TAC performed on 8- to 12-week-old C57BL/6J mice resulted in significant left ventricular (LV) hypertrophy, with preserved systolic function and no evidence of chamber volume remodeling or reduced ejection fraction at the 4-week time point, referred to here as compensated hypertrophy (CH). In a second age-matched experimental group, termed the HF group, TAC was combined with a small apical myocardial infarction (MI) achieved by placing a ligature in the distal portion of the left anterior descending coronary artery, which resulted in predictable global LV systolic and diastolic dilatation and significantly reduced LV ejection fraction (LVEF) 4 weeks after the procedure (28, 35). This approach allowed us to define molecular profiles in the early stages of CH and HF at a similar age and duration of pressure overload.
Cardiac ventricular mitochondria were purified from the samples taken from CH and HF groups and corresponding sham-operated controls. Acetylated peptides were enriched from the extracted mitochondrial proteins via anti-acetyl lysine antibodies. A total of 244 unique acetylated lysine sites situated in 82 mitochondrial proteins (from a total of 383 mitochondrial proteins identified) were identified (Supplemental Table 1; supplemental material available online with this article; doi:10.1172/jci.insight.84897DS1). 57% of the identified acetylated proteins exhibited two or more acetylated lysine residues. Considering fold changes greater than ± 1.5 as compared to control samples, 42 mitochondrial protein acetylation sites were differentially decorated in the HF samples (increased acetylation in 37 residues and decreased acetylation in 5 residues; Supplemental Table 2). Of the 37 residues with increased acetylation, 16 of these sites were identified previously as potential targets of sirtuin 3 (SIRT3) deacetylase activity in mouse heart (32) (Supplemental Table 2).
Pathway analysis (Ingenuity Pathway Analysis) demonstrated that acetylated mitochondrial proteins involved in mitochondrial energy transduction were highly represented (Supplemental Table 3). Notably, a significant number of hyperacetylated proteins in the HF samples were embedded in key fuel catabolic and ATP synthetic pathways, including FAO, tricarboxylic acid (TCA) cycle, and ETC (Figure 1A and Supplemental Table 3). In contrast to the acetylproteomic profile of the HF samples, the CH group exhibited fewer hyperacetylated proteins and greater directional heterogeneity (hyperacetylated and hypoacetylated proteins) in the FAO, TCA, and ETC pathways (Figure 1B and Supplemental Table 4). Taken together, these findings suggest that, during the progression from compensated cardiac hypertrophy to HF, net mitochondrial protein acetylation increases.
Figure 1. Increased lysine acetylation of mitochondrial proteins involved in multiple mitochondrial energy transduction pathways in cardiac tissue of mice from the heart failure group.

(A) Lysine-acetylated proteins (indicated by circles, protein symbols are noted) identified by mass spectrometry in both heart failure (HF) samples and sham-operated control samples (n = 2/group) in each of the 3 main mitochondrial fuel oxidation/ATP synthesis pathways (β-oxidation, tricarboxylic acid [TCA] cycle, and electron transport complex [ETC]). All acetylated residues with at least ± 1.5 fold change for mean HF/control values are shown. Specific lysine acetylation sites are noted in parentheses. Acetylation status is indicated by color coding: proteins with increased acetylation (HF/sham) are in red; proteins with decreased acetylation are in blue; and proteins with no change are in gray. (B) All detected acetylated mitochondrial proteins were rank ordered according to log2 fold change between compensated hypertrophy (CH) or HF and their corresponding sham controls in mean protein abundance along the x axis (blue circles). The log2 fold change between CH or HF and corresponding sham controls of each detected acetyl isoform (red squares, normalized to corresponding protein abundance) is plotted on the y axis in the same position on the x axis as the corresponding protein. The dashed line represents no change in acetylation level. Additional numerical data is provided in Supplemental Tables 2-4. SDHA, succinate dehydrogenase A.
Increased acetylation of mitochondrial proteins in the failing human heart.
To determine the relevance of the cardiac acetylproteomic findings in mice to human HF, we interrogated the cardiac acetylproteome of the failing human heart. For these studies, we conducted proteomics on samples prepared from LV of 5 cardiac transplant recipients with end-stage dilated cardiomyopathy (DCM group, LVEF = 10%) and 5 nonfailing (NF) organ donors with normal LV function (NF group, LVEF = 47%–80%). Significant acetylation changes were defined as a cutoff of ± 1.5 fold change or P < 0.05 based on a Student’s t test when comparing mean values of the DCM versus NF groups. Similar to the findings in the mouse HF samples, failing human heart samples exhibited a marked increase in mitochondrial protein acetylation (Supplemental Table 5). The general increase in mitochondrial protein acetylation in the DCM samples is shown in heat map (Figure 2A) and graphic (Figure 2B) formats. Whereas many of the hyperacetylated lysine residues are shared between mouse and human HF samples, a substantial number were species-specific (as seen in the comparison between Supplemental Tables 3 and 5). The reason for this latter observation is unclear but likely relates to differences in the relative acetylome coverage in each study and, in some cases, nonconserved residues between mice and humans. Importantly, similar to the mouse heart results, enzymes and proteins involved in multiple mitochondrial energy transduction pathways exhibited increased lysine acetylation, including FAO, TCA, ETC, and OXPHOS (Figure 3).
Figure 2. Increased acetylation of mitochondrial proteins in failing human heart.

(A) Heat map of the acetylproteomics data set representing the log2-transformed value of mitochondrial acetyl isoforms from cardiac biopsies of dilated cardiomyopathy (DCM) patients (n = 5) or nonfailing (NF) controls (n = 5). Acetylation events were normalized to corresponding protein abundance. The horizontal data lines represent the normalized value for each patient relative to the mean value across all 10 samples. The color coding indicates the direction and magnitude of the normalized log2-transformed value for each detected acetyl form, blue indicates low and red indicates high, in each patient sample. (B) All detected acetylated mitochondrial proteins were individually rank ordered according to the log2 fold change in mean protein abundance (DCM/NF) along the x axis (blue circles). The log2 fold change between DCM and NF controls of each detected acetyl isoform (red squares, normalized to corresponding protein abundance) is plotted on the y axis in the same position on the x axis as the corresponding protein. The dashed line represents no change in acetylation level.
Figure 3. Hyperacetylated mitochondrial proteins in failing human heart are involved in multiple energy transduction pathways.

Lysine-acetylated proteins (indicated by circles, protein symbols are noted) identified by mass spectrometry in dilated cardiomyopathy (DCM) patients and nonfailing (NF) control samples (n = 5/group) in each of the 3 main mitochondrial fuel oxidation/ATP synthesis pathways (β-oxidation, tricarboxylic acid [TCA] cycle, and electron transport complex [ETC]) are shown. All acetylated residues with at least ± 1.5 fold change for mean DCM/NF values are shown. Mean DCM acetylation levels that were significantly different compared to NF control values based on Student’s t test are also indicated (*P < 0.05). Specific lysine acetylation sites are noted in parentheses. Acetylation status is indicated by color coding: proteins with increased acetylation (DCM/NF) are in red; proteins with decreased acetylation are in blue; and proteins with no significant change are in gray. All acetylation levels were normalized to corresponding protein abundance. SDHA, succinate dehydrogenase A.
Altered NAD+ homeostasis in failing heart.
SIRT3, a mitochondrial-localized NAD+-dependent deacetylase, has been shown to play an important role in mitochondrial protein acetylation status (32, 36, 37). Therefore, we sought to assess NAD+ levels in the mouse and human HF samples to determine whether, in addition to increased acetyl-CoA levels, capacity for enzymatic deacetylation was altered in the failing heart. Quantitative mass spectrometric assays revealed that myocardial levels of NAD+ were reduced in the mouse HF group but not the CH group (HF, 1,990 ± 80.27 vs. control, 2,532 ± 174.56 pmol/mg tissue; P = 0.018; Figure 4A). Moreover, NAD+ was significantly reduced in the human DCM samples compared to NF controls (Figure 4B). Measurements of additional NAD+ metabolite species in the human heart samples demonstrated that NADH levels were not significantly altered in the DCM samples but that NAD phosphate (NADP+) levels were decreased and nicotinamide mononucleotide (NMN) increased in the DCM samples compared to NF controls (Figure 4B). Taken together, these results suggest regulation at several points, including NAD+ biosynthesis and salvage pathways (Figure 4C) in the failing heart.
Figure 4. Evidence for altered NAD+ homeostasis in failing mouse and human heart.

(A) NAD+ was measured in mouse cardiac tissue by quantitative mass spectrometry (n = 6/group). The values shown are normalized to mg of dry weight of tissue (mg dw). CH, compensated hypertrophy; HF, heart failure; TAC, transverse aortic constriction; MI, myocardial infarction. (B) Levels of NAD+, NADH, NAD phosphate (NADP+), and nicotinamide mononucleotide (NMN) in human failing (dilated cardiomyopathy [DCM]) and nonfailing (NF) control hearts (n = 5 per group). The values shown are normalized to mg of wet weight of tissue. (C) Schematic of NAD+ biosynthesis and salvage (within dashed line) pathways. NA, nicotinic acid; Naprt, nicotinate phosphoribosyltransferase; NaMN, NA mononucleotide; Nmnat, nicotinamide mononucleotide adenylyltransferase; Nadsyn, glutamine-dependent NAD+ synthetase; Nampt, nicotinamide phosphoribosyltransferase; Nmrk, nicotinamide riboside kinase 1;2; Nt5e, 5’-nucleotidase ecto; NR, nicotinamide riboside. *P < 0.05 based on Student’s t test. Bars represent mean ± SEM.
Evidence that lysine acetylation affects activity of succinate dehydrogenase A, a key component of the TCA cycle and ETC complex II.
As an initial step to explore the functional impact of the altered mitochondrial protein acetylation pattern observed in the HF samples, we focused on subunit A of succinate dehydrogenase A (SDHA), an enzyme that serves a critical role in both the TCA cycle and ETC (as part of complex II). SDHA exhibited increased acetylation at several residues in the mouse and human HF samples (Figures 1A and Figure 3), and its protein levels were not different between failing heart and controls in the mouse and human samples (data not shown). We first measured the activity of complex II in saponin-skinned myocardial LV fibers prepared from HF mice and controls. Complex II–driven state 3 respiration (succinate plus rotenone) was significantly lower in the HF samples compared to sham-operated controls (Figure 5A). In contrast, complex I–driven respiration rates were shown to be normal in the mouse HF samples (28). These results are consistent with reduced SDHA activity in the failing heart. In further support of this conclusion, we have shown that succinate levels are increased in mouse HF samples, consistent with reduced SDHA activity in the TCA cycle (28).
Figure 5. Evidence for acetylation effects on succinate dehydrogenase A function relevant to heart failure.

(A) Mitochondrial complex II respiration rates determined on cardiac muscle strips isolated from heart failure (HF) and sham-operated control mice using succinate (5 mM) as a substrate in the presence of rotenone (10 μM) to inhibit complex I flux. Basal, state 3 (ADP-stimulated), and post-oligomycin VO2 rates are shown normalized to mg dry tissue weight (mg dw). RC, respiratory control ratio (state 3/state 4). Bars represent mean respiration rates ± SEM (n = 5–11). *P < 0.05 compared to sham based on Student’s t test. (B) Succinate dehydrogenase A (SDHA) activity was measured in mitochondria isolated from HEK293 cells expressing WT SDHA (WT) or the acetyl-mimetic mutant (K179Q). Km was derived from measurements of initial velocity generated from a range of substrate concentrations using nonlinear regression. Bars represent mean values ± SEM (3 separate experiments each with n = 3/condition). *P < 0.05 compared to WT based on Student’s t test. (C) Oxygen consumption rates (OCRs) were measured in permeabilized NIH-3T3 cells transfected with either a vector encoding WT SDHA (pCS6-SDHA) or K179Q (pCS6-K179Q). The OCR was normalized to the total amount of SDHA in each sample, as quantified by Western blot. The graph shown is representative of 3 separate experiments, each with n = 10. Data points represent mean values ± SEM. *P < 0.05 compared to SDHA-K179Q based on Student’s t test. (D) Area under the curve (AUC) was calculated from the combination of all 3 individual experiments for basal and succinate-driven respiration (n = 30). Bars represent mean values ± SEM. *P < 0.05 compared to WT based on Student’s t test.
We next sought to assess the effects of SDHA lysine acetylation on SDHA catalytic function. For these studies, we determined the impact of a site-directed lysine acetylation-mimetic (K to Q) mutation on SDHA activity. The mutagenesis studies focused on the K179 residue of SDHA, given that it is hyperacetylated in human HF (Figure 3). In addition, K179 is an established SIRT3 substrate and is located in a conserved FAD+-binding region (32, 36). Enzyme activity studies were conducted on mitochondria isolated from HEK293 cells in which WT SDHA or the acetyl-mimetic mutant (K179Q) was overexpressed. The K179Q mutant exhibited a significantly increased Km (Figure 5B). These results suggest that K179 acetylation affects substrate or cofactor (FAD+) binding to SDHA. To further assess the impact of the K179 hyperacetylation on SDHA activity in the cellular context as it relates to complex II function, effects on mitochondrial respiration were measured. Complex II–driven respiration in cells overexpressing K179Q was significantly lower compared to SDHA overexpression controls (Figure 5, C and D). This effect was also observed under both basal and ADP-stimulated conditions. Collectively, these results provide evidence that increased acetylation of SDHA at specific lysine residues, as observed in the failing heart, reduces its function in the TCA cycle and as a component of complex II. It is likely that hyperacetylation of other mitochondrial proteins also confers a functional impact in the failing heart.
Discussion
We used unbiased quantitative proteomics to detect posttranslational changes in mitochondrial proteins during the transition from compensated cardiac hypertrophy to HF in mice. This approach was spawned by the results of our recent study demonstrating that reduced mitochondrial fuel catabolic flux in the failing heart cannot be fully explained by alterations at the level of gene transcription (28). In addition, we and others have recently found that a subset of myocardial short-chain carbon pools, including acetyl-CoA levels, are increased in the failing mouse heart (28), setting the stage for posttranslational modifications of myocyte proteins during the development of HF. The results herein demonstrate striking alterations in the cardiac mitochondrial protein acetylome during the development of HF in well-defined mouse models and in end-stage HF in humans.
The basis for increased mitochondrial protein acetylation in the failing heart is unclear, but several lines of evidence suggest that it is driven, at least in part, by changes in the mitochondrial matrix environment. Emerging data suggest that the degree of lysine acetylation of proteins is controlled by both enzymatic and nonenzymatic mechanisms. Mitochondrial proteins may be particularly susceptible to nonenzymatic lysine acetylation due to the alkaline pH and relatively high concentrations of acetyl-CoA within the matrix (38). We recently found that levels of C2-carnitine, which reflect changes in the mitochondrial pool of acetyl-CoA, were increased in mouse HF but not CH samples (28). In addition, very recent work has shown that acetyl-CoA levels are increased in the myocardium of humans with end-stage HF (29). The basis for the increased levels of acetyl-CoA in the early-stage failing heart is unknown, but several possible mechanisms could be at play. First, an increase in mitochondrial short-chain carbon pools could reflect shifts in myocardial fuel oxidative flux, leading to metabolite “bottlenecks.” We recently found that the hypertrophied and failing mouse heart shifts to ketone bodies as a fuel source in the context of reduced capacity for utilization of fatty acids (39). Chronic utilization of ketones by the cardiomyocyte increases levels of several intermediates, including C2-carnitine. It is possible that the concentration of acetyl-CoA generated by ketone oxidation exceeds capacity for entry into the TCA cycle, increasing the mitochondrion acetyl-CoA pool size. Second, impaired export of mitochondrial acetyl-CoA may contribute to an expansion of the mitochondrial acetyl-CoA pool. In support of this notion, we found that carnitine acetyltransferase (CRAT) is hyperacetylated in the CH and HF samples (Supplemental Tables 2 and 4). CRAT exports acetyl units from the mitochondrion by converting acetyl-CoA to the membrane-permeant carnitine conjugate, C2-carnitine. Progressive reduction in CRAT activity in the context of increased mitochondrial acetyl-CoA levels could set the stage for increased mitochondrial protein acetylation. Third, altered NAD+ homeostasis could contribute to the increased mitochondrial protein acetylation observed in the failing heart by diminishing the activity of SIRT3 (40), a key mitochondrial deacetylase. Notably, SIRT3-null mice exhibit increased mitochondrial protein acetylation and are more susceptible to stress-induced mitochondrial dysfunction (32, 36, 37). Cardiac SIRT3 expression was not reduced in the CH or HF groups (data not shown). However, we found that NAD+ levels were significantly reduced in the mouse and human HF samples, likely resulting in reduced sirtuin activity (Figure 4, A and B). Interestingly, our comprehensive profiling of metabolites involved in NAD+ metabolism (Figure 4B) indicated that the basis for reduced NAD+ levels could involve multiple mechanisms, including alterations in both the biosynthesis and salvage pathways (Figure 4C), given that NMN levels are increased in the context of reduced NAD+. Taken together, we propose that both increased mitochondrial acetyl-CoA levels and reduced SIRT3 activity due to derangements in NAD+ metabolism conspire to drive increased lysine acetylation of mitochondrial proteins in the failing heart.
The results described herein provide evidence that increased acetylation of selected mitochondrial proteins impairs mitochondrial fuel oxidation and ATP synthesis in the failing heart. Increased lysine acetylation has been shown to reduce the enzymatic activity of mitochondrial proteins involved in FAO, glucose oxidation, the TCA cycle, and ETC (41–45). In this study, we identified hyperacetylated lysine residues of proteins within the FAO, TCA, and ETC/OXPHOS pathways in the HF samples. The functional studies described here focused on SDHA, a key component of both the TCA cycle and respiratory complex II. SDHA was found to be hyperacetylated at multiple lysine residues in both mouse and human samples. Complex II–driven respiration was reduced in cardiac strips prepared from the HF samples, consistent with reduced activity of SDHA. In addition, levels of succinate, the substrate for the TCA cycle reaction catalyzed by SDHA, are increased in the mouse HF samples (28). We found that an acetyl-mimetic point mutation in SDHA altered enzymatic function and succinate-driven respiration via complex II. Notably, human complex II deficiency has been reported to cause HF (46). As K179 lies within the conserved FAD+-binding domain, we speculate that acetylation of this residue directly affects FAD+ binding to SDHA. The observed increased Km in the SDHA K179Q mutant is consistent with this notion. Interestingly, mitochondrial complex I deficiency in mice results in a phenotype of protein hyperacetylation and HF, suggesting that reduced ETC flux and ATP synthesis could further contribute to mitochondrial protein acetylation, resulting in a vicious cycle (47). It should be noted that current methodology does not allow us to determine the precise acetylation stoichiometry of SDHA and other mitochondrial proteins in the HF samples. Future studies aimed at defining precise lysine acetylation stoichiometry, together with pathway flux analyses, will provide key information on whether the results shown here for alterations in SDHA represent a broader paradigm in HF and other diseases.
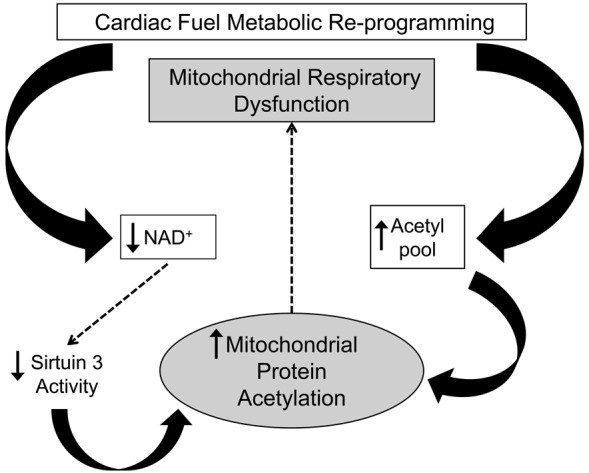
Our collective results suggest a model in which progressive mitochondrial protein lysine acetylation, driven by an expansion of the acetyl-CoA pool and reduced NAD+ levels, leads to reduced fuel oxidative flux and diminished ATP synthesis (Figure 6). Our results raise the question as to whether strategies aimed at diminishing mitochondrial protein hyperacetylation by targeting nodal points in this pathogenic scheme could have therapeutic utility for HF. A few studies have shown that activation of SIRT1 improves cardiac function in HF and ischemia-reperfusion models, possibly via activation of AMP-activated protein kinase (48–50). However, the impact of specifically activating mitochondrial SIRT3 on the development of HF has not been reported to our knowledge. In addition, as described above, it is likely that a significant subset of the hyperacetylated proteins identified herein are not SIRT3 targets. Accordingly, proof-of-concept experimental strategies aimed at maintaining mitochondrial acetyl carbon homeostasis or NAD+ metabolism should also be considered.
Figure 6. Schematic depicting a conceptual model for the impact of mitochondrial protein lysine acetylation as a driver of the progressive decline in capacity for mitochondrial oxidative flux and ATP synthesis known to occur during the development of heart failure.
Methods
Animal studies
Animal studies were performed on female C57BL/6J mice (purchased from JAX labs), 7 to 12 weeks of age, on standard chow (16.4% protein, 4.0% fat, and 48.5% carbohydrates; Harlan Teklad, 2016). The TAC and HF (combination of TAC and small apical MI) surgeries were performed on 8-week-old female C57BL/6J mice (purchased from JAX labs) as described previously (28, 34, 35).
Human studies
Explant dilated nonischemic failing human hearts were procured at the time of orthotopic heart transplantation, and NF hearts were obtained at the time of organ donation from brain-dead donors. In all cases, warm ischemia was prevented by arresting the heart in situ with 1 liter of ice-cold cardioplegia solution, transportation to the laboratory on wet ice, and flash freezing of biopsies in liquid nitrogen within 4 hours of cardiectomy. All samples were full-thickness biopsies obtained from the free wall of the left ventricle. A total of 10 subjects, 5 organ donors, and 5 patients with DCM provided heart tissue for this research. In each group, there were 2 females and 3 males, the ages were comparable (NF 50 ± 3 years vs. DCM 58 ± 5 years), and all but one DCM subject were of mixed European descent. Body mass index was also comparable (NF 31 ± 4 vs. DCM 26 ± 3). Based on heart weight at explant (NF 394 ± 31 grams vs. DCM 531 ± 50 grams, P < 0.05) and LVEF determined by echocardiography (NF 62% ± 8% vs. DCM 10% ± 0%, P < 0.005), the DCM hearts had significant pathological hypertrophy and severe contractile dysfunction.
Western blotting
Western immunoblotting was performed with total cellular lysate. In brief, cells were harvested with RIPA buffer (1% NP40, 0.1% SDS, 100 mM phenylmethylsulfonyl fluoride, cOmplete Protease Inhibitors [Roche catalog 11697498001]) on ice. DNA was sheered by passing the sample through a 21-gauge needle. The lysate was incubated on ice for 30 minutes and subsequently centrifuged at 4°C at 20,000 g for 20 minutes. The supernatant was collected, and total protein was quantified using the Micro BCA Protein Assay Kit (Thermo Fisher Scientific catalog 23235). Protein samples were run on 12% SDS-PAGE and transferred to nitrocellulose membrane. The membranes were blocked with Odyssey Blocking Buffer (LI-COR Biosciences catalog 927-50000) for 1 hour at room temperature and then probed with primary antibody complex II Fp subunit (Invitrogen catalog 459200) at 1:5,000 in 1:1 Odyssey Blocking Buffer and 0.1% Tween in Tris-buffered saline (TBS-T) overnight at 4°C. The membranes were rinsed for 10 minutes 3 times with TBS-T at room temperature. Secondary antibody IRDye 800CW donkey anti-mouse IgG (H + L) (LI-COR Biosciences catalog 926-32212) was applied to the blot at 1:7,500 dilution in 1:1 Odyssey Blocking Buffer and TBS-T and incubated for 1 hour at room temperature. Western blot image detection and quantification were performed using the LI-COR Odyssey. Protein quantification was performed using the Odyssey Image Studio software (LI-COR Biosciences).
Metabolomic analysis of NAD+ metabolites
For the NAD+ metabolite measurements, pulverized frozen mouse heart samples (~50 mg per sample) or pulverized frozen human heart (derived from left ventricle; ~50 mg per sample) were homogenized via hand-held rotary homogenizer in 500 μl of either 0.5 M perchloric acid (for NMN, NAD+, and NADP+ determination) or 50:50 methanol/0.1 M NaOH (for NADH determination). The resulting heart homogenates were aliquoted and stored at –80°C. For NMN, NAD+, and NADP+ extraction, a 100-μl aliquot of heart homogenate was spiked with a 10-μl aliquot of heavy isotope-labeled internal standards (18O2-labeled NMN and NAD+; synthesized by the Sanford Burnham Prebys [SBP] Medicinal Chemistry Core). This was followed by the addition of 100 μl of 1 M ammonium formate to adjust the homogenate pH to approximately 4. Samples were vortexed thoroughly and centrifuged at 18,000 g for 5 minutes at 10°C. The clarified homogenates were passed through an AcroPrep Advance 3K Omega Filter Plate (Pall Corporation) prior to liquid chromatography–tandem mass spectrometry (LC/MS/MS) analysis.
For NADH extraction, a 100-μl aliquot of heart homogenate was spiked with a 10-μl aliquot of heavy isotope-labeled internal standard (18O2-labeled NADH; synthesized by the SBP Medicinal Chemistry Core). Samples were vortexed thoroughly and centrifuged at 18,000 g for 5 minutes at 10°C. The clarified homogenates were passed through an AcroPrep Advance 3K Omega Filter Plate (Pall Corporation) prior to LC/MS/MS analysis. All pyridine nucleotides were separated on a 2.1 × 50 mm, 3-μm Thermo Hypercarb column (T = 30°C) using a 5.8-min linear gradient with 10 mM ammonium acetate, pH 9.5, and acetonitrile at a flow rate of 0.5 ml/min. Quantitation of pyridine nucleotides was achieved using multiple reaction monitoring on an Dionex UltiMate 3000 HPLC/Thermo Scientific Quantiva triple quadrupole mass spectrometer (Thermo Scientific). For NMN, NAD+, and NADP+ determination, a standard calibration curve (0.25–200 μM for NAD+, 0.025–20 μM for NADP+, and 0.0025–2 μM for NMN) was prepared by spiking 10-μl aliquots of pyridine nucleotides (Sigma-Aldrich) and internal standards (synthesized by the SBP Medicinal Chemistry Core) into 100-μl aliquots of 0.5 M perchloric acid. Calibration samples were extracted similarly as pyridine nucleotides in heart homogenate. For NADH determination, a standard calibration curve (0.25–200 μM for both species) was prepared by spiking 10-μl aliquots of pyridine nucleotides (Sigma-Aldrich) and internal standards (synthesized by the SBP Medicinal Chemistry Core) into 200 μl of 50:50 methanol/0.1 M NaOH. Calibration samples were extracted similarly as pyridine nucleotides in mouse liver homogenate. Data from heart samples were normalized to the mass of lyophilized heart powder (mouse) or heart tissue homogenate (human) provided.
Acetylproteomics
Purified mitochondria (mouse samples) or pulverized tissue (human samples) were subjected to quantitative proteomics/acetylproteomics using recently developed methods (36, 51). The mass spectrometry mouse acetylproteomics data have been deposited into the Proteome Xchange Consortium (http://www.ebi.ac.uk/pride/archive/login) via the PRIDE partner repository with the data set identifier PXD001652. The human acetylproteomics data are available at Chorus (https://chorusproject.org/pages/index.html) under the project title heartFailure_acetylation (ID 965).
Chemicals and supplies.
The Tandem Mass Tag (TMT) reagents were purchased from Thermo Scientific. The BCA assay Protein Assay Kit was purchased from Pierce Biotechnology. and Trypsin Gold was purchased from Promega. Sep-Pak tC18 cartridges were purchased from Waters Corporation. A polysulfoethyl A column (9.4 mm × 200 mm, 5 mm, 200Å) was purchased from PolyLC Inc. Bridged Ethylene Hybrid (BEH) C18 resin (1.7-m diameter particles, 130 Å pore size) was purchased from Waters Corporation. Fused-silica capillary tubing was purchased from Polymicro Technologies. Formic acid and trifluoroacetic acid ampoules were purchased from Thermo Scientific. Pan-acetyl lysine antibody agarose conjugate was purchased from ImmuneChem. Protease (cOmplete mini ETDA-free) and phosphatase (PhosSTOP) inhibitors were purchased from Roche. All other chemicals were purchased from Sigma-Aldrich.
Mitochondrial preparation.
For the mouse studies, mitochondria were isolated by differential centrifugation by methods previously reported (52). All steps were performed at 4°C. Tissue was suspended in isolation buffer (220 mM mannitol, 70 mM sucrose, 5 mM HEPES KOH, pH 7.4, 1 mM EGTA) supplemented with 10 mg/ml bovine serum albumin (BSA), protease inhibitor cocktail (Roche cOmplete tablets, 1 tablet per 50 ml buffer), phosphatase inhibitor cocktail (Roche PhosSTOP), and deacetylase inhibitors (10 mM nicotinamide, 10 μM TSA, 5 μM MS257, 10 mM sodium butyrate, 2 μM SAHA). Heart tissue was suspended to 0.1 g/ml in isolation buffer and homogenized with 4 strokes of a power-driven Potter-Elvehjem glass/Teflon homogenizer. The homogenate was decanted and spun at 800 g for 10 minutes. Any lipids were removed from the top of the supernatant by aspiration. The supernatant containing mitochondria was removed and transferred to a Beckman Ultra-clear centrifuge tube and spun at 8,000 g for 10 minutes. The supernatant was discarded, and the pellet was resuspended in 1 ml of isolation buffer. The crude mitochondria were transferred to a 1.5-ml microfuge tube and spun at 8,000 g for 10 minutes in a bench-top centrifuge. The supernatant was removed, and the pellet was washed with resuspension buffer. (Note, resuspension buffer is equivalent to isolation buffer but lacks BSA). The mitochondria were pelleted by centrifugation at 8,000 g for 10 minutes in a bench-top centrifuge. The supernatant was aspirated, and the pellet was frozen immediately in liquid nitrogen.
Sample preparation.
Either purified mitochondria (mouse samples) or pulverized frozen human heart samples were suspended in 8 M urea, 40 mM Tris, pH 8.0, 30 mM NaCl, 1 mM CaCl2, 1× protease inhibitor tablet, 1× phosphatase inhibitor tablet, and 1× deacetylase inhibitors. Protein was extracted by sonication with a probe sonicator on ice and quantified by BCA assay. Protein from each sample (180 μg for mouse samples, 1 mg for human samples) was reduced with 5 mM dithiothreitol for 45 minutes at 58°C and then alkylated with 15 mM iodoacetamide for 45 minutes at ambient temperature in the dark. The alkylation was quenched with 5 mM dithiothreitol. Following dilution to 1.5 M urea with 50 mM Tris, pH 8.0, the samples were digested with trypsin (50:1 protein/enzyme) overnight. Additional trypsin (50:1 protein/enzyme) was spiked into the sample the following morning, digestions were quenched by TFA acidification 2 hours later, and samples were desalted with a tC18 sep-Pak. Desalted material was resuspended in 200 mM TEAB pH 8.5 and labeled with 8-plex TMT. Labeled peptides were combined and desalted. Labeling efficiency was evaluated by analyzing a test mixture by LC/MS/MS for each experiment. Labeling efficiency was >95%, calculated by the number of N-terminal–labeled peptides divided by the total number of peptide identifications.
Fractionation and enrichment.
Labeled peptides were fractionated by strong cation exchange on a polysulfoethyl A column (0.4 mm × 200 mm) with mobile phases A (5 mM KH2PO4, pH 2.7, and 30% acetonitrile); B (5 mM KH2PO4, pH 2.7, 350 mM KCl, and 30% acetonitrile); C (5 mM KH2PO4, pH 6.5, 500 mM KCL, and 20% acetonitrile); and D (water). Peptides were eluted over the following gradient on a Surveyor LC quaternary pump (Thermo Scientific) at 3 ml/min: 0–2 minutes, 100% A; 2–5 minutes, 0%–10% B; 5–35 minutes, 10%–60% B; 35–41 minutes, 60%–100% B; this gradient was followed by washes with C and D prior to reequilibration with mobile phase A. Sixteen fractions were collected and desalted. A small portion, 5%, of each was retained for protein analysis, while the remaining material was pooled into 6 fractions for acetyl lysine enrichment.
These pooled fractions were dissolved in 50 mM HEPES, pH 7.6, 100 mM NaCl, and each fraction was combined with approximately 50 μl pan-acetyl lysine antibody agarose conjugate. The samples were rotated overnight at 4°C and then rinsed 8 times with cold 50 mM HEPES, pH 7.6, and 100 mM NaCl. Rinses were followed by elution with 0.1% TFA, and eluted peptides were desalted prior to analysis.
LC/MS/MS.
Mouse samples were analyzed by reverse-phase liquid chromatography on a nanoAcquity (Waters Corporation) coupled to an Orbitrap Elite (Thermo Scientific). Samples were loaded onto a 75-μm-inner diameter analytical column made in-house, packed with 1.7-m-diameter, 130-Å-pore-size, BEH C18 particles (Waters Corporation) to a final length of 30 cm. The column was heated to 62°C for all runs. The elution portion of the gradient was 5% to 30% B (A: water/0.2% formic acid; B: acetonitrile/0.2% formic acid) over 80 minutes for both acetyl enriched fraction and protein fractions.
Instrument methods for mass spectrometry all started with one mass spectrometry survey scan (resolution = 60,000; 300 Th to 1,500 Th) followed by data-dependent mass spectrometry fragmentation and analysis (resolution = 30,000) of the 15 most intense precursors by beam-type CAD (HCD; normalized collision energy = 35%, target value = 5e4). Only those precursors with charge state of +2 or higher were sampled for mass spectrometry. The dynamic exclusion duration was set to 40 seconds, with a 10-ppm tolerance around the selected precursor and its isotopes, and monoisotopic precursor selection was turned on.
Human samples were analyzed by reverse-phase liquid chromatography on a nanoAcquity (Waters Corporation) coupled to an Orbitrap Fusion (Thermo Scientific). Samples were loaded onto a 75-μm-inner diameter analytical column made in-house, packed with 1.7-m-diameter, 130-Å-pore-size, BEH C18 particles (Waters Corporation) to a final length of 35 cm. The column was heated to 65°C for all runs. Mobile-phase buffer A was composed of water, 0.2% formic acid, and 5% dimethyl sulfoxide (DMSO). Mobile-phase B was composed of acetonitrile, 0.2% formic acid, and 5% DMSO. Samples were loaded onto the column for 12 minutes at 0.35 μl/min. Mobile-phase B increases to 4% in the first 0.1 minutes and then to 30% B over 80 minutes, followed by a 5-minute wash at 70% B and a reequilibration at 0% B.
Instrumental methods for mass spectrometry all started with one mass spectrometry survey scan (resolution = 60,000 at 200 m/z; target value = 5e5; 350 Th to 1,400 Th) followed by data-dependent mass spectrometry fragmentation and analysis in the Orbitrap (resolution = 60,000 at 200 m/z) of the most intense precursors by beam-type CAD (HCD; normalized collision energy = 37%, target value = 5e4) over a 5-second cycle. Only those precursors with charge state of +2 or higher were sampled for mass spectrometry. The dynamic exclusion duration was set to 30 seconds, with a 10 ppm tolerance around the selected precursor and its isotopes, and monoisotopic precursor selection was turned on.
Database search, FDR filtering, and acetylation analysis.
Spectra were converted to searchable text files using a DTA generator. Generated text files were searched for fully tryptic peptides with up to 3 missed cleavages against a UniProt target-decoy database populated with mouse canonical plus isoforms (downloaded August 7, 2013) or human canonical plus isoforms (downloaded July 20, 2012) using the Open Mass Spectrometry Search Algorithm v.2.1.8 (53). Mass tolerance was set to ± 2.5 Da for precursors and ± 0.015 Da for fragment ions. Carbamidomethylation of cysteine, isobaric labeling of lysine, and isobaric labeling of the peptide N-terminus were searched as fixed modifications for all samples. Enriched fractions were additionally searched for variable acetylation modifications, in which the acetylation mass shift was set to the difference between an acetyl group and an isobaric label (-187.1523 Da) to allow the isobaric label on lysine to remain a fixed modification even for acetylated peptides. Search results were filtered to 1% FDR at the unique peptide level using the COMPASS software suite (54). TMT quantitation of identified peptides was performed within COMPASS, as previously reported (55). Peptides were grouped into proteins according to previously reported rules, and protein identifications were further filtered to 1% FDR (56). Protein quantitation was performed by summing all reporter ion intensities within each channel for each protein.
Acetylation events were localized to specific residues using previously described probabilistic methods (57). An acetylation event was considered localized if the calculated localization confidence was 95% or greater based on comparisons to theoretically possible acetyl isoforms. If localized acetylated peptides shared identical modification sites, those peptides were grouped together and their reporter ion intensities were summed; peptides with C-terminal acetylation were excluded from quantitation.
Protein normalization.
All reporter ion intensities were log2 transformed and mean normalized for every acetyl isoform and protein. To account for protein abundance differences, the acetyl isoforms were normalized by subtracting the quantitative value of the reporter ion channel for the corresponding protein from the value for each acetyl isoform reporter ion channel. This resulted in a protein-normalized acetylation mean value that was then used to investigate fold changes between conditions. Fold change calculations were made by averaging the protein-normalized values for each condition and then calculating the difference of averages.
Mitochondrial assignment.
Proteins were identified as mitochondrial or nonmitochondrial based on inclusion or exclusion from the MitoCarta compendium of mitochondrial mouse proteins (58). MitoCarta EntrezID identifiers were converted to Uniprot identifiers with the Uniprot ID mapping function. Our list was limited to contain only proteins that were in the canonical database used for searching. Additional mitochondrial proteins identified by Database for Annotation, Visualization and Integrated Discovery were also included.
Mitochondrial respiration
Mitochondrial respiration rates were determined on saponin-permeabilized LV muscle strips with succinate (5 mM)/rotenone (10 μM) as substrate as described previously (28, 59).
Vector construction
An MGC premier Expression-Ready cDNA clone for SDHA-BC031849 (pCS6-BC031849) (Transomic Technologies catalog TCM1304) was used for the WT SDHA vector construct (pCS6-SDHA). Site-directed mutagenesis was performed using a modification to the QuikChange (Stratagene catalog 200518-5) protocol to create the SDHA K179Q in the pCS6-SDHA vector as described previously (60). The following primers were used for the site-directed mutagenesis: CCTCCAGTTTGGGAAAGGCGGGCAGG (forward) and CCCAAACTGGAGGCTCTGTCCACCAAATGCAC (reverse).
Cellular oxygen consumption rates
Oxygen consumption rates were measured using the Seahorse Bioscience XF 96 analyzer as described previously (61). Briefly, NIH3T3 (ATCC) cells were transfected with Lipofectamine 3000 (Thermo Scientific catalog L3000-015) using the manufacturer’s instructions with expression constructs for WT or K179Q SDHA (pCS6-SDHA or pCS6-K179Q). In the Seahorse assay, two measurements were taken at basal conditions and after each reagent injection. The cells were first injected with 10 mM succinate, 1.5 nM rPFO (Seahorse Bioscience catalog 102504-100), and 4 μM rotenone. ADP was added at a final concentration of 4 mM. The final concentration of antimycin A was 1 μM. The oxygen consumption rate was then normalized to total amount of SDHA present, as determined by Western blot of cells transfected with indicated expression construct.
SDHA activity
HEK293 cells were transfected with pCS6-SDHA or pCS6-K179Q constructs. Mitochondria were isolated and SDHA-specific activity was measured as described previously (62–64). In brief, a coupled enzymatic colorimetric assay utilizing 2 redox dyes, 2,6-dichlorophenolindophenol sodium salt hydrate (DCPIP) and phenazine methosulfate (PMS), was used to measure the oxidation of succinate to fumarate by SDHA. Succinate (21.7 mM) was added to the isolated mitochondria and preincubated to remove oxaloacetate, which is an inhibitor of SDHA succinate oxidation. The reaction solution (2.17 μM antimycin A, 5.4 μM rotenone, 54 μM DCPIP, PMS between 0 mM and 1.07 mM) was then added, and absorbance was measured at 600 nm. The Km was derived by fitting a curve made from measurements of initial velocity at various substrate concentrations using nonlinear regression analysis in GraphPad Prism 6 after measuring the total amount of SDHA present via Western blot. The replicates test confirmed the adequacy of the fit to the Michaelis-Menten model.
Statistics
All statistical analyses were performed with 2-tailed Student’s t test as indicated. The level of significance was set at P < 0.05 in all cases.
Study approval
All animal experiments and euthanasia protocols were approved by the Institutional Animal Care and Use Committee at SBP at Lake Nona. Procurement of human myocardial tissue was performed under protocols approved by Institutional Review Boards at the University of Pennsylvania, and consent for research use of explanted tissues was prospectively obtained in all cases.
Author contributions
JLH, OJM, RBV, DJP, JJC, DMM, and DPK conceived the study. JLH, LL, NMR, ALR, and JJC devised experimental methodology. JLH, OJM, LL, NMR, and ALR performed experiments. TCL, RBV, NMR, and ALR curated data. KCB and KBM provided resources. JLH, OJM, LL, NMR, and ALR provided formal analysis. JLH, OJM, RBV, and DPK wrote the original draft. JLH, LL, NMR, ALR, JJC, DMM, TCL, RBV, and DPK reviewed and edited the manuscript. DPK, DJP, JJC, DMM, and KBM acquired funding. JJC and DPK provided supervision.
Supplementary Material
Acknowledgments
We wish to thank Gregory Aubert for expert scientific discussion at the onset of this project and Lorenzo Thomas for assistance with the preparation of the manuscript. We would like to acknowledge the following Core Facilities at SBP at Lake Nona: Cardiometabolic Phenotyping, Metabolomics, and Medicinal Chemistry. We wish to thank Jeff Culver, Christopher Petucci, and Stephen Gardell for development and assistance with the nicotinamide metabolite measurements. We also thank Lauren Ashley Gabriel and Caron Stonebrook for assistance with the animal studies. This work was supported by NIH grants R01 HL58493 (to D.P. Kelly), R01 HL101189 (to D.P. Kelly and D.M. Muoio), R01 DK098672 (to D.J. Pagliarini), R01 GM080148 (to J.J. Coon), and R01 HL105993 (to K.B. Margulies). N.M. Riley gratefully acknowledges support from a National Science Foundation Graduate Research Fellowship (DGE-1256259). A.L. Richards gratefully acknowledges support from the American Chemical Society Division of Analytical Chemistry and from the Society of Analytical Chemists of Pittsburgh.
Footnotes
Conflict of interest: D.P. Kelly is a scientific consultant for Pfizer Inc. and receives research support from Takeda Pharmaceuticals and Acorda Therapeutics. R.B. Vega and D.M. Muoio receive research support from Pfizer Inc. J.J. Coon is a consultant for Thermo Fisher Scientific.
Reference information:JCI Insight. 2016;1(2):e84897. doi:10.1172/jci.insight.84897.
Contributor Information
Julie L. Horton, Email: jhorton@sbpdiscovery.org.
Ola J. Martin, Email: omartin@sbpdiscovery.org.
Ling Lai, Email: lingl@sbpdiscovery.org.
Nicholas M. Riley, Email: riley.nicholasm@gmail.com.
Alicia L. Richards, Email: arichards@chem.wisc.edu.
Teresa C. Leone, Email: tleone@sbpdiscovery.org.
Deborah M. Muoio, Email: muoio@duke.edu.
Kenneth B. Margulies, Email: Ken.Margulies@uphs.upenn.edu.
Daniel P. Kelly, Email: dkelly@sanfordburnham.org.
References
- 1.Bing RJ. The metabolism of the heart. Harvey Lect. 1954;50:27–70. [PubMed] [Google Scholar]
- 2.Bing RJ, Siegel A, Ungar I, Gilbert M. Metabolism of the human heart. II. Studies on fat, ketone and amino acid metabolism. Am J Med. 1954;16(4):504–515. doi: 10.1016/0002-9343(54)90365-4. [DOI] [PubMed] [Google Scholar]
- 3.Wisneski JA, Gertz EW, Neese RA, Mayr M. Myocardial metabolism of free fatty acids. Studies with 14C-labeled substrates in humans. J Clin Invest. 1987;79(2):359–366. doi: 10.1172/JCI112820. [DOI] [PMC free article] [PubMed] [Google Scholar]
- 4.Lopaschuk GD, Belke DD, Gamble J, Itoi T, Schonekess BO. Regulation of fatty acid oxidation in the mammalian heart in health and disease. Biochim Biophys Acta. 1994;1213(3):263–276. doi: 10.1016/0005-2760(94)00082-4. [DOI] [PubMed] [Google Scholar]
- 5.van der Vusse GJ, van Bilsen M, Glatz JF. Cardiac fatty acid uptake and transport in health and disease. Cardiovasc Res. 2000;45(2):279–293. doi: 10.1016/S0008-6363(99)00263-1. [DOI] [PubMed] [Google Scholar]
- 6.Kelly DP, Strauss AW. Inherited cardiomyopathies. N Engl J Med. 1994;330(13):913–919. doi: 10.1056/NEJM199403313301308. [DOI] [PubMed] [Google Scholar]
- 7.Bishop SP, Altschuld RA. Increased glycolytic metabolism in cardiac hypertrophy and congestive failure. Am J Physiol. 1970;218(1):153–159. doi: 10.1152/ajplegacy.1970.218.1.153. [DOI] [PubMed] [Google Scholar]
- 8.Taegtmeyer H, Overturf ML. Effects of moderate hypertension on cardiac function and metabolism in the rabbit. Hypertension. 1988;11(5):416–426. doi: 10.1161/01.HYP.11.5.416. [DOI] [PubMed] [Google Scholar]
- 9.Allard MF, Schonekess BO, Henning SL, English DR, Lopaschuk GD. Contribution of oxidative metabolism and glycolysis to ATP production in hypertrophied hearts. Am J Physiol. 1994;267(2 pt 2):H742–H750. doi: 10.1152/ajpheart.1994.267.2.H742. [DOI] [PubMed] [Google Scholar]
- 10.Christe ME, Rodgers RL. Altered glucose and fatty acid oxidation in hearts of the spontaneously hypertensive rat. J Mol Cell Cardiol. 1994;26(10):1371–1375. doi: 10.1006/jmcc.1994.1155. [DOI] [PubMed] [Google Scholar]
- 11.Paolisso G, et al. Total-body and myocardial substrate oxidation in congestive heart failure. Metabolism. 1994;43(2):174–179. doi: 10.1016/0026-0495(94)90241-0. [DOI] [PubMed] [Google Scholar]
- 12.Sambandam N, Lopaschuk GD, Brownsey RW, Allard MF. Energy metabolism in the hypertrophied heart. Heart Fail Rev. 2002;7(2):161–173. doi: 10.1023/A:1015380609464. [DOI] [PubMed] [Google Scholar]
- 13.Chandler MP, et al. Moderate severity heart failure does not involve a downregulation of myocardial fatty acid oxidation. Am J Physiol Heart Circ Physiol. 2004;287(4):H1538–H1543. doi: 10.1152/ajpheart.00281.2004. [DOI] [PubMed] [Google Scholar]
- 14.Wallhaus TR, et al. Myocardial free fatty acid and glucose use after carvedilol treatment in patients with congestive heart failure. Circulation. 2001;103(20):2441–2446. doi: 10.1161/01.CIR.103.20.2441. [DOI] [PubMed] [Google Scholar]
- 15.Davila-Roman VG, et al. Altered myocardial fatty acid and glucose metabolism in idiopathic dilated cardiomyopathy. J Am Coll Cardiol. 2002;40(2):271–277. doi: 10.1016/S0735-1097(02)01967-8. [DOI] [PubMed] [Google Scholar]
- 16.de las Fuentes L, Herrero P, Peterson LR, Kelly DP, Gropler RJ, Davila-Roman VG. Myocardial fatty acid metabolism: independent predictor of left ventricular mass in hypertensive heart disease. Hypertension. 2003;41(1):83–87. doi: 10.1161/01.HYP.0000047668.48494.39. [DOI] [PubMed] [Google Scholar]
- 17.Ingwall JS, et al. The creatine kinase system in normal and diseased human myocardium. New Engl J Med. 1985;313(17):1050–1054. doi: 10.1056/NEJM198510243131704. [DOI] [PubMed] [Google Scholar]
- 18.de Roos A, Doornbos J, Luyten PR, Oosterwaal LJ, van der Wall EE, den Hollander JA. Cardiac metabolism in patients with dilated and hypertrophic cardiomyopathy: assessment with proton-decoupled P-31 MR spectroscopy. J Magn Reson Imaging. 1992;2(6):711–719. doi: 10.1002/jmri.1880020616. [DOI] [PubMed] [Google Scholar]
- 19.Tian R, Nascimben L, Kaddurah-Daouk R, Ingwall JS. Depletion of energy reserve via the creatine kinase reaction during the evolution of heart failure in cardiomyopathic hamsters. J Mol Cell Card. 1996;28(4):755–765. doi: 10.1006/jmcc.1996.0070. [DOI] [PubMed] [Google Scholar]
- 20.Ingwall JS, Weiss RG. Is the failing heart energy starved? On using chemical energy to support cardiac function. Circ Res. 2004;95(2):135–145. doi: 10.1161/01.RES.0000137170.41939.d9. [DOI] [PubMed] [Google Scholar]
- 21.Carley AN, Taegtmeyer H, Lewandowski ED. Matrix revisited: mechanisms linking energy substrate metabolism to the function of the heart. Circ Res. 2014;114(4):717–729. doi: 10.1161/CIRCRESAHA.114.301863. [DOI] [PMC free article] [PubMed] [Google Scholar]
- 22.Neubauer S, et al. Myocardial phosphocreatine-to-ATP ratio is a predictor of mortality in patients with dilated cardiomyopathy. Circulation. 1997;96(7):2190–2196. doi: 10.1161/01.CIR.96.7.2190. [DOI] [PubMed] [Google Scholar]
- 23.Neubauer S. The failing heart--an engine out of fuel. New Engl J Med. 2007;356(11):1140–1151. doi: 10.1056/NEJMra063052. [DOI] [PubMed] [Google Scholar]
- 24.Razeghi P, Young ME, Alcorn JL, Moravec CS, Frazier OH, Taegtmeyer H. Metabolic gene expression in fetal and failing human heart. Circulation. 2001;104(24):2923–2931. doi: 10.1161/hc4901.100526. [DOI] [PubMed] [Google Scholar]
- 25.Huss JM, Kelly DP. Mitochondrial energy metabolism in heart failure: a question of balance. J Clin Invest. 2005;115(3):547–555. doi: 10.1172/JCI24405. [DOI] [PMC free article] [PubMed] [Google Scholar]
- 26.Sack MN, Rader TA, Park S, Bastin J, McCune SA, Kelly DP. Fatty acid oxidation enzyme gene expression is downregulated in the failing heart. Circulation. 1996;94(11):2837–2842. doi: 10.1161/01.CIR.94.11.2837. [DOI] [PubMed] [Google Scholar]
- 27.Chen L, Gong Q, Stice JP, Knowlton AA. Mitochondrial OPA1, apoptosis, and heart failure. Cardiovasc Res. 2009;84(1):91–99. doi: 10.1093/cvr/cvp181. [DOI] [PMC free article] [PubMed] [Google Scholar]
- 28.Lai L, et al. Energy metabolic reprogramming in the hypertrophied and early stage failing heart: a multisystems approach. Circ Heart Fail. 2014;7(6):1022–1031. doi: 10.1161/CIRCHEARTFAILURE.114.001469. [DOI] [PMC free article] [PubMed] [Google Scholar]
- 29.Bedi KC, Jr, et al. Evidence for intramyocardial disruption of lipid metabolism and increased myocardial ketone utilization in advanced human heart failure. Circulation. doi: 10.1161/CIRCULATIONAHA.1. [published online ahead of print January 27, 2016]. doi: 10.1161/CIRCULATIONAHA.115.017545. [DOI] [PMC free article] [PubMed] [Google Scholar]
- 30.Fernandes J, et al. Lysine acetylation activates mitochondrial aconitase in the heart. Biochemistry. 2015;54(25):4008–4018. doi: 10.1021/acs.biochem.5b00375. [DOI] [PMC free article] [PubMed] [Google Scholar]
- 31.Baeza J, Smallegan MJ, Denu JM. Site-specific reactivity of nonenzymatic lysine acetylation. ACS Chem Biol. 2015;10(1):122–128. doi: 10.1021/cb500848p. [DOI] [PMC free article] [PubMed] [Google Scholar]
- 32.Dittenhafer-Reed KE, et al. SIRT3 mediates multi-tissue coupling for metabolic fuel switching. Cell Metab. 2015;21(4):637–646. doi: 10.1016/j.cmet.2015.03.007. [DOI] [PMC free article] [PubMed] [Google Scholar]
- 33.Cimen H, Han MJ, Yang Y, Tong Q, Koc H, Koc EC. Regulation of succinate dehydrogenase activity by SIRT3 in mammalian mitochondria. Biochemistry. 2010;49(2):304–311. doi: 10.1021/bi901627u. [DOI] [PMC free article] [PubMed] [Google Scholar]
- 34.Huss JM, et al. The nuclear receptor ERRα is required for the bioenergetic and functional adaptation to cardiac pressure overload. Cell Metab. 2007;6(1):25–37. doi: 10.1016/j.cmet.2007.06.005. [DOI] [PubMed] [Google Scholar]
- 35.Weinheimer CJ, Lai L, Kelly DP, Kovacs A. Novel mouse model of left ventricular pressure overload and infarction causing predictable ventricular remodelling and progression to heart failure. Clin Exp Pharmacol Physiol. 2015;42(1):33–40. doi: 10.1111/1440-1681.12318. [DOI] [PMC free article] [PubMed] [Google Scholar]
- 36.Hebert AS, et al. Calorie restriction and SIRT3 trigger global reprogramming of the mitochondrial protein acetylome. Mol Cell. 2013;49(1):186–199. doi: 10.1016/j.molcel.2012.10.024. [DOI] [PMC free article] [PubMed] [Google Scholar]
- 37.Hirschey MD, et al. SIRT3 deficiency and mitochondrial protein hyperacetylation accelerate the development of the metabolic syndrome. Mol Cell. 2011;44(2):177–190. doi: 10.1016/j.molcel.2011.07.019. [DOI] [PMC free article] [PubMed] [Google Scholar]
- 38.Wagner GR, Payne RM. Widespread and enzyme-independent Nepsilon-acetylation and Nepsilon-succinylation of proteins in the chemical conditions of the mitochondrial matrix. J Biol Chem. 2013;288(40):29036–29045. doi: 10.1074/jbc.M113.486753. [DOI] [PMC free article] [PubMed] [Google Scholar]
- 39.Aubert G, et al. The failing heart relies on ketone bodies as a fuel. Circulation. doi: 10.1161/CIRCULATIONAHA.1. [published online ahead of print January 27, 2016]. [DOI] [PMC free article] [PubMed] [Google Scholar]
- 40.Peek CB, et al. Circadian clock NAD+ cycle drives mitochondrial oxidative metabolism in mice. Science. 2013;342(6158):e84897. doi: 10.1126/science.1243417. [DOI] [PMC free article] [PubMed] [Google Scholar]
- 41.Ahn BH, et al. A role for the mitochondrial deacetylase Sirt3 in regulating energy homeostasis. Proc Natl Acad Sci U S A. 2008;105(38):14447–14452. doi: 10.1073/pnas.0803790105. [DOI] [PMC free article] [PubMed] [Google Scholar]
- 42.Anderson KA, Hirschey MD. Mitochondrial protein acetylation regulates metabolism. Essays Biochem. 2012;52:23–35. doi: 10.1042/bse0520023. [DOI] [PMC free article] [PubMed] [Google Scholar]
- 43.Choudhary C, Weinert BT, Nishida Y, Verdin E, Mann M. The growing landscape of lysine acetylation links metabolism and cell signalling. Nat Rev Mol Cell Biol. 2014;15(8):536–550. doi: 10.1038/nrm3841. [DOI] [PubMed] [Google Scholar]
- 44.Hirschey MD, et al. SIRT3 regulates mitochondrial fatty-acid oxidation by reversible enzyme deacetylation. Nature. 2010;464(7285):121–125. doi: 10.1038/nature08778. [DOI] [PMC free article] [PubMed] [Google Scholar]
- 45.Fan J, et al. Tyr phosphorylation of PDP1 toggles recruitment between ACAT1 and SIRT3 to regulate the pyruvate dehydrogenase complex. Mol Cell. 2014;53(4):534–548. doi: 10.1016/j.molcel.2013.12.026. [DOI] [PMC free article] [PubMed] [Google Scholar]
- 46.Jain-Ghai S, et al. Complex II deficiency — a case report and review of the literature. Am J Med Genet A. 2013;161A(2):285–294. doi: 10.1002/ajmg.a.35714. [DOI] [PubMed] [Google Scholar]
- 47.Karamanlidis G, et al. Mitochondrial complex I deficiency increases protein acetylation and accelerates heart failure. Cell Metab. 2013;18(2):239–250. doi: 10.1016/j.cmet.2013.07.002. [DOI] [PMC free article] [PubMed] [Google Scholar]
- 48.Hsu CP, et al. Silent information regulator 1 protects the heart from ischemia/reperfusion. Circulation. 2010;122(21):2170–2182. doi: 10.1161/CIRCULATIONAHA.110.958033. [DOI] [PMC free article] [PubMed] [Google Scholar]
- 49.Yamamoto T, Sadoshima J. Protection of the heart against ischemia/reperfusion by silent information regulator 1. Trends Cardiovasc Med. 2011;21(1):27–32. doi: 10.1016/j.tcm.2012.01.005. [DOI] [PMC free article] [PubMed] [Google Scholar]
- 50.Gu XS, et al. Resveratrol, an activator of SIRT1, upregulates AMPK and improves cardiac function in heart failure. Genet Mol Res. 2014;13(1):323–335. doi: 10.4238/2014.January.17.17. [DOI] [PubMed] [Google Scholar]
- 51.Still AJ, et al. Quantification of mitochondrial acetylation dynamics highlights prominent sites of metabolic regulation. J Biol Chem. 2013;288(36):26209–26219. doi: 10.1074/jbc.M113.483396. [DOI] [PMC free article] [PubMed] [Google Scholar]
- 52.Grimsrud PA, et al. A quantitative map of the liver mitochondrial phosphoproteome reveals posttranslational control of ketogenesis. Cell Metab. 2012;16(5):672–683. doi: 10.1016/j.cmet.2012.10.004. [DOI] [PMC free article] [PubMed] [Google Scholar]
- 53.Geer LY, et al. Open mass spectrometry search algorithm. J Proteome Res. 2004;3(5):958–964. doi: 10.1021/pr0499491. [DOI] [PubMed] [Google Scholar]
- 54.Wenger CD, Phanstiel DH, Lee MV, Bailey DJ, Coon JJ. COMPASS: a suite of pre- and post-search proteomics software tools for OMSSA. Proteomics. 2011;11(6):1064–1074. doi: 10.1002/pmic.201000616. [DOI] [PMC free article] [PubMed] [Google Scholar]
- 55.Phanstiel DH, et al. Proteomic and phosphoproteomic comparison of human ES and iPS cells. Nat Methods. 2011;8(10):821–827. doi: 10.1038/nmeth.1699. [DOI] [PMC free article] [PubMed] [Google Scholar]
- 56.Nesvizhskii AI, Aebersold R. Interpretation of shotgun proteomic data: the protein inference problem. Mol Cell Proteomics. 2005;4(10):1419–1440. doi: 10.1074/mcp.R500012-MCP200. [DOI] [PubMed] [Google Scholar]
- 57.Kim W, et al. Systematic and quantitative assessment of the ubiquitin-modified proteome. Mol Cell. 2011;44(2):325–340. doi: 10.1016/j.molcel.2011.08.025. [DOI] [PMC free article] [PubMed] [Google Scholar]
- 58.Pagliarini DJ, et al. A mitochondrial protein compendium elucidates complex I disease biology. Cell. 2008;134(1):112–123. doi: 10.1016/j.cell.2008.06.016. [DOI] [PMC free article] [PubMed] [Google Scholar]
- 59.Saks VA, et al. Permeabilized cell and skinned fiber techniques in studies of mitochondrial function in vivo. Mol Cell Biochem. 1998;184(1–2):81–100. [PubMed] [Google Scholar]
- 60.Liu H, Naismith JH. An efficient one-step site-directed deletion, insertion, single and multiple-site plasmid mutagenesis protocol. BMC Biotechnol. 2008;8:e84897. doi: 10.1186/1472-6750-8-91. [DOI] [PMC free article] [PubMed] [Google Scholar]
- 61.Salabei JK, Gibb AA, Hill BG. Comprehensive measurement of respiratory activity in permeabilized cells using extracellular flux analysis. Nat Protoc. 2014;9(2):421–438. doi: 10.1038/nprot.2014.018. [DOI] [PMC free article] [PubMed] [Google Scholar]
- 62.Ackrell BA, Kearney EB, Singer TP. Mammalian succinate dehydrogenase. Methods Enzymol. 1978;53:466–483. doi: 10.1016/s0076-6879(78)53050-4. [DOI] [PubMed] [Google Scholar]
- 63.Birch-Machin MA, Turnbull DM. Assaying mitochondrial respiratory complex activity in mitochondria isolated from human cells and tissues. Methods Cell Biol. 2001;65:97–117. doi: 10.1016/S0091-679X(01)65006-4. [DOI] [PubMed] [Google Scholar]
- 64.Acin-Perez R, et al. ROS-triggered phosphorylation of complex II by Fgr kinase regulates cellular adaptation to fuel use. Cell Metab. 2014;19(6):1020–1033. doi: 10.1016/j.cmet.2014.04.015. [DOI] [PMC free article] [PubMed] [Google Scholar]
Associated Data
This section collects any data citations, data availability statements, or supplementary materials included in this article.