

Abstract
ClinicalTrials.gov has been archiving clinical trials since 1999, with > 165,000 trials at present. It is a valuable but relatively untapped resource for understanding trial design patterns and acquiring reusable trial design knowledge. We extracted common eligibility features using an unsupervised tag-mining method and mined their temporal usage patterns in clinical trials on various cancers. We then employed trend and network analysis to investigate two questions: (1) what eligibility features are frequently used to select patients for clinical trials within one cancer or across multiple cancers; and (2) what are the trends in eligibility feature adoption or discontinuation across cancer research domains? Our results showed that each cancer domain reuses a small set of eligibility features frequently for selecting cancer trial patients and some features are shared across different cancers, with value range adjustments for numerical measures. We discuss the implications for facilitating community-based clinical research knowledge sharing and reuse.
Keywords: Clinical Trials, Patient Selection, Knowledge Management
1 Introduction
Knowledge management and standards-based clinical research design are two related tasks of high priority for the field of clinical research informatics since its inception. One type of clinical research, the randomized controlled trial, has long been accepted as the gold standard for generating high-quality medical evidence. Therefore, much effort has been devoted to developing formal representations for clinical trial protocols [1–5], clinical trial eligibility criteria [6, 7], or common data elements for clinical trial data collection [8–10]. Most of these efforts have resulted in ontologies or expert systems for supporting computational reuse of clinical trial eligibility criteria. However, due to the lack of interoperability among such ontologies or standards [11–13] and the high cost of text knowledge engineering for clinical research protocols, there has been limited adoption of these methods by the clinical research community for improving the computability of new clinical trial designs, which are usually written as lengthy, free-text paper documents.
Meanwhile, studies have also revealed the great need of the clinical research community for clinical research knowledge reuse [14, 15], as reflected by the fact that eligibility criteria texts for patient selection are often similar, and sometimes identical, across different studies within the same disease domain or across different disease domains [15, 16]. Little is known about knowledge reuse patterns in clinical trial designs for patient selection, either within or across diseases, but such knowledge could potentially inform the construction of valuable trial design knowledge bases that address clinical researchers’ needs for knowledge reuse. Moreover, the availability of ClinicalTrials.gov [17], the largest public clinical trial repository with over 165,000 trials for thousands of diseases as of April 2014, presents a valuable opportunity for using Big Data analytics to discover eligibility criteria knowledge reuse patterns from clinical trial summary text.
This paper reports the results of a preliminary attempt to analyze such patterns. Using cancer clinical trial eligibility criteria as an example, we employed network and trend analysis to address these two research questions: (1) what eligibility features are frequently used to select patients for clinical trials of one cancer type or across multiple cancer types; (2) what are the temporal patterns in adopting or rejecting frequently used eligibility features? We then discuss the implications for supporting knowledge reuse and sharing for clinical trial eligibility criteria designs in the future.
2 Methods
2.1 Selecting an Example Problem Domain: Cancer
Entering a disease name in the “Condition” field on the online search form provided by ClinicalTrials.gov can retrieve all clinical trial summaries for a specific medical condition. Given the global priority of cancer research, we decided to focus on clinical trial eligibility criteria for all cancers. Therefore, we retrieved and downloaded all the eligibility criteria text and information about their cancer types.
2.2 Mining Common Eligibility Features (CEFs) from Text
On ClinicalTrials.gov, all clinical trial eligibility criteria are stored and presented as unstructured text. We applied an unsupervised tag mining method [18] to extract discrete concepts from eligibility criteria text. The text was processed to remove special characters and punctuation and to build all the possible n-grams (i.e., continuous sub-sequences of n words). N-grams composed of only English stop words or irrelevant grammatical structures were removed. Each n-gram was matched against the Unified Medical Language System (UMLS)[19] Metathesaurus and retained only if at least one of its substrings was a recognizable UMLS concept. Moreover, we considered only those UMLS concepts appearing in semantic categories most relevant to the clinical trial domain. For example, “malignancy within the past 5 years” would be considered a valid n-gram because at least one word, “malignancy”, was present in the part of the UMLS lexicon considered, even if the entire sentence were not. Each n-gram term found in the UMLS lexicon was also normalized according to its preferred Concept Unique Identifier (CUI). Using the CUIs increased the density of concepts and enabled the handling of synonyms, since similar concepts are aligned to the same preferred term by the UMLS specification (e.g., “atrial fibrillation” and “auricular fibrillation” are both mapped to “atrial fibrillation”). This allowed identifying semantically unique eligibility features. Since each CUI may be mapped to more than one UMLS semantic type, we also assigned to each n-gram a distinctive UMLS semantic type by performing semantic type disambiguation using previously defined semantic preference rules [20]. After this process, each clinical trial’s eligibility criteria were summarized by a set of UMLS CUI-based n-grams representing the criteria’s relevant features. On this basis, we retained the n-grams appearing in at least 20% of all cancer trials and considered them common eligibility features (CEFs).
2.3 Trend Pattern Generation for CEFs and Cancers Pairs, Respectively
We analyzed the pairwise trend similarity between CEFs. A CEF’s occurrences over the 15 years formed a vector. We used the correlation coefficient significance test [21] to measure the correlation between any two vectors of the same length (e.g., length = 15 for CEFs) as follows:
The CEFs that occur in less than three years were excluded because their temporal patterns were meaningless. The remaining CEFs’ occurrences were normalized. We picked a P-value of 0.001 after preliminary experiments so that we only allowed 0.1% of chance for the identified correlation to be wrong. Using this P-value, according to the Correlation Coefficient Significance table, by using a degree of freedom of 13 since the length of each vector is 15, a significant relationship should have its correlation coefficient greater than 0.7603.
After identifying significant relationships in CEF pairs, we developed a temporal pattern matching method to automatically identify correlated CEF pairs based on their frequency changes in the 15 years. We divided the 15-year time interval into 14 consecutive subintervals. For each interval spanning two consecutive years (e.g., 2008–2009) for a certain CEF, we labeled it increasing, decreasing, or stable. We arrived at the temporal pattern for a CEF by concatenating the patterns in all 14 intervals.
To best match the real pattern of CEFs’ frequencies, after manual test, we assigned each interval a specific category as follows: if a CEF’s frequency in year (n+1) was 120% that of year n, we classified the pattern as “increasing”; if the frequency was < 80% that of the previous year, we classified the pattern as “decreasing”; if the frequency was between 80% and 120% of that of the previous year, we labeled the pattern as “stable”.
The trend patterns enabled the retrieval of pairs of CEFs of the following four types of match patterns: (a) exact, i.e., all concatenated intervals have the same pattern; (b) opposite, i.e. all concatenated intervals have opposite patterns; (c) offset, i.e., the pattern matches with a lag of one or two years; and (d) approximate, i.e. a match for between 12 and 13 subintervals (i.e., a number smaller than 14 but not too off).
In addition, for quantitative CEFs such as A1c, creatinine, creatinine clearance, or body mass index, we plotted their value range distribution among all the cancer trials to visualize how patients of different value ranges for the selected eligibility features are included for cancer trials.
2.4 Trend Summarization
We further developed piecewise functions to summarize the usage trend of the CEFs between years 1999 and 2013 by multiple sub-functions, each applying to a certain time interval of the main function’s domain (a subdomain). Our analysis included the following three steps. First, we calculated the usage of each CEF in each cancer type X in each year n, which ranges from 1999 to 2013. Second, to reduce the dimensions of the problem space, for each CEF, we partitioned the entire 15-year period into three 5-year intervals – 1999–2003, 2004–2008, and 2009–2013 – and calculated the average occurrences of the CEF for all cancer types within each sub-interval to get three values Xearliest, Xmiddle, Xlatest using this formula:
where subscript c is the earliest, middle, or latest time interval, n is the number of years in each interval (in this case n=5), i indicates each year in the time interval, and fi is the occurrence of the CEF in the given year i for the given cancer type X. The possible relationships among these three measurements are illustrated in Fig. 1. Fig. 1(a) indicates Xearliest < Xmiddle < Xlatest, while Fig. 1(b) indicates Xmiddle < Xearliest < Xlatest. Finally, we named three temporal patterns: increasing, decreasing, and stable, which match Fig. 1 (a–c), Fig. 1(d–f), and Fig. 1 (g) respectively. We defined what accounts for larger than, smaller than, and equal to respectively by comparing the difference among Xearliest, Xmiddle, and Xlatest to a delta selected programmatically.
Fig. 1.
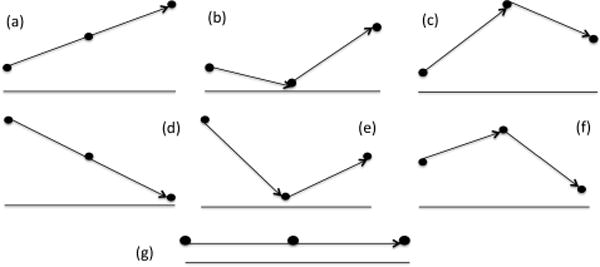
The seven (a–g) possible relationships among Xearliest, Xmiddle, Xlatest, where the x-axis represents time, while the y-axis represents the occurrence of a CEF across all cancer studies during the selected time period (earliest: 1999–2003, middle: 2004–2008, and latest: 2009–2013)
2.5 Network Analysis and Hierarchical Clustering
Using the information about the correlations among CEFs and similarities among cancers, we constructed the network of cancers and CEFs and calculated the network density and the centrality of each CEF (i.e., the count of cancers using this CEF at any time) or each center (i.e., the count of distinct CEFs used in trials of this cancer). We developed a 2-by-2 matrix of cancer type versus distinct CEF, in which the value of each cell was 0, −1, or 1, indicating that the CEF was classified as stable, decreasing, or increasing, respectively. Then, we hierarchically clustered cancer types by their similarity in (a) corresponding CEF centrality and (b) CEF trend patterns, respectively, using hierarchical clustering algorithm of MATLAB program. The pairwise distance between cancer types was measured using Jaccard Distance [22], which measures the percentage of nonzero elements that differ as follows:
where Ci and Cj feature vectors of the cancer types, with i, j being 1, 2,.., 95, i ≠ j. The smaller the Jaccard distance, the more similar were Ci and Cj.
3 Results
We identified 5,886 distinct CEFs that appeared in at least 20% of 99,109 cancer trials covering 95 cancer types. Their total occurrences in cancer trials were 54,927. The average number of CEFs used in a cancer research domain is 578.17. A total of 1,919 CEFs were used in research studies for only one cancer. We refer to these CEFs as cancer type-specific CEFs. On average, 78.72% of CEFs remain stable over time.
Fig. 2 plots the occurrences of CEFs of decreasing, increasing, or stable patterns in the 95 cancers. In all the cancers, most of the CEFs have stable usage patterns. Sixty-one cancers (64.2%) had more CEFs of increasing patterns than of decreasing patterns during the 15-year time period. Clinical trials for carcinoma of unknown primary site used the most CEFs, followed by skin and breast cancer, while trials for oropharyngeal cancer used the fewest CEFs, most with stable uses. These results imply that the uses of CEFs in cancer research are stable over time in general.
Fig. 2.
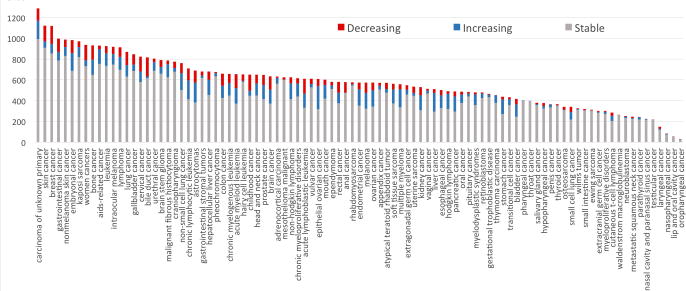
Distributions of the CEF occurrences with decreasing or increasing patterns in the 95 cancer types: X-axis represents cancer type, Y-axis represents counts of CEFs in the trials for that cancer
The top 15 cancers ranked by the number of CEFs are carcinoma of unknown primary origin, skin cancer, breast cancer, gastrointestinal cancer, nonmelanoma skin cancer, embryonal cancer, Kaposi’s sarcoma, gynecologic cancers, bone cancer, AIDS-related cancer, leukemia, intraocular melanoma, lymphoma, lung cancer, and gallbladder cancer, where Kaposi’s sarcoma and AIDS-related cancer are the same concept with different semantic representations.
The top 15 CEFs ranked by the number of cancers using them are gender = both, minimum age = 18, platelets adverse event, transaminases, therapeutic brand of coal tar, Karnofsky performance status, serum creatinine level, SGOT - glutamate oxaloacetate transaminase, alanine transaminase, allergy severity – severe, creatinine clearance, heart diseases, cardiac arrhythmia, operative surgical procedures, and pharmaceutical preparations.
Fig. 3 displays the trends of three sample CEFs: (1) hypersensitivity; (2) creatinine; and (3) creatinine clearance. Since 2005, hypersensitivity has been adopted by clinical trials for up to 41% cancer types as a CEF, while previously its usage ranged between 5% and 10%. Meanwhile, starting in 2006, creatinine clearance has gradually replaced creatinine to indicate kidney function for the trials of between 18% and 27% of cancers.
Fig. 3.
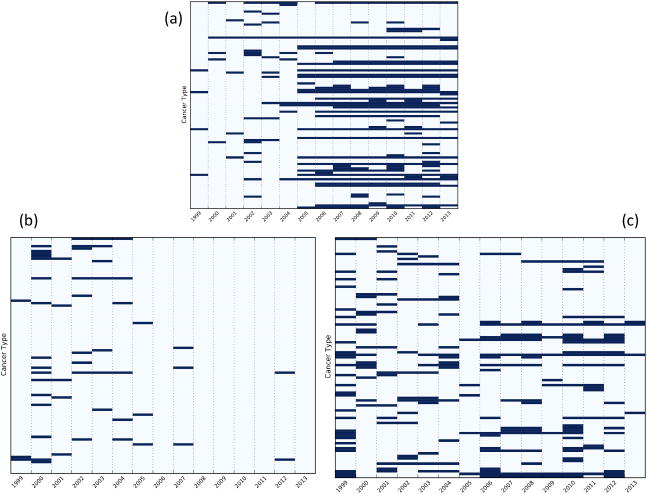
Trends of (a) hypersensitivity, (b) creatinine, and (c) creatinine clearance in cancer trials. The y-axis indicates 95 cancer types and x-axis indicate years 1999–2013. Each blue bar indicates that CEF appears in at least 20% of the trials of the cancer type for the year.
Fig. 4 shows the similar trends of (a) creatinine clearance for female cancer and breast cancer research and (b) serum creatinine level for pancreatic cancer and brain cancer research, as well as the opposite trends between CEFs pregnancy test negative and non-infiltrating lobular carcinoma for skin cancer research.
Fig. 4.
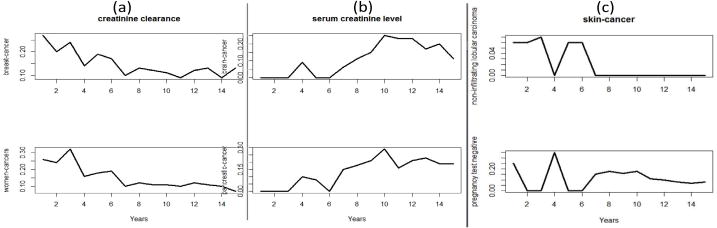
(a) the similar trends of creatinine clearance between women cancer and breast cancer; (b) the similar trends of serum creatinine level between pancreatic cancer and brain cancer; (c) the opposite trends of pregnancy-test negative and non-infiltrating nobular carcinoma in skin cancer research
Fig. 5 plots the collective value distribution for the numerical CEF creatinine clearance in all cancer trials. Such information can help the designers of a new clinical trial see what values have been used in existing trials.
Fig. 5.
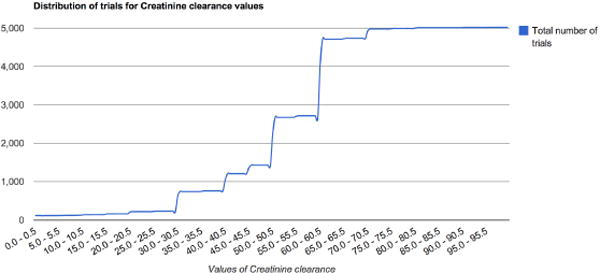
Value range distribution for a numerical CEF, creatinine clearance, in all cancer trials
Fig. 6 shows the hierarchical clustering view of all the 95 cancer types. Green areas indicate CEFs with increasing adoption in the corresponding cancer, red areas indicate CEFs with decreasing adoption, and black areas represent stable CEFs. The cancer types on the left side of Fig. 6 remain unchanged. For example, the number of CEFs with changing patterns in both pharyngeal cancer and throat cancer was 1, where the former was the subtype of the latter. The Jaccard distance between these two cancer types was 0, which means that the classification results of the CEFs used in these cancer types are the same. The total numbers of classified CEFs in the skin and breast cancers were 210 and 250, respectively. The Jaccard distance between these two cancer types was 0.46, which means that they share 54% of the CEFs that have the same trends in both cancers.
Fig. 6.
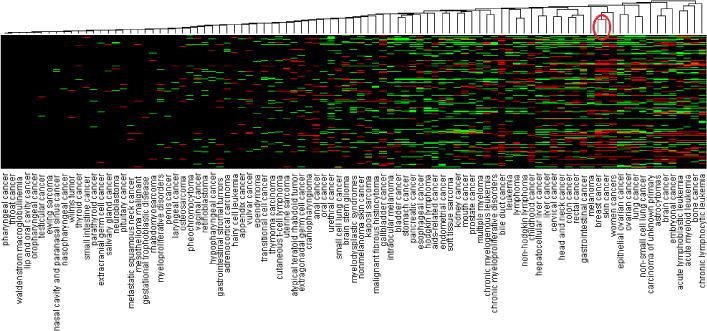
The hierarchical clustering view of all 95 cancer types clustered by their similar CEF trends (*: the red circle highlights breast and skin cancers)
As shown in Fig. 7, five clusters within which cancer types with similar centrality were grouped. Green areas indicate CEFs with increasing adoption in the corresponding cancer, red shows CEFs with decreasing adoption, and black represents stable CEFs. The leftmost cluster (linked by red lines on the top) includes breast cancer, skin cancer, women cancer, cervical cancer, head and neck cancer, colon cancer, and rectal cancer, gastrointestinal cancer, lung cancer, and non-small cell lung cancer.
Fig. 7.
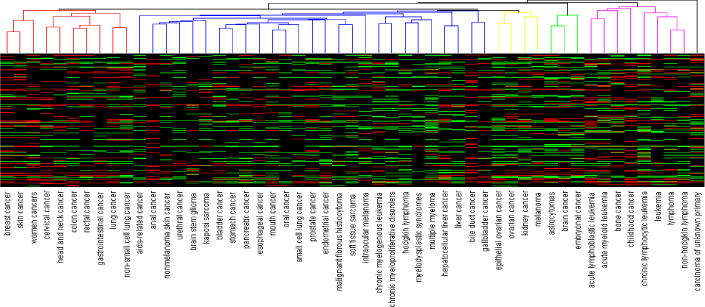
The hierarchical clustering view of the cancer types that had at least 99 CEFs grouped by their similar centrality, i.e., count of CEFs connected to each cancer
We took the top 30 scored cancer-pairs and built a network based on their connections, as shown in Fig. 8. Each cancer-pair’s score was assigned by calculating the prevalence of the pairwise-relatedness of each two cancers among all CEFs. It can be seen that biologically related cancers are clustered into same group. The group for women cancers, for circulatory system related cancers, and for alimentary system-related cancers were all closely clustered. The similarity between skin cancer and breast cancer was previously reported [23].
Fig. 8.
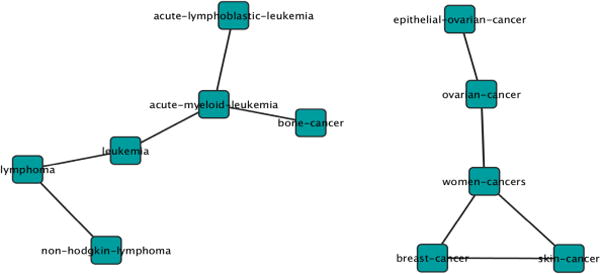
Example correlated cancers linked together
4 Discussion
4.1 Literature-Based Results Evaluation
Our network analysis shows that some CEFs are important for a specific cancer, e.g. “communicable diseases” is a cluster center for acute lymphoblastic leukemia. Prior research has shown that infection plays a very important role in children acute lymphoblastic leukemia [24]. Although we used a rigorous definition of correlation, the top 30 cancer pairs’ scores were very high—over 50 out of 378 CEFs, which means they were correlated in nearly 15% of all the CEFs, indicating that the correlated cancers may have some strong intrinsic relation and potentially a biological relation. Since cancers in different body systems are well grouped together, e.g. women cancer, group for circulatory system related cancer, group for alimentary system-related cancers, future studies are warranted to test the existence of biological relations among these identified correlated cancers. For example, astrocytoma is a neurologic cancer inside brain; our results showed this connection. Prior research studies have confirmed the relation between breast cancer and skin cancer. In general, some of the results confirmed both biological knowledge and existing research findings.
4.2 Reusable Eligibility Features in Cancer Trials
The results show that in most of cancer trials, 67.40% of their CEFs were shared with other trials on different cancers. This phenomenon may be due to the common procedure of clinical trials or the similar conditions for all cancers. The cancer type-specific CEFs contain special information while common CEFs reveal the similarity in eligibility feature selection among different cancer trials. The cancer-specific CEFs tend to be distributed unevenly across all cancers, which may be associated with several possible explanations. It may be due to the measurability for a certain disease or the level of communication by the researchers in this domain or even the popularity of the disease research. Those factors may cause the high variation of cancer-specific CEFs. As a result, one can argue that those CEFs may contain less useful information. However, when we develop the cancer research knowledge network using the CEFs, the cancer-specific CEFs could contain information that could be useful in differentiating research among different types of cancers. For common CEFs, they are more robust and sometimes are reflections of the common procedures of the cancer domain.
4.3 Implications for Clinical Research Standards Development
The field of biomedical informatics, including the subfield of clinical research informatics, is becoming burdened by the proliferation of clinical research information standards, available or under development, and their consequent sparse adoption by clinical researchers and vendors. To supplement the current top-down model of “standards development by experts followed by dissemination to users”, we propose a temporal knowledge acquisition method for uncovering frequently used data elements in clinical research text to facilitate community-based knowledge sharing and empirically founded standards development. We hypothesize that this method can identify content frequently used by the research community and thereby increase the adoption of standards derived “from researchers and for researchers”.
4.4 Limitations and Future Work
This study has several limitations that we hope will motivate future work. First, in this study, we focused on discrete, UMLS-recognizable common eligibility features, such as A1c, creatinine clearance, and serum creatinine level. We based this decision on the limitation in our current text-mining technique that can only extract n-grams without syntactic processing at the sentence level. We did not extract contextual clinical outcome variables, such as “heart attack after stroke within the past 5 years”, whose reuse patterns may be more useful to clinical trial investigators. One of our future directions is to enhance our tag mining method to capture such long phrases and analyze their trends and cancer trials with similar patterns for such long phrases.
Second, persistent data quality deficiencies in the ClinicalTrials.gov remain a barrier to such studies. We observed dependencies among cancer names used in ClinicalTrials.gov, such as “women cancers”, “breast cancer”, and “ovarian cancer”; the former is a more general concept to the latter two. Such dependencies can interfere with aggregation studies across cancers. More work is needed to improve the indexing of clinical trials by precise medical condition terminologies on ClinicalTrials.gov.
Moreover, the eligibility criteria for clinical trials almost always expressed as separate inclusion and exclusion criteria. In this study, we combined them together for several reasons. First, they all contain certain level of information indicating the conditions of interest. Second, there is no standard for how researchers should state the eligibility section for ClinicalTrials.gov. Thus, it is hard to clearly separate the inclusion from exclusion criteria.
Our lab has recently developed a database called COMPACT (Commonalities in Target Populations of Clinical Trials) using the text-mining results from ClinicalTrials.gov. We downloaded all the XML-format trial files from ClinicalTrials.gov. We made all the structured characteristics of trials readily computable by extracting them from trials and storing them in a relational database. Using COMPACT, we can refine the trend and network analysis of CEFs by specifying various characteristics of trials, such as phase, study type (interventional/observational), and intervention type (i.e., drug, device, and procedure). For example, we can analyze the trend of CEFs of phases-3 medication intervention trials involving female patients 75 years old or older with COMPACT. This resource can potentially make the analyses reported in this paper more fine-grained and more readily available for medical conditions other than cancer. In the future, we will perform such analyses with the hope of discovering granular patterns in the eligibility criteria designs for various diseases.
5 Conclusions
We contributed an analytical method to identify the most common eligibility criteria of cancer clinical trials and to identify those criteria with increasing or decreasing adoption patterns in different cancer studies over time. This method can potentially generalize to other disease domains. Our data-driven approach to acquiring clinical research knowledge from text has the potential to supplement existing expert-based methods for clinical research standards development and hence may increase the likelihood of the adoption of those standards.
Acknowledgments
This study was funded by the National Library of Medicine grant R01 LM009886.
Contributor Information
Chunhua Weng, Email: cw2384@columbia.edu.
Anil Yaman, Email: anilyaman00@gmail.com.
Kuo Lin, Email: kl2734@columbia.edu.
Zhe He, Email: zh2132@columbia.edu.
References
- 1.Kamal J, Pasuparthi K, Rogers P, Buskirk J, Mekhjian HS. Using and Information Warehouse to Screen Patients for Clinical Trials: A Prototype; American Medical Informatics Association Annual Symposium; Washington, DC. 2005. [PMC free article] [PubMed] [Google Scholar]
- 2.Nammuni K, Pickering C, Modgil S, Montgomery A, Hammond P, Wyatt JC, et al. Design-a-trial: a rule-based decision support system for clinical trial design. Knowledge-Based Systems. 2004;17:121–129. [Google Scholar]
- 3.Musen MA, Tu SW, Das AK, Shahar Y. EON: a component-based approach to automation of protocol-directed therapy. JAMIA. 1996;3:367–388. doi: 10.1136/jamia.1996.97084511. [DOI] [PMC free article] [PubMed] [Google Scholar]
- 4.Musen MA, Rohn JA, Fagan LM, Shortliffe EH. Knowledge engineering for a clinical trial advice system: uncovering errors in protocol specification. Bulletin du Cancer. 1987;74:291–296. [PubMed] [Google Scholar]
- 5.Shortliffe EH, Scott AC, Bischoff MB, Campbell AB, Melle WV, Jacobs CD. ONCOCIN: An expert system for oncology protocol management; Seventh International Joint Conference on Artificial Intelligence; Vancouver, BC. 1981. [Google Scholar]
- 6.Weng C, Tu SW, Sim I, Richesson R. Formal representation of eligibility criteria: a literature review. J Biomed Inform. 2010;43:451–467. doi: 10.1016/j.jbi.2009.12.004. [DOI] [PMC free article] [PubMed] [Google Scholar]
- 7.Milian K, Bucur A, van Harmelen F. Building a Library of Eligibility Criteria to Support Design of Clinical Trials. In: ten Teije A, Völker J, Handschuh S, Stuckenschmidt H, d’Acquin M, Nikolov A, Aussenac-Gilles N, Hernandez N, editors. EKAW 2012. LNCS (LNAI) Vol. 7603. Springer; Heidelberg: 2012. pp. 327–336. [Google Scholar]
- 8.Luo Z, Miotto R, Weng C. A human-computer collaborative approach to identifying common data elements in clinical trial eligibility criteria. Journal of Biomedical Informatics. 2013;46:33–39. doi: 10.1016/j.jbi.2012.07.006. [DOI] [PMC free article] [PubMed] [Google Scholar]
- 9.Niland J, Dorr D, El Saadawi G, Embi P, Richesson RL, Sim I, et al. Knowledge Representation of Eligibility Criteria in Clinical Trials; American Medical Informatics Association Annual Symposium; Chicago. 2007. [Google Scholar]
- 10.Gennari J, Sklar D, Silva J. Cross-tool communication: From protocol authoring to eligibility determination. Proc AMIA Symp. 2001:199–203. [PMC free article] [PubMed] [Google Scholar]
- 11.Weng C, Gennari JH, Fridsma DB. User-centered semantic harmonization: a case study. J Biomed Inform. 2007;40:353–364. doi: 10.1016/j.jbi.2007.03.004. [DOI] [PubMed] [Google Scholar]
- 12.Weng C, Fridsma DB. A call for collaborative semantics harmonization. AMIA Annu Symp Proc. 2006;1142 [PMC free article] [PubMed] [Google Scholar]
- 13.Tenenbaum JD, Sansone SA, Haendel M. A sea of standards for omics data: sink or swim? Journal of the American Medical Informatics Association: JAMIA. 2014;21:200–203. doi: 10.1136/amiajnl-2013-002066. [DOI] [PMC free article] [PubMed] [Google Scholar]
- 14.Bhattacharya S, Cantor MN. Analysis of eligibility criteria representation in industry-standard clinical trial protocols. J Biomed Inform. 2013;46:805–813. doi: 10.1016/j.jbi.2013.06.001. [DOI] [PubMed] [Google Scholar]
- 15.Hao T, Rusanov A, Boland MR, Weng C. Clustering clinical trials with similar eligibility criteria features. J Biomed Inform. 2014 February 1; doi: 10.1016/j.jbi.2014.01.009. [DOI] [PMC free article] [PubMed] [Google Scholar]
- 16.Boland MR, Miotto R, Weng C. A method for probing disease relatedness using common clinical eligibility criteria. Studies in Health Technology and Informatics. 2013;192:481–485. [PMC free article] [PubMed] [Google Scholar]
- 17.McCray AT. Better access to information about clinical trials. Ann Intern Med. 2000;133:609–614. doi: 10.7326/0003-4819-133-8-200010170-00013. [DOI] [PubMed] [Google Scholar]
- 18.Miotto R, Weng C. Unsupervised mining of frequent tags for clinical eligibility text indexing. Journal of Biomedical Informatics. 2013;46:1145–1151. doi: 10.1016/j.jbi.2013.08.012. [DOI] [PMC free article] [PubMed] [Google Scholar]
- 19.Lindberg DA, Humphreys BL, McCray AT. The Unified Medical Language System. Methods Inf Med. 1993;32:281–291. doi: 10.1055/s-0038-1634945. [DOI] [PMC free article] [PubMed] [Google Scholar]
- 20.Luo Z, Johnson SB, Weng C. Semi-Automatically Inducing Semantic Classes of Clinical Research Eligibility Criteria Using UMLS and Hierarchical Clustering. AMIA Annu Symp Proc. 2010;2010:487–491. [PMC free article] [PubMed] [Google Scholar]
- 21.Fisher RA. On the probable error of a coefficient of correlation deduced from a small sample. Metron. 1921;1:3–32. [Google Scholar]
- 22.Jaccard P. Lois de distribution florale. Bulletin de la Socíeté Vaudoise des Sciences Naturelles. 1902;38:67–130. [Google Scholar]
- 23.Ho WL, Comber H, Hill AD, Murphy GM. Malignant melanoma and breast carcinoma: a bidirectional correlation. Ir J Med Sci. 2011;180:901–903. doi: 10.1007/s11845-009-0297-5. [DOI] [PubMed] [Google Scholar]
- 24.Hishamuddin P. The association between acute lymphoblastic leukemia in children and Helicobacter pylori as the marker for sanitation. BMC Res Notes. 2012;5:345. doi: 10.1186/1756-0500-5-345. [DOI] [PMC free article] [PubMed] [Google Scholar]