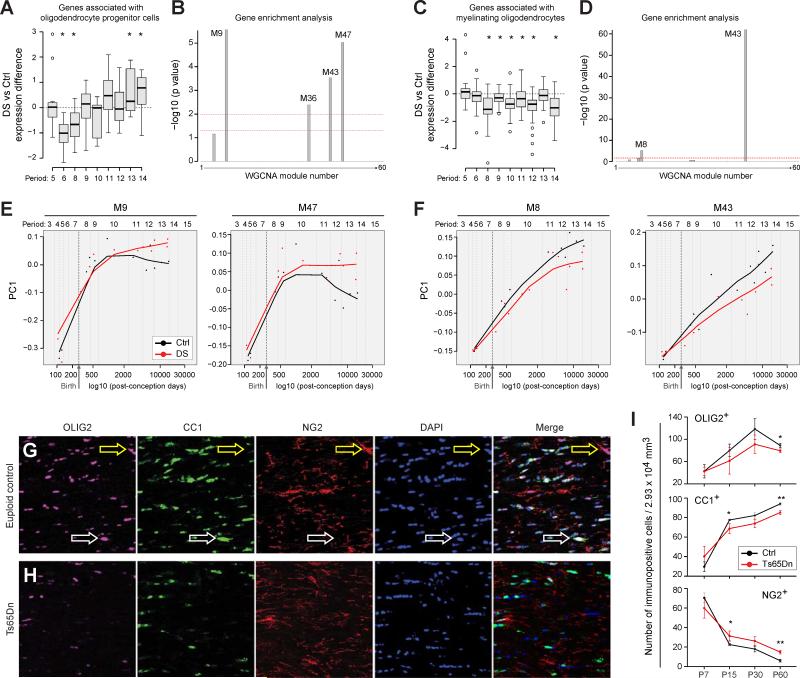
Figure 7. Oligodendrocyte Maturation is Impaired in DS.
(A) Developmental changes in genes associated with oligodendrocyte progenitor cells expressed as ratio of DS vs. Ctrl. *p≤0.05 (paired t-test).
(B) −log10 p-values of expression of oligodendrocyte progenitor cell-enriched genes in weighted gene co-expression network modules reveals significant enrichment in the M9, M36, M43 and M47 modules [y-axis = −log10 (p value)]. Lower dashed line corresponds to p = 0.05; upper dashed line corresponds to p = 0.01.
(C) Developmental changes in genes associated with myelinating oligodendrocytes expressed as ratio of DS vs. Ctrl. *p≤0.05 (paired t-test).
(D) −log10 p-values of enrichment analysis for expression of mature oligodendrocyte enriched genes in gene network co-expression modules demonstrating significant enrichment in modules M8 and M43 [y-axis = −log10 (p value)]. Lower dashed line corresponds to p = 0.05; upper dashed line corresponds to p = 0.01.
(E) PC1 plots of the co-expression modules enriched in oligodendrocyte progenitor cell specific genes (M9 and M47) demonstrating that they are increased in DS and that the differences between Ctrl and DS samples increase over postnatal development.
(F) PC1 plots enriched co-expression modules enriched in specific myelinating oligodendrocyte specific genes (M8 and M43) demonstrating that they are decreased in DS and that the differences between Ctrl and DS samples increase over postnatal development.
(G) Representative immunofluorescent stains of P60 Ctrl corpus callosum for OLIG2 (purple), CC1 (green), NG2 (red), and nuclei (blue). Yellow arrows point to NG2-labeled OPCs and white arrows point to CC1-labeled mature oligodendrocytes.
(H) Representative immunofluorescent stains of P60 Ts65Dn corpus callosum for OLIG2 (purple), CC1 (green), NG2 (red), and nuclei (blue). Fewer CC1-labeled mature oligodendrocytes are apparent.
(I) The numbers of OLIG2 immuno-positive cells in the corpus callosum were counted in image volumes from P7-P60 (n=4 pairs at each age). There was a general trend of fewer OLIG2+ cells in the Ts65Dn white matter which becomes significant at P60. In addition, as a proportion of the total OLIG2+ population, the percentage of NG2+ oligodendrocyte progenitor cells is higher in Ts65Dn corpus callosum from P15-P60. In contrast, the percentage of mature CC1+ oligodendrocytes is reduced in Ts65Dn from P15-P60. *, p≤ 0.05; **, p≤ 0.005.

