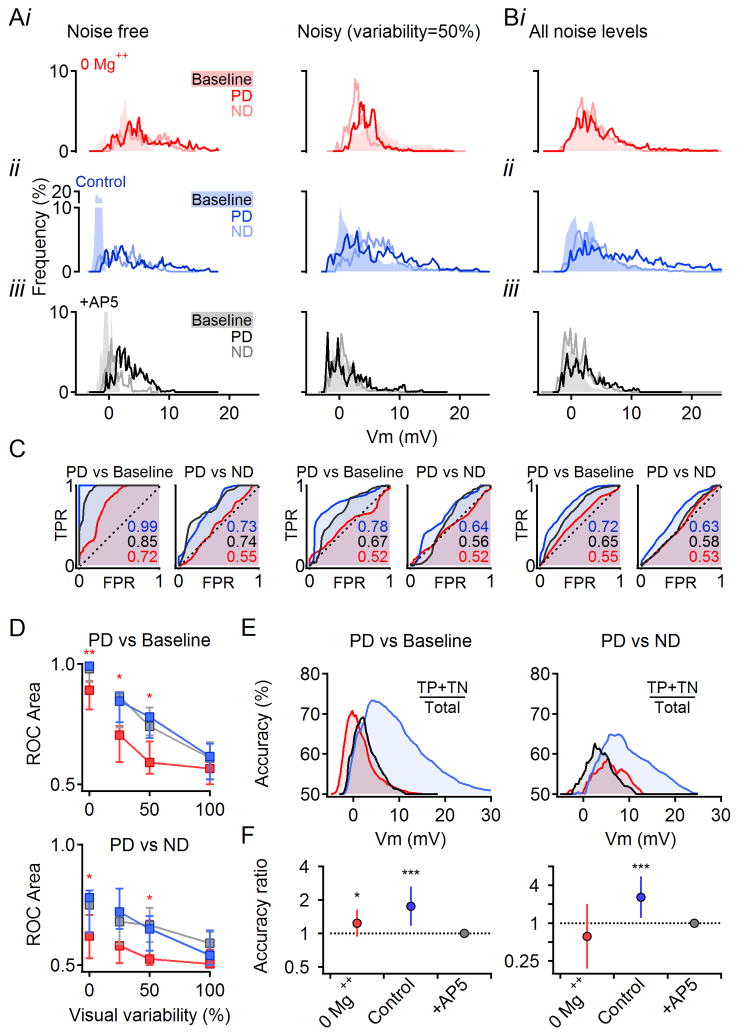
Figure 7. Multiplicative scaling improves subthreshold signal fidelity in noisy visual conditions.
(A) All-points histograms of membrane potentials from the same cell in Figure 6A–D in response to noise-free and noisy visual stimuli. Data collected during baseline (shaded) and responses (PD and ND, solid lines) during the periods indicated in gray in Figure 6A. Color scheme as in Figure 6.
(B) Histograms of membrane potentials from the cell in (A) pooled across all visual noise levels.
(C) ROC analysis of discrimination between signal (PD responses) and baseline or ND histograms shown in (A) and (B). TPR, true positive rate; FPR, false positive rate (see Experimental Procedures). For indistinguishable distributions, the ROC follows the unity line and has an area under the curve of 0.5. For non-overlapping distributions, the ROC reaches the left top corner and has an area under the curve of 1.
(D) Median (± quartile) area under the ROC curve for PD vs. baseline histograms (top) and PD vs. ND (bottom) as a function of the visual noise (*p<0.05,**p<0.01 between 0 Mg++ and other conditions within individual noise levels, n=12, Wilcoxon Signed Rank Test with Bonferroni correction).
(E) Accuracy of discrimination between the PD and baseline (left) and PD and ND (right) at all noise levels (data from B) as a function of the membrane potential (see Experimental Procedures).
(F) Summarized accuracy analysis for discrimination between PD and baseline (left) and PD vs. ND (right) responses recorded at all noise levels (n=12 cells). The area under the accuracy curve in 0 Mg++ and control solutions was normalized to the area in AP5. The resulting accuracy ratio (mean, error bars-99% confidence intervals) is shown on a logarithmic axis (*p<0.05,***p<0.001 different from unity, z-test with Bonferroni correction).

