

Abstract
nonalcoholic fatty liver disease (NAFLD), an obesity and insulin resistance associated clinical condition - ranges from simple steatosis to nonalcoholic steatohepatitis. To model the human condition, a high-fat Western diet that includes liquid sugar consumption has been used in mice. Even though liver pathophysiology has been well characterized in the model, little is known about the metabolic phenotype (e.g., energy expenditure, activity, or food intake). Furthermore, whether the consumption of liquid sugar exacerbates the development of glucose intolerance, insulin resistance, and adipose tissue dysfunction in the model is currently in question. In our study, a high-fat Western diet (HFWD) with liquid sugar [fructose and sucrose (F/S)] induced acute hyperphagia above that observed in HFWD-fed mice, yet without changes in energy expenditure. Liquid sugar (F/S) exacerbated HFWD-induced glucose intolerance and insulin resistance and impaired the storage capacity of epididymal white adipose tissue (eWAT). Hepatic TG, plasma alanine aminotransferase, and normalized liver weight were significantly increased only in HFWD+F/S-fed mice. HFWD+F/S also resulted in increased hepatic fibrosis and elevated collagen 1a2, collagen 3a1, and TGFβ gene expression. Furthermore, HWFD+F/S-fed mice developed more profound eWAT inflammation characterized by adipocyte hypertrophy, macrophage infiltration, a dramatic increase in crown-like structures, and upregulated proinflammatory gene expression. An early hypoxia response in the eWAT led to reduced vascularization and increased fibrosis gene expression in the HFWD+F/S-fed mice. Our results demonstrate that sugary water consumption induces acute hyperphagia, limits adipose tissue expansion, and exacerbates glucose intolerance and insulin resistance, which are associated with NAFLD progression.
Keywords: NASH, fructose, insulin resistance, high-fat Western diet, adipose tissue
obesity is linked to the pathogenesis of nonalcoholic fatty liver disease (NAFLD), from the seemingly benign condition of fatty liver to nonalcoholic steatohepatitis (NASH), which can lead to the more serious clinical conditions of cirrhosis and liver cancer (hepatocarcinoma). The overall prevalence of NASH in the adult US population (8%) matches the prevalence of type 2 diabetes (15). Currently, there are no specific therapeutic treatments for NASH.
Obesity is characterized by expanded adipose tissue. Excessive secretome molecules (adipokines, cytokines, free fatty acids, and other lipid moieties) from adipose tissue may lead to an altered metabolic state with inflammation and insulin resistance and contribute to the progression of NAFLD (28). Evidence for adipose tissue insulin resistance in obese patients with NAFLD suggests that adipose tissue expansion and/or dysfunction plays a role in NAFLD development and progression (8). A tight relationship between the expansion of epididymal white adipose tissue (eWAT) and NAFLD development and progression in mice highly responsive to a high-fat diet support this postulate (6).
To gain insight into the pathogenesis of NASH, obesity-linked overnutrition models have been developed based on a Western diet that is high in animal-derived saturated fats and added sugar in the form of fructose and/or sucrose, which mimics the consumption of sugar in adults (44) and children (29). Fructose, in the presence of a high-fat diet, may exacerbate fat deposition, inflammation, oxidative stress, and fibrosis in the liver but maybe not systemic glucose intolerance and insulin resistance (3, 19, 39). Increased fructose intake has been associated with increased hepatic fibrosis in patients with NAFLD (1). The presence of fibrosis in the liver is an important predictor of adverse long-term outcomes, including diabetes and progression to cirrhosis (7).
The high-fat Western diet-plus-liquid sugar consumption model of obesity in mice was originally developed as a model of NAFLD progression (3, 19, 39) and appears to model obese humans with mild NASH, as recently reported in a thorough analysis of the liver pathophysiology phenotype (21). Yet, it may be a good model for other chronic conditions associated with obesity such as diabetes, cardiovascular disease, and Alzheimer's disease. A greater understanding of factors leading to hepatic and adipose tissue dysfunction in NASH and other obesity-linked conditions represents an important area of investigation, because new therapeutic targets are needed for the treatment of NASH and other obesity-linked conditions. Given the importance of the high-fat Western diet + liquid sugar consumption model of obesity, little is known about the development of metabolic dysfunction in the model. In particular, it is not known whether changes in energy expenditure, activity, or food intake underlie the obese phenotype. Furthermore, whether the consumption of liquid sugar exacerbates the development of glucose intolerance, insulin resistance, and adipose tissue dysfunction in the model is also currently in question. To address these gaps in our knowledge, we investigated pathophysiological parameters, including the energy expenditure, activity, food intake, and glucose and insulin tolerance, together with histological parameters and gene expression from hepatic and adipose tissues in mice fed a low- or high-fat Western diet with or without liquid sugar.
MATERIALS AND METHODS
Animals.
Male C57BL/6NHsd mice from Harlan Laboratories (Somerville, NJ) were housed three per cage in Thoren units in the Bassett Research Institute, an AAALAC accredited animal facility, in 12:12-h light-dark, temperature at 22°C, and humidity-controlled rooms. Mice were provided with standard laboratory chow and water ad libitum in accordance with an Institutional Animal Care and Use Committee approved protocol for 1 wk to allow for acclimatization to the animal facility. No procedures were undertaken that caused more than minimal pain, distress, or discomfort. Mice (n = 8, 6 wk old) were then placed for 2 and 12 wk on a low-fat Western diet (LFWD) (Test Diets, Cat. #5TJS) or a high-fat Western diet (HFWD) (Test Diets, Cat. #5TJN) containing ∼12% and 40% energy from fat, respectively. The composition of fat in the diets was 30% from lard, 30% from butterfat, and 30% from Crisco. Sugar (42 g/l) was added to the drinking water at a ratio of 55% fructose/45% sucrose (F/S) to mice on the LFWD and HFWD. Mice were euthanized by inhalation of CO2. Blood samples were immediately drawn from the caudal vena cava. After clotting at room temperature, the sample was centrifuged at 12,000 g for 15 min at 4°C. The serum was removed and stored frozen at −80°C until tested. Liver and eWAT were excised, weighed, and flash-frozen in liquid nitrogen or fixed in 10% buffered formalin prior to paraffin embedding. A follow-up study was performed using male C57BL/6NHsd mice (n = 8, 6 wk old) from Harlan Laboratories housed one per cage in the Auburn University Veterinary Research Building, an AAALAC accredited animal facility, in 12:12-h light-dark, temperature at 22°C, and humidity-controlled rooms. Mice were provided with standard laboratory chow and water ad libitum in accordance with an Institutional Animal Care and Use Committee approved protocol for 1 wk to allow for acclimatization to the animal facility. The mice were then placed on the LFWD or HFWD with or without sugar (42 g/l) added to the drinking water at a ratio of 55% fructose/45% sucrose (F/S). Indirect calorimetry was performed at 24 h, 2 wk, and 12 wk following a 24-h acclimation to the metabolic cages. Metabolic data were collected over a 48-h period. The mice were then stimulated with insulin at 2 and 12 wk. A second follow-up study was performed using male C57BL/6NHsd mice (n = 8, 6 wk old) from Harlan Laboratories housed one per cage in the Auburn University Veterinary Research Building. The mice were placed on a chow (Teklad Global Rodent Diet 2018) or HFWD with or without sugar (42 g/l) added to the drinking water at a ratio of 55% fructose/45% sucrose (F/S).
Antibodies and immunoblotting.
Polyclonal antibodies to Akt, phospho-Akt (Ser473), phospho-Akt (Thr308), GSK3β, phospho-GSK3β (Ser9), caspase-9 (mouse specific), cleaved caspase-9, caspase-3, cleaved caspase-3 (Asp175), collagen 1, SCD1, and monoclonal antibodies to phospho-JNK (Thr183/Tyr185) were from Cell Signaling Technology (Danvers, MA). Rabbit monoclonal antibodies to p67phox and p91phox (NOX2) were from Epitomics (Burlingame, CA). Polyclonal antibodies to p22phox and p47phox were from EMD Millipore (Billerica, MA). A polyclonal antibody to adiponectin was from Abcam (Cambridge, MA). Monoclonal antibodies to α-tubulin were from Sigma (St. Louis, MO). Goat anti-mouse and anti-rabbit peroxidase-conjugated antibodies were from Sigma. Goat anti-rabbit and anti-mouse Alexa fluor 635-conjugated secondary antibodies were from Molecular Probes/Invitrogen (Carlsbad, CA). Goat anti-rabbit and anti-mouse IRDye 650- and IRDye 800-conjugated secondary antibodies were from Li-Cor (Lincoln, NE).
Glucose and insulin tolerance tests and insulin stimulation.
A blood sample was drawn from the tail veins of conscious mice for measurements of serum glucose using a FreeStyle FLASH glucometer and strips. Animals were fasted overnight, and a glucose tolerance test (GTT) was performed using 2 g glucose/kg body wt, administered by intraperitoneal injection. Glucose readings were taken at baseline (time = 0) and at 15, 30, 60, and 120 min after injection. One week after the GTT, an insulin tolerance test (ITT) was conducted using Novolin R human insulin at 0.85 U/kg body wt administered by intraperitoneal injection. Animals were fasted (5 h), and serum glucose was tested by tail vein at baseline (time = 0) and at 30, 45, 60, and 90 min after injection. The rate constant for glucose disappearance (KITT) was calculated using the formula 0.693/t1/2. The glucose t1/2 was calculated from the slope of the least square analysis of the plasma glucose concentration during the linear decay phase. Insulin stimulation was performed in mice fasted overnight and then anesthetized with 2.5% isoflurane gas. Following opening of the abdominal cavity, insulin (12 mU/g) or sterile phosphate-buffered saline (PBS) was injected into the inferior vena cava, and then the liver and eWAT were harvested after 2 and 4 min, respectively, and then flash-frozen in liquid N2.
Metabolic phenotyping and food intake.
Energy expenditure was assessed by indirect calorimetry using a computer controlled system (PromethionM; Sable Systems, Las Vegas, NV). The calorimetry system consists of eight metabolic cages, which are essentially identical to home cages with bedding. Each cage was equipped with water bottles and food hoppers connected to load cells (MM-1, Sable Systems) for food and water intake monitoring. All mice had ad libitum access to food and water throughout the study.
Respiratory gases were measured with an integrated fuel cell oxygen analyzer, spectrophotometric CO2 analyzer, and capacitive water vapor partial pressure analyzer (GA3m1, Sable Systems). Gas sensors were calibrated prior to each run with 100% N2 as zero reference and with a span gas containing a known concentrations of 0.993% CO2 with balance N2 (AirGas, Opelika, AL). The PromethionM system utilizes a pull-mode, negative pressure system. The multichannel mass flow generator measures and controls air flow (FR8-1, Sable Systems). The in-current flow rate was set at 2,000 ml/min. Water vapor was continuously measured, and its dilution effect on O2 and CO2 was compensated for mathematically in the analysis stream (20). Oxygen consumption (V̇o2) and CO2 production (V̇co2) were measured for each mouse at 7-min intervals for 1 min. Air reference values are determined after measuring every four cages. Respiratory quotient (RQ) was calculated as the ratio of V̇co2over V̇o2. Energy expenditure was calculated using the Weir equation (42):
kcal/h = 60 × (0.003941 × V̇o2 + 0.001106 × V̇co2).
Activity (ambulatory) was detected with XYZ beam arrays (BXYZ-R, Sable Systems) with a beam spacing of 0.25 cm. To assess activity, consecutive adjacent infrared beam breaks (X, Y, and Z) were scored as an activity count. Data acquisition and system control were coordinated using MetaScreen v. 2.2.8, and the obtained raw data were processed using ExpeData v. 1.8.2 (Sable Systems). The following data analysis scripts (macros) were used for data transformation: Macro 4, data summarized by circadian cycle (6 AM to 6 PM day) and Macro 13, combined metabolic uptake, and activity data acquired from each animal every 8 min.
The changes in weight of the food hoppers in the metabolic cages were not used to assess food uptake due to the observation that mice fed the HFWD consistently pulled food out of the hopper. Therefore, food uptake was assessed by manually weighing the food at 6 AM and 6 PM.
Liver tissue histological and lipid analysis.
Paraffin-embedded sections were stained with hematoxylin and eosin and Masson's trichrome, examined in a blinded fashion by a board certified pathologist, and then graded for steatosis by determining the overall percentage of liver parenchyma containing lipid vacuoles, with 0 = none, 1 = mild (<30%), 2 = moderate (30–60%), and 3 = marked (>60%). Inflammation was graded by the presence or absence of inflammatory cells, with 0 = absent, 1 = minimal or focal occasional single clusters of inflammatory cells present in a few microscopic fields, 2 = mild inflammation, 3 = moderate inflammation, and 4 = marked inflammation. The pattern of fibrosis was graded with 0 = none, 1 = portal fibrosis, 2 = periportal fibrosis or rare septa, 3 = septal fibrosis and architectural distortion but not true cirrhosis, and 4 = cirrhosis, widespread fibrosis, and hepatocyte nodule formation. TGs were assayed using a kit from Thermo Scientific (Rockford, IL) and normalized to the protein content measured using the BCA protein assay reagent (Thermo Scientific/Pierce, Rockford, IL).
Adipose tissue histological and CLS enumeration.
Paraffin-embedded sections were stained with hematoxylin and eosin and examined in a blinded fashion by a board-certified pathologist. Crown-like structures (CLS) were defined as shrunken adipocytes completely surrounded by morphologically identified macrophages and were counted on hematoxylin and eosin stained slides. Macrophage identification was verified with F4/80 cytoplasmic staining in step sections using rat anti-mouse F4/80 antibody (Abd Serotec, Raleigh, NC; Clone CI:A3-1) with Rodent Block M (BioCare Medical, Concord, CA) to reduce nonspecific staining. The entire surface area of each fat pad was counted to provide a total number of CLS per fat pad.
Adipocyte area.
Slides were scanned using the Aperio ScanScope scanner (Vista, CA) and evaluated on VisioPharm software (Hoersholm, Denmark). Briefly, the entire adipocyte section was evaluated at 20× increments, using the following rules, to identify and measure adipocyte area. Objects were identified and counted as adipocytes if 1) the area was between 500 and 20,000 μm, and 2) it had a shape factor of 0–0.7, where a shape factor of 1 indicates a straight line and 0 indicates a perfect circle. Approximately 80–90% of the adipocytes were counted for each section.
Liver oxidative stress analysis.
Liver samples were flash-frozen and ground in liquid nitrogen. Ground tissue (50–100 mg) was homogenized on ice in PBS pH 7.4 buffer. 4-Hydroxy-2-nonenal (4-HNE) staining was performed using a 4-HNE (HNE11-S) antibody (Alpha Diagnostics, San Antonio, TX). Five random fields per slide were scored, and the results were determined from an average of those scores. NADPH oxidase activity was measured by the lucigenin enhanced chemiluminescence method. Briefly, 50 μg of membrane protein fractionated from frozen liver was added to Krebs-Ringer buffer, pH 7.0, containing 1 mM EGTA, 150 mM sucrose, 5 μM lucigenin, and 100 μM NADPH. Photon emission in terms of relative light units was measured in a luminometer every 30 s for 5 min. There was no measurable activity in the absence of NADPH. Superoxide anion production was expressed as relative chemiluminescence (light) units (RLU)/mg protein. Protein content was measured using the BCA protein assay reagent (Thermo Scientific-Pierce, Rockford, IL).
Alanine aminotransferase assay.
The Alanine Aminotransferase-SL Assay (Genzyme Diagnostics) was performed in 96-well plates. The change in absorbance at 340 nm at 37°C was monitored over 12 min using a Molecular Devices Spectramax spectrophotometer and SOFTmax PRO software. Alanine aminotransferase (ALT) was calculated as units/liter using the manufacturer's formula and molar extinction coefficient of NADH. Protein content was determined by the BCA assay. ALT (U/l) was normalized to protein concentration.
Apoptosis analysis.
TUNEL-positive cells were detected using the DeadEnd Fluorometric TUNEL system (Promega, Madison, WI) and the manufacturer's recommendations for controls. Propidium iodide (0.25 mg/ml) was used as the counterstain. An average score was generated based on a ratio of positive nuclei to total nuclei in 3 random fields at ×200 magnification.
Measurement of SOD activity.
Total SOD activity was measured by determining the ability to inhibit the auto-oxidation of pyrogallol using the method described by Marklund and Marklund (23). The rate of auto-oxidation was determined by measuring increases in the absorbance at 420 nm. Reaction mixture containing 0.2 mM pyrogallol in 50 mM Tris-cacodylic acid buffer (pH 8.5) and 1 mM diethylenetriamine pentaacetic acid was incubated for 3 min at 25°C. One unit of SOD activity was defined as the amount of the enzyme required to inhibit the rate of pyrogallol auto-oxidation by 50%. SOD activity was expressed as a unit activity per milligram of protein.
Subcellular fractionation.
Frozen liver tissue was ground with mortar and pestle in liquid N2, and then 100–150 mg ground-frozen tissue was placed in a 1.5-ml homogenization buffer containing 10 mM Tris (pH 7.4), 20 mM sucrose, 0.1 mM Na3VO4, 100 nM okadaic acid, and 1× protease inhibitor cocktail Set I (Calbiochem/EMD Biosciences, La Jolla, CA) and then precleared by centrifugation at 250 g for 5 min at 4°C. Precleared tissue was homogenized by passage through a 25-gauge needle 7–8× on ice in buffer. Homogenates were centrifuged at 100,000 g for 30 min at 4°C. The supernatant was removed and designated as the cytosolic fraction. The pellet was resuspended in a buffer containing 10 mM Tris (pH 7.4), 2 mM NaCl, 1% Triton X-100, 0.1 mM Na3VO4, 100 nM okadaic acid, and 1× protease inhibitor cocktail (Pierce), incubated on ice for 30 min, and then centrifuged at 100,000 g for 30 min at 4°C. The resultant supernatant was transferred to a fresh tube and designated as the Triton-soluble (membrane) fraction.
Western blot analysis.
Tissue was lysed with 50 mM HEPES, pH 7.5, 150 mM NaCl, 1% Nonidet P-40, 0.1% SDS, 0.1% sodium deoxycholate, 1 mM NA3VO4, 100 nM okadaic acid, and 1× protease inhibitor mixture Set I. Cellular debris was removed by centrifugation at 15,000 rpm for 15 min at 4°C. Protein content of the clarified lysate was determined using bicinchoninic acid (BCA) reagents from Thermo Scientific (Rockford, IL). Isolated proteins were denatured in SDS gel buffer, separated by SDS-PAGE, and immunoblotted. Enhanced chemiluminescence substrate was from GE Healthcare (Piscataway, NJ). Goat anti-rabbit and anti-mouse Alexa fluor 635, horseradish peroxidase-conjugated, IRDye680, and IRDye 800 secondary antibodies were used for detection and quantitation of immunoblots. Membranes were imaged using a Storm PhosphoImager (GE Healthcare) or LiCor Odyssey scanner, and blots were analyzed by Image Studio 2.0 analytical software (LiCor, Lincoln, NE).
RNA isolation and qRT-PCR.
TRIzol reagent (Sigma-Aldrich, St. Louis, MO) was used to isolate total RNA from frozen tissue. RNA quantity and quality were assessed using a bioanalyzer (Agilent 2100 Bioanalyze; Agilent Technologies, Santa Clara, CA) prior to reverse transcription using the RT2 First Strand Kit (Qiagen, Valencia, CA). PCR was performed in 384-well plates with the RT2 SYBR Green ROX qPCR Mastermix (Qiagen, Valencia, CA) with gene-specific primers (SABiosciences, Fredrick, MD) using an Applied Biosystems 7900HT Sequence Detection System (Life Technologies, Carlsbad, CA) with a Corbett Robotics CAS-1200 precision liquid handling system for plate set-up. Melting curve analysis was performed to verify product purity. A threshold value of 0.02 was used for the analysis of gene expression. GAPDH was used to normalize ΔCt values.
Statistical analysis.
Chemiluminescent and fluorescent signals were directly quantitated using Storm 860 Imager and ImageQuant v. 5.1 software. The absolute integration value of the immunoreactive bands minus background was determined. Statistical significance of gene expression data was analyzed by Student's t-test (α = 0.05) using the LFWD group as a control. Statistical significance between groups was determined by one-way repeated-measures analysis of variance (α = 0.05) using the XLSTAT 2009 program (Addinsoft, New York, NY). Pairwise comparisons were made using the Newman-Keuls test (α = 0.05). Statistical significance of frequency distributions was determined by Kolmogorov-Smirnov test (α = 0.05) using the XLSTAT 2009 program (Addinsoft, New York, NY). Analysis of covariance (ANCOVA) comparison tests were used to test if the slopes of the adipocyte area vs. eWAT weight lines differed significantly or not (α = 0.05) using the XLSTAT 2009 program (Addinsoft). Statistical significance of the impact of body weight as a covariate on energy expenditure was analyzed by ANCOVA (α = 0.05) using the Mouse Metabolic Phenotyping Centers Energy Expenditure Analysis web page (16).
RESULTS
Effects of diets on body and organ weight and serum metabolites.
C57Bl/6N mice aged 6 wk were placed on a LFWD or HFWD with or without 42 g/l F/S in the drinking water for up to 12 wk. The LFWD group served as the control group. The characteristics of mice at the age of 2 and 12 wk are shown in Table 1. Mice fed the HFWD+F/S gained the most weight at 2 and 12 wk (P < 0.05). A significant 67% increase in liver weight normalized to body weight from 2 to 12 wk was observed in the HFWD+F/S group compared with <10% in the other groups (P < 0.05). Consistent with these results, a disease marker of hepatocyte damage, ALT, was greatest in mice from the HFWD+F/S group at 12 wk (P < 0.05). We also found that eWAT weight normalized to body weight at 2 wk was markedly higher in the HFWD+F/S group (P < 0.05). However, the greatest increase (132%) in normalized eWAT weight from 2 to 12 wk was observed in the HFWD group, whereas, surprisingly, an 11% decrease was observed in the HFWD+F/S group. Serum glucose was significantly elevated in the HFWD-fed mice at 2 wk but surprisingly along with HFWD+F/S-fed mice not at 12 wk. The lack of an effect of high fat or sucrose feeding on serum glucose has been reported by others in C57Bl/6 mice (35, 38), although this phenomenon is not consistently observed. Unlike serum levels of glucose and TGs, serum levels of insulin were significantly higher in the HFWD+F/S group compared with all the other groups at both the 2- and 12-wk time points (P < 0.05). Taken together, these data indicated that, compared with HFWD-fed mice, HFWD+F/S-fed mice have significantly greater body weight and normalized liver weight with greater liver hepatocyte damage yet limited eWAT expansion.
Table 1.
Body and organ weights, serum parameters, and insulin sensitivity measurements in mice
| LFWD | HFWD | LFWD+F/S | HFWD+F/S | |
|---|---|---|---|---|
| Weights | ||||
| Whole body | ||||
| 2 wk | 25.2 ± 0.3a | 27.3 ± 1.1b | 28.2 ± 0.7b | 33.5 ± 0.8c |
| 12 wk | 32.3 ± 0.6a | 37.0 ± 1.3b | 33.6 ± 0.8a | 46.4 ± 1.1c |
| Liver (g) | ||||
| 2 wk | 1.19 ± 0.06ab | 1.13 ± 0.08a | 1.18 ± 0.04ab | 1.41 ± 0.04b |
| 12 wk | 1.48 ± 0.06a | 1.55 ± 0.11a | 1.50 ± 0.10a | 3.09 ± 0.20b |
| eWAT (g) | ||||
| 2 wk | 0.48 ± 0.04a | 0.75 ± 0.13b | 0.77 ± 0.11b | 1.50 ± 0.10c |
| 12 wk | 1.17 ± 0.14a | 2.31 ± 0.11b | 1.43 ± 0.18a | 1.83 ± 0.11c |
| Liver/body wt | ||||
| 2 wk | 0.047 ± 0.002 | 0.041 ± 0.001 | 0.042 ± 0.001 | 0.042 ± 0.001 |
| 12 wk | 0.046 ± 0.001a | 0.042 ± 0.002a | 0.044 ± 0.002a | 0.070 ± 0.002b |
| eWAT/body wt | ||||
| 2 wk | 0.019 ± 0.001a | 0.027 ± 0.004a | 0.027 ± 0.004a | 0.045 ± 0.002b |
| 12 wk | 0.036 ± 0.004a | 0.062 ± 0.002b | 0.042 ± 0.004a | 0.040 ± 0.003a |
| Serum parameters | ||||
| Glucose, mg/dl | ||||
| 2 wk | 180 ± 5a | 203 ± 12b | 140 ± 9c | 166 ± 7a |
| 12 wk | 205 ± 8a | 136 ± 3b | 154 ± 5b | 147 ± 9b |
| TG, mg/mg protein | ||||
| 2 wk | 37.5 ± 2.3 | 39.3 ± 3.6 | 28.9 ± 3.2 | 36.8 ± 2.6 |
| 12 wk | 38.4 ± 3.4 | 38.3 ± 2.7 | 41.1 ± 4.0 | 52.6 ± 8.9 |
| Insulin, ng/ml | ||||
| 2 wk | 1.52 ± 0.15a | 1.54 ± 0.22a | 1.66 ± 0.43a | 3.27 ± 0.46b |
| 12 wk | 2.15 ± 0.50a | 2.54 ± 0.56a | 1.69 ± 0.24a | 5.15 ± 1.41b |
| ALT, U/mg protein | ||||
| 2 wk | 24.5 ± 5.6 | 32.3 ± 7.0 | 16.6 ± 3.0 | 24.7 ± 3.5 |
| 12 wk | 28.1 ± 3.8a | 37.2 ± 12.2a | 42.7 ± 13.0a | 130.6 ± 12.3b |
| Quicki | ||||
| 2 wk | 0.393 ± 0.008ab | 0.390 ± 0.014ab | 0.425 ± 0.022a | 0.364 ± 0.012b |
| 12 wk | 0.366 ± 0.010ab | 0.390 ± 0.013a | 0.390 ± 0.008a | 0.330 ± 0.014b |
| Food intake, kcal/day | ||||
| Food | ||||
| 2 wk | 13.11 ± 0.43a | 14.56 ± 0.45b | 12.14 ± 0.53a | 14.89 ± 0.54b |
| 12 wk | 16.67 ± 0.34a | 14.89 ± 0.79a | 11.48 ± 0.22b | 16.45 ± 0.97a |
| Water | ||||
| 2 wk | 2.22 ± 0.07a | 2.13 ± 0.12a | 3.45 ± 0.16b | 2.50 ± 0.25a |
| 12 wk | 2.14 ± 0.06a | 1.65 ± 0.18b | 4.38 ± 0.21c | 2.60 ± 0.19a |
| Water | ||||
| 2 wk | 0.00 ± 0.00a | 0.00 ± 0.00a | 0.58 ± 0.03b | 0.42 ± 0.04c |
| 12 wk | 0.00 ± 0.00a | 0.00 ± 0.00a | 0.74 ± 0.04b | 0.44 ± 0.03c |
| Total | ||||
| 2 wk | 13.11 ± 0.43a | 14.56 ± 0.45b | 12.72 ± 0.53a | 15.31 ± 0.55b |
| 12 wk | 16.67 ± 0.34a | 14.89 ± 0.79a | 12.22 ± 0.23b | 16.89 ± 0.95a |
Values represent means ± SE; n = 5–10.
LFWD, low-fat Western diet; HFWD,high -fat Western diet; F/S, sugary drink of fructose and sucrose; ALT, alanine aminotransferase; TG, triglyceride.
Data were analyzed by ANOVA, and pairwise comparisons were made using Newman-Keuls test. Different letters indicate significantly different values at P < 0.05.
Effects of diets on energy expenditure, substrate utilization, activity, and food intake.
To gain insight into the weight gain observed in the groups, 24-h total energy intake was first assessed in group-housed mice. The HFWD- and HFWD+F/S-fed mice consumed more total calories per day than the other two groups at 2 wk (Table 1). There was no difference in 24-h total energy intake between LFWD-, HFWD-, and HFWD+F/S-fed mice at 12 wk. Interestingly, water consumption was greatest in the LFWD+F/S group at 2 and 12 wk. Next, the metabolic phenotype was assessed at 2 and 12 wk. Circadian energy expenditure, activity, and food consumption were determined using metabolic cages. At 2 wk, no significant differences were observed in total energy expenditure between the diet treatments in the day and night phases (Fig. 1A left). Furthermore, no differences in total energy expenditure between the HFWD and HFWD+F/S groups in the day and night phases were observed when analyzed by ANCOVA (data not shown). Total energy expenditure was also not significantly different from the day to the night phase for the LFWD and HFWD groups. In contrast, total energy expenditure was significantly elevated between the day and night phases for the LFWD+F/S and HFWD+F/S groups. Total activity was not significantly different between the diet treatments in the day and night phases (Fig. 1A right). To examine the changes in energy expenditure, substrate utilization, and activity over a 24-h period at 2 wk, metabolic cage data were analyzed every 8 min for the 24-h period. As shown in Fig. 1C (top left and right), no statistical differences were observed in average energy expenditure between the LFWD and LFWD+F/S groups, whereas in the comparison between the HFWD and HFWD+F/S groups average energy expenditure was elevated in the mid-night phase in the HFWD+F/S group. No statistical differences were observed in average substrate utilization between the LFWD and LFWD+F/S groups or the HFWD and HFWD+F/S groups (Fig. 1C middle, left and right). Statistical differences in activity (pedestrian meters) traveled between the LFWD and LFWD+F/S groups were observed in the night phase, with the mice in the LFWD+F/S group showing more activity, although LFWD-fed mice were also observed in the day and night phases to have significantly increased activity (Fig. 1C bottom left). In contrast, HFWD+F/S-fed mice were more significantly active at 10 different time points in the night phase compared with the HFWD-fed mice (Fig. 1C bottom right).
Fig. 1.

Metabolic phenotype at 2 wk. A: mean ± SE circadian analysis of total energy expenditure (Tot_EE) (left) and total activity (right) for day and night phases over a 48-h period in mice fed low-fat Western diet (LFWD), high-fat Western diet (HFWD), LFWD+F/S (sugary drink - fructose and sucrose), or HFWD+F/S. B: circadian analysis of food intake in chow, HFWD, and HFWD+F/S groups. A and B: different letters indicate significantly different values at P < 0.05. C: means ± SE of average energy expenditure (Avg_EE), average respiratory quotient (Avg_RQ), and pedestrian meters (Ped_meters) every 8 min during the 24-h period for LFWD vs. LFWD+F/S (left) and HFWD vs. HFWD+F/S (right) groups. Black stars, significant increases (P < 0.05) in LFWD and HFWD groups over LFWD+F/S and HFWD+F/S groups (left and right, respectively); gray stars, significant increases (P < 0.05) in LFWD+F/S and HFWD+F/S groups over LFWD and HFWD groups (left and right, respectively).
Circadian assessment of food intake, feeding bouts, and rate of food intake indicated that HFWD+F/S-fed mice consumed a great amount of food in the day and night phases at 2 wk (data not shown). However, because mice removed the HFWD from the food hopper in the metabolic cages (data not shown), accurate circadian food intake was not possible in the metabolic cages. Therefore to examine circadian food intake, an independent study was performed in which the food from chow-, HFWD-, and HFWD+F/S-fed mice was manually measured at zeitgeber time 0 (ZT0) and ZT12 in singly housed mice. As shown in Fig. 1B, HFWD+F/S-fed mice, but not HFWD-fed mice, consumed a significantly greater amount of food than the chow-fed mice during the day phase at 2 wk. Food uptake in the HFWD+F/S group was also significantly elevated in the night phase compared with HFWD-fed mice. Thus, our data suggest that consumption of sugary water in singly housed HFWD-fed mice results in hyperphagia independently of changes in energy expenditure.
Circadian analysis of mice fed the diets for 12 wk revealed that total energy expenditure in the day phase was significantly elevated in the HFWD and HFWD+F/S groups compared with LFWD and LFWD+F/S fed mice (Fig. 2A left and right). Consistently, no statistical differences were observed in average energy expenditure and substrate utilization during the day phase for metabolic cage data that were analyzed every 8 min (Fig. 2C top and middle, left and right). In the night phase, total energy expenditure was also significantly elevated in the HFWD and HFWD+F/S mice compared with LFWD- and LFWD+F/S-fed mice (Fig. 2A left). In contrast, total activity was significantly reduced in the HFWD- and HFWD+F/S-fed mice (Fig. 2A right). Analysis of pedestrian meters traveled revealed that LFWD+F/S-fed mice had a greater number of significantly elevated events compared with LFWD-fed mice (Fig. 2C bottom left). In contrast, HFWD-fed mice had a greater number of significantly elevated pedestrian meters events than HFWD+F/S fed mice (Fig. 2C bottom right). No difference in food uptake was observed in the day phase between chow-, HFWD-, and HFWD+F/S-fed mice, whereas, in contrast, chow-fed mice consumed more food than HFWD- and HFWD+F/S-fed mice in the night phase (Fig. 2B). Our data suggest that consumption of sugary drinking water differentially effects activity in longer-term LFWD- and HFWD-fed mice.
Fig. 2.

Metabolic phenotype at 12 wk. A. Mean ± SE circadian analysis of total energy expenditure (Tot_EE) (left) and total activity (right) for day and night phases over a 48-hperiod in mice fed LFWD, HFWD, LFWD+F/S, or HFWD+F/S. B: circadian analysis of food intake in chow, HFWD, and HFWD+F/S groups. A and B: different letters indicate significantly different values at P < 0.05. C: means ± SE of Avg_EE, Avg_RQ, and Ped_meters every 8 min during the 24-h period for LFWD vs. LFWD+F/S (left) and HFWD vs. HFWD+F/S (right) groups. Black stars, significant increases (P < 0.05) in LFWD and HFWD groups over LFWD+F/S and HFWD+FS groups (left and right, respectively); gray stars, significant increases (P < 0.05) in LFWD+F/S and HFWD+FS groups over LFWD and HFWD groups (left and right, respectively).
Changes in food uptake but not total energy expenditure and total activity at 2 wk suggest an early hyperphagic response in the HFWD-fed mice consuming sugary drinking water. To examine whether the hyperphagic response was acute, manual food uptake was determined in the first 24 h following the change to the HFWD and HFWD+F/S treatments. As shown in Fig. 3B, food intake in the day phase but not the night phase in the HFWD+F/S-fed group was significantly elevated compared with the chow- and HFWD-fed groups. Circadian total energy expenditure and activity were also assessed over the 24-h period following the change in the diets. As shown in Fig. 3, A and B, there were no significant differences between diet treatment groups in the day and night phases for total energy expenditure and activity.
Fig. 3.

Metabolic phenotype after 24 h on the diets. A: mean + SE circadian analysis of Tot_EE (left) and total activity (right) for day and night phases over a 24-period in mice fed LFWD, HFWD, LFWD+F/S, or HFWD+F/S. B: circadian analysis of food intake in chow, HFWD, and HFWD+F/S groups. A and B: different letters indicate significantly different values at P < 0.05. C: means + SE of Avg_EE, Avg_RQ, and Ped_meters every 8 min during the 48-h period for LFWD vs. LFWD+F/S (left) and HFWD vs. HFWD+F/S (right) groups. Black stars, significant increases (P < 0.05) in LFWD and HFWD groups over LFWD+F/S and HFWD+F/S groups (left and right, respectively); gray stars, significant increases (P < 0.05) in LFWD+F/S and HFWD+FS groups over LFWD and HFWD groups (left and right, respectively).
Analysis of average energy expenditure every 8 min over a 48-h period following the change in the diets revealed few significant events when LFWD and LFWD+F/S groups were compared (Fig. 3C top left) and HFWD and HFWD+F/S groups were compared (Fig. 3C top right). In contrast, significant reductions were observed in the night phase for RQ in LFWD+F/S-fed mice compared with LFWD-fed mice, whereas RQ in the second day phase following the change in the diets was significantly elevated in the LFWD+F/S-fed mice compared with LFWD-fed treatments (Fig. 3C middle left). No significant changes in RQ were observed between the HFWD and HFWD+F/S treatments (Fig. 3C middle right). However, more significant pedestrian meter events in the day and night phases were observed in HFWD-fed mice compared with HFWD+F/S-fed mice. These data suggest an early direct effect of liquid F/S consumption on RQ in LFWD-fed mice and food intake and activity independent of energy expenditure in HFWD-fed mice.
Effects of diets on glucose tolerance, insulin resistance, and insulin signaling.
To further explore metabolic changes associated with the consumption of sugary water in LFWD- and HFWD-fed mice, we performed a glucose tolerance test (GTT) and an insulin tolerance test (ITT) at 2 and 12 wk to assess glucose tolerance and insulin resistance, respectively. Fasting glucose and insulin levels were used to assess insulin sensitivity by using the Quicki score. The GTT performed at 2 wk demonstrated that only mice in the HFWD+F/S group displayed glucose intolerance (Fig. 4, A and C), whereas both HFWD- and HFWD+F/S-fed mice exhibited glucose intolerance at 12 wk (Fig. 4, B and D). The ITT at 2 wk demonstrated that the insulin-mediated reduction in blood glucose was significantly different only at the 45-min time point between the HFWD+F/S group and the LFWD and LFWD+F/S groups (Fig. 4E). However, no differences were detected in the glucose disappearance rates (KITT; Fig. 4G) and Quicki score (Table 1). In contrast, the ITT at 12 wk indicated that insulin resistance was greatest in the HFWD+F/S group as reflected by reduced KITT value compared with other groups (Fig. 4, F and H), and the Quicki score demonstrated that HFWD+F/S-fed mice were less insulin sensitive than HFWD-fed mice (Table 1). To confirm and expand our findings on insulin resistance, we stimulated mice with insulin at 2 and 12 wk to assess activation of insulin signaling proteins in liver and adipose tissue. As shown in Fig. 5, mice from all diet treatment groups at 2 wk were responsive to insulin. However, we detected a significant reduction in hepatic and adipose phospho-Akt at Ser473 and Thr308 phosphorylation in the HFWD+F/S group compared with all other diet treatment groups (Fig. 5, A and B, top right). HFWD+F/S-fed mice also had a significantly lower level of phospho-GSK3β-Ser9 in liver but not adipose tissue compared with the other groups (Fig. 5, A and B, bottom right). Insulin stimulation at 12 wk indicated that hepatic Akt-Ser473, Akt-Thr308, and GSK3β-Ser9 phosphorylations were significantly increased upon insulin stimulation in all the diet groups (Fig. 6A); however, they were blunted by the addition of sugary water in LFWD- and HFWD-fed mice (Fig. 6A). Consistent with our ITT data, we observed the lowest level of insulin stimulated Akt-Ser473, Akt-Thr308, and GSK3β-Ser9 in the liver from mice in the HFWD+F/S group (Fig. 6A). Furthermore, insulin failed to stimulate adipose Akt-Ser473, Akt-Thr308, and GSK3β-Ser9 phosphorylations in HFWD+F/S-fed mice (Fig. 6B). Taken together, our data indicated that consumption of sugary water accelerates HFWD-induced glucose intolerance and exacerbates HFWD-induced insulin resistance in mice.
Fig. 4.

Glucose and insulin tolerance. A and B: mean glucose concentration in GTT curves at 2 wk (A) and 12 wk (B). C and D: means ± SE of area under the curve (AUC) calculated for each GTT curve at 2 wk (C) and 12 wk (D). E and F: %reduction in mean glucose concentration in ITT curves at 2 wk (E) and 12 wk (F). G and H: means ± SE of plasma glucose disappearance rate (KITT) during ITT at 2 wk (G) and 12 wk (H). Different letters indicate significantly different values at P < 0.05. *Significantly different value at P < 0.05 in HF+S group over LF and LF+S groups.
Fig. 5.

Hepatic and adipose insulin signaling at 2 wk. A and B: insulin-stimulated hepatic Akt Ser473 (S473), Akt Thr308 (T308), and GSK3β Ser9 (pGSK3β) phosphorylation, total Akt, and GSK3β representative blots (A) and means ± SE (B) of insulin-stimulated LFWD-fed mice. C and D: insulin-stimulated adipose AktS473, AktT308, and GSK3β phosphorylation, total Akt, and GSK3β representative blots (C) and means ± SE (D) of insulin-stimulated LFWD-fed mice. AktS473 and -T308 phosphorylations were normalized to total Akt; GSK3β phosphorylation was normalized to total GSK. Different letters indicate significantly different values at P < 0.05.
Fig. 6.

Hepatic and adipose insulin signaling at 12 wk. A and B: insulin-stimulated hepatic AktS473, AktT308, and GSK3β pGSK3β phosphorylation, total Akt, and GSK3β representative blots (A) and means ± SE (B) of insulinstimulated LFWD-fed mice. C and D: insulin-stimulated adipose AktS473, AktT308, and GSK3β phosphorylation, total Akt, and GSK3β representative blots (C) and - means ± SE (D) of insulin-stimulated LFWD-fed mice. AktSer473 and -T308 phosphorylations were normalized to total Akt; GSK3β phosphorylation was normalized to total GSK. Different letters indicate significantly different values at P < 0.05.
Effects of diets on the hepatic gene expression.
Our observation that consumption of sugary water differentially effected normalized liver weight, glucose tolerance, and insulin resistance suggested a hepatic effect of sugary water consumption. Thus, we examined the temporal changes in expression of hepatic genes regulating lipid metabolism, inflammation, oxidative stress, apoptosis, cell cycle, and fibrosis using quantitative (q)PCR. The hepatic genes were chosen based on major pathological changes observed in NAFLD. To visualize only significant changes to the expression of the genes compared with the LFWD group, we constructed a Venn diagram (Fig. 7A left), and fold changes and P values can be found in Supplemental Table S1 (supplemental material can be found in the online version of this article). Individual lipid metabolism genes were differentially regulated across the groups at 2 wk; however, a small set (8/62) overlapped between the LFWD+F/S, HFWD, and HFWD+F/S groups. We observed that significant reductions in the expression of genes regulating apoptosis occurred in all the diet groups (Fig. 7A left, and Supplemental Table S1). For genes regulating cell cycle and oxidative stress, no consistent changes to expression were observed across the treatment groups (Fig. 7A left, and Supplemental Table S1). Noticeably, the expressions of genes regulating inflammation were not significantly changed in any of the treatment groups at 2 wk (Supplemental Table S1).
Fig. 7.

Hepatic gene expression, steatosis, triglyceride accumulation and inflammation. A: hepatic gene expression determined by qRT-PCR at 2 and 12 wk. Arrows indicate significant differences in expression vs. LFWD-fed mice at each time point (red and blue texts represent >2-fold increases and decreases, respectively). B: hematoxylin and eosin (H&E)-stained liver sections at 2 and 12 wk. C: steatosis scoring of H&E-stained liver sections at 2 and 12 wk. D: quantitation of hepatic triglyceride content is shown as means ± SE at 2 and 12 wk. E: inflammation scoring of H&E-stained liver sections is shown as mean ± SE at 2 and 12 wk. F: phospho-JNK and α-tubulin expression at 12 wk. Shown are representative blot and quantitation of protein expression (means ± SE) of phospho-JNK normalized to α-tubulin. Different letters indicate significantly different values at P < 0.05.
We next investigated the change in expression of the same hepatic genes at 12 wk. Again, a Venn diagram was constructed to represent only significant changes to the expression of genes compared with the LFWD group (Fig. 7A right). Analysis of genes regulating lipid metabolism revealed that Acox1, PGC1α, MTTP, PPARα, and Apo C-III were differentially regulated in the LFWD+F/S and HFWD groups (Fig. 7A right, and Supplemental Table S2). In contrast, IRS-2 and SREBP-1were significantly reduced only in the HFWD+F/S group. Significant reductions (>2-fold) in the expression of genes regulating glucose metabolism, G6P and PCK, overlapped between the HFWD and HFWD+F/S groups (Fig. 7A right, and Supplemental Table S2). For inflammation associated genes, we observed that TNFα gene expression was significantly increased in all the treatment groups, yet the highest level of expression was observed in the HFWD+F/S group (3.5-fold; Supplemental Table S2). In addition, substantial increases in gene expression of greater than 3-fold in MIP1α was observed exclusively in the HFWD+F/S group (Supplemental Table S2). Significant changes to the expression of cell cycle and apoptosis function genes (BNIP3, GADD45, and FASL) were primarily observed in the HFWD groups (Fig. 7A right). Analysis of genes with an oxidative stress function revealed that expression of hepatic Nox4 was significantly decreased only in the HFWD+F/S group (Fig. 7A right, and Supplemental Table S2). Furthermore, gp91phox and p67phox gene expression was significantly elevated only in the HFWD+F/S group. Analysis of genes with a fibrosis function (collagen 1a2, collagen 3a1, and TGFβ) showed that a significant increase in the expression of these genes occurred only in the HFWD+F/S group (Fig. 7A right, and Supplemental Table S2). Taken together, our data demonstrate that significant increases in expression to inflammation, oxidative stress and fibrosis genes are concentrated in the liver from the HFWD+F/S group.
Hepatic steatosis.
We investigated the role of sugar in the drinking water on Western diet-induced hepatic steatosis. Histological scoring of stained liver tissue sections from the diet treatment groups at 2 wk revealed that the steatosis score was significantly elevated in the HFWD+F/S group compared with the HFWD+F/S group but not the LFWD and LFWD+F/S groups (Fig. 7, B and C left). However, the liver TG level was significantly elevated in the HFWD+F/S group compared with all other dietary treatments (Fig. 7D left). At 12 wk, the steatosis score was significantly elevated in the HFWD+F/S groups compared with the LFWD and LFWD+F/S groups, yet statistical significance (α = 0.05) was not reached compared with the HFWD group (Fig. 7, B and C right). In contrast, a significant difference in liver TG level was observed between the HFWD and HFWD+F/S groups (Fig. 7D right).
Hepatic inflammation and oxidative stress.
The role of sugar in the drinking water on Western diet-induced hepatic inflammation was investigated. Histological examination of stained liver sections at 2 wk indicated an absence in inflammation only in the HFWD group (Fig. 7E left). The HFWD+F/S group had the greatest number of animals with inflammation, although statistical significance (α = 0.05) was not reached (Fig. 7E left). The inflammation score increased from 2 to 12 wk in all of the diet treatment groups, although there were no significant differences in inflammation score between groups at 12 wk (Fig. 7E right). To further investigate hepatic inflammation, JNK phosphorylation was assessed. A significant increase in phospho-JNK was detected only in the HFWD+F/S group (Fig. 7F). Taken together, our data do not fully support that hepatic inflammation is concentrated in the HFWD+F/S group.
Next, we examined the role of sugar in the drinking water on hepatic oxidative stress, which is thought to play a key role in progression of NAFLD from steatosis to steatohepatitis (24). Examination of liver tissue from mice in the LFWD+F/S and HFWD+F/S groups showed significantly elevated staining for 4-HNE, a highly reactive aldehyde generated by exposure of polyunsaturated fatty acids to peroxides and reactive oxygen species (Fig. 8A). In contrast, we observed that hepatic total SOD activity was significantly decreased only in the HFWD+F/S group (Fig. 8B). NADPH oxidase subunit protein expression was elevated for p22phox protein and decreased for p47phox and gp91phox across all diet treatments compared with the control diet (Fig. 8C). Taken together, our data do not strongly indicate that hepatic oxidative stress is exacerbated by the addition of sugary water in HFWD-fed mice.
Fig. 8.

Markers of hepatic oxidative stress and apoptosis. A: 4-HNE-stained liver section (top) and quantitation (mean ± SE) in arbitrary units (AU) (bottom). B: quantitation of hepatic SOD is shown as mean ± SE. C: hepatic NADPH oxidase subunit protein expression. Representative immunoblots are shown (top) and quantitation of immunoreactive bands minus background is shown as means ± SE in arbitrary units (AU) (bottom). Different letters indicate significantly different values at P < 0.05.
Hepatic apoptosis.
Apoptosis is a characteristic marker for the progression of steatosis to steatohepatitis. It is associated with an inflammatory response and is thought to play a critical role in the development of fibrosis (22). Analysis of TUNEL-positive hepatocytes in liver sections from mice fed the diets for 12 wk revealed significantly elevated TUNEL-positive hepatocytes in the HFWD+F/S group compared with the LFWD+F/S group. However, the HFWD+F/S group was not significantly different (α = 0.05) compared with the LFWD and HFWD groups (Fig. 9A). Apoptosis was further examined by assessing caspase-3 and -9 total and cleaved protein levels. A significant increase in total but not cleaved caspase-9 was observed only in the HFWD+F/S group compared with all other groups (Fig. 9B). There was no change in total caspase-3 in any of the diet groups. However, cleaved caspase-3 was significantly reduced in the HFWD+F/S groups. Taken together, our data suggest that hepatic apoptosis is modulated by the addition of sugary water in HFWD-fed mice.
Fig. 9.

Markers of hepatic apoptosis, apoptosis-related protein expression, fibrosis, and fibrosis-related protein expression. A: TUNEL staining of liver is shown as mean ± SE at 12 wk. B: assessment of caspase cleavage. Representative immunoblots are shown (top) and quantitation of immunoreactive bands minus background is shown as means ± SE in AU (bottom). C: fibrosis scoring of Masson's trichrome-stained liver fibrosis section is shown as percentage by treatment groups. D: fibrosis scoring of Masson's trichrome-stained liver fibrosis section is shown as percentage by fibrosis location. E: collagen I expression. Quantitation of protein expression is shown as means ± SE in AU. F: NAFLD total score at 12 wk is shown as means ± SE. Different letters indicate significantly different values at P < 0.05.
Hepatic fibrosis.
Next, hepatic fibrosis was investigated in the mice fed the diets for 12 wk. Eighty-six percent of the mice in the HFWD+F/S group developed fibrosis compared with only 33% in the LFWD group (Fig. 9C). Furthermore, only HFWD+F/S-fed mice developed the most severe type of fibrosis (Fig. 9D). Protein expression of collagen I, an important marker of hepatic fibrosis, was greatest in the HFWD+F/S group, although it did not reach statistical significance at α = 0.05 (Fig. 9E). Finally, we tallied steatosis, inflammation, and fibrosis scores for each animal to generate a NAFLD total score. As shown in Fig. 9F, the HFWD+F/S group had a significantly greater NAFLD total score at 12 wk. Thus, consumption of sugary water appears to exacerbate NAFLD in HFWD-fed mice.
Effects of diets on adipose RNA expression.
Our observation that eWAT expansion was impaired in the HFWD+F/S group but not the HFWD group (Table 1) suggested that sugary water consumption differential affected the eWAT adipose depot in Western diet fed-mice. Thus, we examined, using qPCR, the temporal changes in expression of adipose genes regulating lipid metabolism, inflammation, oxidative stress, apoptosis, and cell cycle, which are known to be modulated by overnutrition (41). To visualize only significant changes to the expression of the genes, we constructed a Venn diagram (Fig. 10A left), while fold changes and P values can be found in Supplemental Table S3. Analysis of adipose genes revealed that individual lipid metabolism genes were differentially regulated across the groups at 2 wk. However, a small subset (3/20) of lipid metabolism genes overlapped among the LFWD+F/S, HFWD, and HFWD+F/S groups (Fig. 10A left, and Supplemental Table S3). Similar results were observed in the expression of genes regulating oxidative stress (SOD2, Hmox1, NCF, and Nrf2; Fig. 10A left, and Supplemental Table S3). For genes regulating inflammation, we observed that only IL-6 gene expression was significantly increased in all of the treatment groups at 2 wk, yet the highest level of expression was observed in the LFWD+F/S group (3.1-fold; Supplemental Table S3). However, no consistent changes to expression of genes regulating cell cycle and apoptosis were observed across the treatment groups (Fig. 10A left, and Supplemental Table S3).
Fig. 10.

Epididymal white adipose tissue (eWAT) gene and protein expression. A: adipose gene expression at 2 and 12 wk. Arrows indicate significant differences in expression vs. LFWD-fed mice at each time point (italicized text represents >2-fold differences, with gray text representing upregulated genes). B and C: SCD1, ATGL, adiponectin, and α-tubulin expression. Representative immunoblots are shown (B); quantitation of immunoreactive bands relative to α-tubulin is shown as means ± SE (C). Different letters indicate significantly different values at P < 0.05.
We next investigated the change in expression of the same adipose genes at 12 wk. Again, a Venn diagram was constructed to represent only significant changes to the expression (Fig. 10A right). Changes to genes regulating lipid metabolism were concentrated in HFWD and HFWD+F/S groups at 12 wk; however, a unique group (CEBPα, SREBP1, ATGL, and SCD-1) was observed significantly reduced only in the HFWD+F/S group at 12 wk (Fig. 10A right, and Supplemental Table S4). Interestingly, adiponectin was also significantly reduced only in HFWD+F/S group at 12 wk (Fig. 10A right, and Supplemental Table S4). Consistent with the RNA expression, protein levels of adipose SCD-1, ATGL, and adiponectin were significantly reduced in the HFWD+F/S group compared with control group (Fig. 10, B and C).
A significant increase (>2-fold) in the expression of genes regulating inflammation (IL1β, MIP1α, and TNFα) overlapped between the HFWD and HFWD+F/S groups (Fig. 10A right, and Supplemental Table S4). Similar results were observed in the expression of genes regulating oxidative stress (p22phox, p91phox, p47phox, p67phox, Hmox1, and Nrf2) in the HFWD and HFWD+F/S groups at 12 wk (Fig. 10A right, and Supplemental Table S4). Furthermore, a significant increase in the expression of genes regulating cell cycle (p21) was also observed in the HFWD and HFWD+F/S groups. Consistent with this, gene expression of GADD45 and cyclin D1 were significantly increased in the HFWD and HFWD+F/S groups, respectively (Fig. 10A right, and Supplemental Table S4). No significant changes were observed in the expression of genes regulating apoptosis in any treatment groups at 12 wk (Supplemental Table S4). Analysis of PKC isoform expression at 12 wk (Fig. 10A, right, and Supplemental Table S4) revealed that a significant increase (>2-fold) in the expression of PKCβ and PKCδ overlapped between the HFWD and HFWD+F/S groups, whereas a surprising, significant decrease (>2-fold) in the expression of PKCε was observed only in HFWD+F/S group.
Adipocyte size.
To determine whether hypertrophy played a role in fat accumulation in the HFWD and HFWD+F/S groups, we measured adipocyte diameter in the eWAT from mice at 2 and 12 wk. A significant increase was observed at 2 wk in the diameter of eWAT adipocytes in the HFWD+F/S group compared with the LFWD and HFWD groups (Fig. 11, A and B top left). However, the diameter of eWAT adipocytes at 12 wk in the HFWD+F/S group was not significantly different from those in the HFWD group (Fig. 11, A and B top right).
Fig. 11.

eWAT inflammation and adipocyte size. A: H&E-stained adipose tissue sections at 2 and 12 wk. Shown are representative images at ×200 left and middle) and ×400 (right). B: quantitation of adipocyte size (top) and crown-like structures (CLS) (bottom) are shown as means ± SE at 2 and 12 wk. C: F4/80-stained eWAT macrophages at 12 wk. D: normalized gene expression of eWAT proinflammatory genes and fold changes (means ± SE) relative to LFWD at 12 wk. Different letters indicate significantly different values at P < 0.05. ND, not determined.
Adipose macrophage-containing crown-like structures and inflammation gene expression.
We next investigated the inflammatory status of eWAT, since low-level chronic inflammation and macrophage infiltration into WAT is a well-documented phenomenon in obesity (43). Macrophage infiltration in WAT is characterized by the appearance of crown-like structures (CLS), which constitute proinflammatory macrophages surrounding dying adipocytes (30). Therefore, to examine whether macrophage infiltration in eWAT is coincident with increased fat pad size and adipocyte hypertrophy, histological analysis using H&E and the macrophage marker F4/80 of eWAT was undertaken to assess CLS. No differences were observed in the number of CLS in the HFWD group compared with the LFWD group (Fig. 11, A and B, bottom). In contrast, a significant 12-fold increase in CLS was observed in the HFWD+F/S compared with LFWD and HFWD groups (Fig. 11B bottom). The presence of macrophages in the CLS was confirmed using the murine macrophage-specific marker F4/80 (Fig. 11C). To investigate the disparity in CLS in eWAT from the HFWD and HFWD+F/S groups, proinflammatory gene expression in the eWAT was determined. As shown in Fig. 11D, proinflammatory gene expression was elevated in the HFWD+F/S group. However, only MIP1α was significantly elevated (∼15-fold) in the HFWD+F/S group. TNFα gene expression was significantly elevated in the HFWD+F/S groups compared with the LFWD and LFWD+F/S groups, yet statistical significance (α = 0.05) was not reached compared with the HFWD group. Taken together with our adipocyte size data, a HFWD induces adipocyte hypertrophy and consumption of sugary water exacerbates HFWD-induced adipose tissue inflammation.
Adipose tissue dynamics.
Our normalized eWAT and adipocyte diameter data suggested that dynamic changes to the eWAT depot were occurring in the groups and in particular with the HFWD- and HFWD+F/S-fed mice between 2 and 12 wk. To further explore the dynamic changes, we determined the area of the adipocytes in the eWAT from HFWD-, HFWD+F/S-fed mice, and LFWD-fed mice as a control, at 2 and 12 wk and plotted the data by the mean frequency of the area for 2,000 to 12,000 adipocytes per fat pad. As shown in Fig. 12A left), the distribution of the frequency of adipocytes was not significantly different from 2 to 12 wk in LFWD-fed mice. In contrast, there was a highly significant shift in the area of adipocytes from 2 to 12 wk in HFWD-fed mice (Fig. 12A middle), indicating that 12 wk HFWD-fed mice have larger adipocytes. We also observed that the distribution was significantly different from 2 to 12 wk in HFWD+F/S-fed mice (Fig. 12A right). Consistent with the adipocyte diameter data, the distribution of adipocyte area was shifted in the HFWD+F/S group compared with the LFWD and HFWD groups at 2 wk (data not shown). Taken together, our adipocyte diameter and area data suggest a role for hypertrophy in the expansion of the eWAT from 2 to 12 wk and acceleration in hypertrophy in the HFWD+F/S group.
Fig. 12.

eWAT adipocyte size distribution and fibrosis and angiogenesis gene expression. A: frequency of adipocyte area from 0 to 1,500 μm2 in increments of 500 μm2 is shown as the mean at 2 and 12 wk. P values for the Kolmogorov-Smirnov test for sample distribution are shown. B: relationship between mean adipocyte area and eWAT weight at 2 wk (black triangles) and 12 wk (gray squares). Linear regression was performed separately for samples collected at 2 wk (black lines) and 12 wk (gray lines). Line equations and P values for differences in slopes are shown. C: normalized gene expression of eWAT fibrosis and angiogenesis genes and fold changes (means ± SE) relative to LFWD. Different letters indicate significantly different values at P < 0.05.
To further investigate the expansion of the eWAT depots from 2 to 12 wk, we examined the relationship between eWAT average adipocyte area and adipose tissue weight as described by MacDougald's group (25, 26, 32). The correlation between average adipocyte area and adipose tissue weight between treatment groups provided information on the adipocyte number and size (25). As shown in Fig. 12B left, the relationship between average adipocyte area and eWAT weight was virtually identical in LFWD-fed mice from 2 to 12 wk. In HFWD-fed mice the dramatic shift in eWAT weight from 2 to 12 wk was accompanied by a steeper slope in the 12-wk-fed mice compared with the 2-wk-fed mice, although the slopes were not significantly different (P = 0.053). However, in HFWD+F/S-fed mice with similar eWAT weights from 2 to 12 wk, there was a significant flatting of the slope in the 12-wk-fed mice compared with the 2-wk-fed mice. When the three diet groups were compared with one another at 2 wk, the HFWD+F/S group was significantly different from the LFWD and HFWD groups (data not shown), whereas all three diet groups were significantly different from one another at 12 wk (data not shown). These data suggest that there was little change in the size of adipocytes in the LFWD group from 2 to 12 wk whereas a slight change in number was accompanied by a significant change in size in the HFWD group. This appears to be different from that observed in the HFWD+F/S group based on the change in slope from 2 to 12 wk.
To gain insight into the mechanism mediating the dynamic difference occurring in the eWAT between the HFWD- and HFWD+F/S-fed mice, we next examined expression of genes regulating hypoxia, angiogenesis, and fibrosis, which play important roles in adipose tissue expansion in the eWAT (17, 36). In 2-wk-fed mice, HIF1α, a master regulator of the hypoxia response (11), showed significantly elevated expression in both HFWD and HFWD+F/S groups compared with the LFWD and LFWD+F/S groups; however, no differences were detected between the HFWD and HFWD+F/S groups (Fig. 12C top left). In contrast, gene expression of a HIF1α target, lysyl oxidase (LOX), was significantly increased only in the HFWD+F/S group (Fig. 12C top middle). Examination of genes regulating eWAT angiogenesis at 2 wk showed that VEGF gene expression was not significantly different between the diet treatments (Fig. 12C top left). However, significantly greater Ang1 gene expression was observed only in the LFWD+F/S-fed mice compared with LFWD-fed mice (Fig. 12C bottom left). We next examined in 2-wk-fed mice the gene expression of collagen 1a1 and collagen 6a1, which are considered major extracellular matrix (ECM) components in adipose tissue (37). Significantly increased expression of collagen 1a1 was observed in both HFWD and HFWD+F/S groups (Fig. 12C bottom middle). However, no difference was observed in the gene expression of collagen 6a1 across groups (Fig. 12C bottom right). Taken together, our data suggest an early hypoxia response in both HFWD and HFWD+F/S groups, with the potential for greater collagen cross-linking in the HFWD+F/S fed mice and a trend toward greater angiogenesis in LFWD+F/S-fed mice. Examination of gene expression regulating hypoxia, angiogenesis, and fibrosis in the eWAT from 12-wk-fed mice revealed that HIF1α and LOX were significantly greatest in the HFWD+F/S group (Fig. 12D top left and middle). Furthermore, a significant reduction in the expression of VEGF and Ang1 was also observed in HFWD+F/S group (Fig. 12D top left and bottom right). In contrast, VEGF was significantly elevated only in the LFWD+F/S group (Fig. 12D top right). HFWD+F/S-fed mice had significantly elevated gene expression of collagen 6a1 at 12 wk (Fig. 12D bottom middle). However, collagen 1a1 gene expression at 12 wk in the HFWD+F/S group was not significantly different from those in the HFWD group (Fig. 12D bottom middle). Taken together, our data in the eWAT at 12 wk suggest a role for increased hypoxia and fibrosis and reduced angiogenesis in HFWD+F/S-fed mice and a trend toward greater angiogenesis in LFWD+F/S-fed mice.
DISCUSSION
The metabolic phenotype of the HFWD+F/S model of obesity and NAFLD was explored at 2 and 12 wk to determine the metabolic parameters modulated by the HFWD and F/S treatments. Our observation that F/S consumption in HFWD-fed mice induced hyperphagia at 2 wk in the absence of changes to energy expenditure suggested an early effect of liquid sugar consumption. To examine whether the hyperphagic response was acute, we determined the metabolic phenotype of the HFWD+F/S model at 24 h after the transition to the dietary treatment. Our observation of the hyperphagic response in the day phase at 24 h in HFWD+F/S fed mice suggests an initial circadian disruption to the normal feeding pattern that has previously been reported in high-fat-fed mice (27). Consistent with the changes in diet, a reduction in substrate utilization was observed in HFWD- and HFWD+F/S-fed mice at 24 h that persisted at 2 wk. After 12 wk of HFWD feeding (with and without F/S), we observed differences in energy expenditure, total activity, and substrate utilization with the LFWD- and LFWD+F/S-fed mice. The data from 12 wk HFWD-fed mice (with and without F/S) are consistent with the phenotype associated with HFD-induced obesity that has previous been reported (2, 13).
As we expected, the HFWD resulted in a large increase in normalized eWAT weight at 12 wk. HFWD+F/S-fed mice, despite showing the highest normalized eWAT weight at 2 wk, had significantly less normalized eWAT after 12 wk, which indicated that the capacity of the eWAT to expand was impaired in the HFWD+F/S group. Our results are in agreement with a recently study demonstrating that the capacity of the eWAT to expand in high-fat diet-fed C57Bl/6 mice is impaired in mice that achieve a mass of around 40 g (40). Interestingly, van Beek et al. (40) did not observe impaired expansion of the subcutaneous and mesenteric depots. It will be important to examine in future studies whether subcutaneous and mesenteric depot expansion is also not impaired in HFWD+F/S-fed mice. Impairment in adipose tissue expansion has been found to be a critical factor in the development of insulin resistance (10), whereas enhanced adipose tissue expandability can lead to an improvement in insulin sensitivity (18). Thus, we questioned whether the consumption of sugary drinking water exacerbates high-fat diet-induced insulin resistance, which has not been clearly established in previous studies (19, 39). In our study, HFWD+F/S-fed mice were more glucose intolerant and insulin resistant than HFWD-fed mice. Importantly, our results are consistent with epidemiological (4) and human studies (33).
The capacity of adipose tissue to form new adipocytes (hyperplasia), which accumulate excess energy, can prevent ectopic lipid deposition in critical organs including visceral adipose tissue, liver, and muscle (12, 31, 36). Adipose tissue expansion can also result from an increase in the size (hypertrophy) of adipocytes in a depot-dependent fashion (12, 31, 36). Thus, we determined whether hypertrophy contributed to adipose tissue accumulation in the HFWD and HFWD+F/S groups. Changes to eWAT adipocyte size and area in the HFWD+F/S group at 2 wk suggested a role for hypertrophy in the adipose tissue expansion. At 12 wk, the change in eWAT adipocyte diameter was similar between the HFWD- and HFWD+F/S-fed mice. A significant shift in the distribution of the eWAT adipocyte area confirmed these results. When hyperplasia in addition to hypertrophy was examined as described by MacDougald's group (25), we observed differential changes to the relationship between average adipocyte area and eWAT weight in HFWD- and HFWD+F/S-fed mice from 2 to 12 wk (a steeper slope vs. a flatter slope, respectively). Thus, there are differences between eWAT adipose dynamics in the mice consuming sugary water and a HFWD compared with those just consuming a HFWD. The mechanism by which sugary drink consumption limits expandability of the adipose tissue is not known; however, it has been suggested that fibrosis, accumulation of extracellular matrix, and capillary vascularization may play a role in limiting adipose tissue expansion (17). Our data suggest that an early hypoxia response in the eWAT leads to reduced vascularization and increased fibrosis in the HFWD+F/S-fed mice. In the HFWD-fed mice, an early hypoxia response was also observed, but it was not accompanied by elevated expression of LOX or Col6a1, although Col1a1 gene expression was elevated at 12 wk. Our observation that Ang1 and VEGF were significantly elevated in LFWD+F/S-fed mice compared with LFWD-fed mice at 2 and 12 wk, respectively, suggests that eWAT expands in a healthy manner in LFWD+F/S-fed mice (36). To assess whether the adipose tissue expansion in our study was consistent with a pathological expansion (43), we examined the inflammatory status of eWAT. Compared with other groups, adipose tissue of HFWD+F/S-fed mice showed more profound inflammation, as shown by a dramatic increase in CLS formation and the expression of MIP-1α and TNFα. It has been proposed that T cell activation and recruitment within adipose tissue is an underlying cause of macrophage infiltration and eWAT inflammation (5, 34). Whether T cell activation and recruitment within adipose tissue mediates eWAT inflammation in mice consuming sugary water with a HFWD is not known.
In the present study, HFWD+F/S-fed mice had a significantly higher normalized liver weight, hepatic TG concentration, serum ALT level, and histological steatosis grade at as early as 2 wk compared with the other groups, which suggested that NAFLD progression was more pronounced in the HFWD+F/S-fed mice. Consistent with this conclusion, hepatic gene expression of proinflammatory molecules was markedly increased in the HFWD+F/S group, as were phospho-JNK protein levels. Finally, in our study, 86% of the mice in the HFWD+F/S group developed fibrosis of varying degrees, and the most severe type of fibrosis was observed in the HFWD+F/S-fed mice. Increased hepatic expression of genes regulating fibrosis (collagen 1a2, collagen 3a1, and TGFβ) and protein expression of collagen I was observed in HFWD+F/S-fed mice. Taken together, our data confirm and expand upon the work that consumption of sugary water in Western diet-fed mice leads to hepatic dysfunction. Thus, the combination of liquid sugar and high-fat accelerates liver disease from steatosis toward NASH.
Even though fructose is well known to be lipogenic, it is not known whether chronic consumption of a sugary drink containing fructose and sucrose leads to NAFLD in mice fed a LFWD. Our results indicate that substrate utilization in the day and night phases is acutely affected in mice consuming the sugary water. Furthermore, consumption of a fructose and sucrose sugary drink leads to robust changes in lipid metabolism gene expression in liver and adipose tissues. However, glucose tolerance, insulin resistance, liver dysfunction, and adipose inflammation were not modulated in the LFWD+F/S group, suggesting that F/S alone is not responsible for the changes we observed.
A strength of our study was the analysis of metabolic data and NAFLD at two time points. The study design allowed us to assess metabolic, histological, and gene expression changes over time in adipose and liver tissues. We found that HFWD+F/S resulted in significant obesity, insulin resistance, steatosis, and adipocyte hypertrophy as early as 2 wk, and inflammatory and fibrotic changes that were not observed in mice fed HFWD at 12 wk. Importantly, because we assessed adipose tissue at two time points, we were able to observe dynamic histological and gene expression changes, which correlated with the severity of hepatic dysfunction. Our observation that adiponectin was reduced at the gene expression and protein levels in the HFWD+F/S group suggests that adiponectin may be a potential link between adipose tissue dysfunction and NAFLD progression. This hypothesis is consistent with the known role of adiponectin in modulating steatosis, inflammation, and fibrosis (9). However, further experimentation is required to determine whether a reduction in adiponectin mediates the effects of the HFWD+F/S combination in NAFLD progression.
A limitation of our study was that adipose tissue depot expansion was assessed only in eWAT. It is not known whether adipose tissue expansion in other depots is modulated by consumption of sugary water in HFWD-fed mice. Other limitations include a lack of baseline body and organ weight, serum parameters, and insulin sensitivity measurements and the length of our study (12 wk). It is possible that we would have observed greater hepatic fibrosis development in the animals if the diet treatment had been for a longer duration.
Finally, our study suggests a model (Fig. 13) in which the combination of a HFWD with F/S in the drinking water can induce hyperphagia and circadian disruption of the feeding cycle in the absence of changes in energy expenditure, which modulates adipose tissue expansion and dysfunction leading to hepatic steatosis, inflammation, glucose intolerance, insulin resistance, and hepatic fibrosis that is consistent with progression to NASH. In conclusion, our data indicate that the high fat Western diet plus liquid sugar consumption model of obesity is a good model for NAFLD research and likely other clinical conditions associated with adipose tissue dysfunction.
Fig. 13.
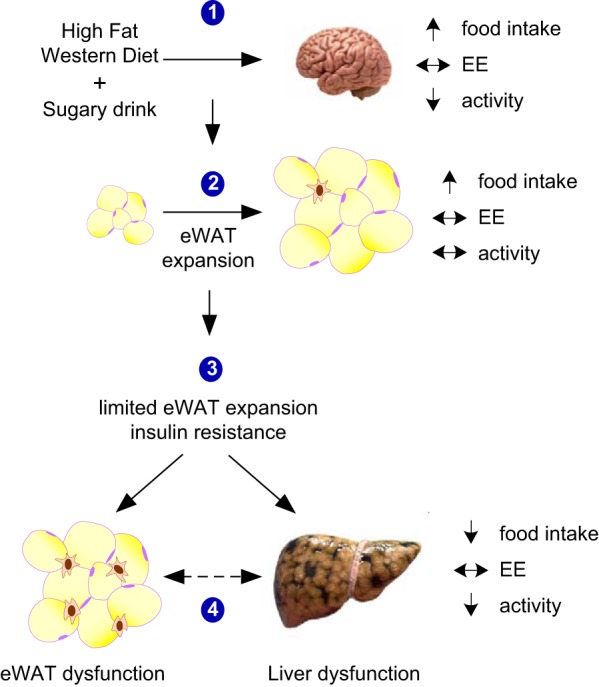
Model of the metabolic and pathophysiological effect of consuming a HFWD + sugary drinking water in mice. Events are 1) acute hyperphagic response to consumption of the diet in the absence of changes to energy expenditure is observed at 24 h and after 2 wk on the diet; 2) rapid eWAT expansion; 3) inability of eWAT to further expand, coupled with liver and adipose insulin resistance; and 4) adipose and liver dysfunction characterized by inflammation and progression to nonalcoholic steatohepatitis (NASH), respectively. The interaction between dysfunctional adipose tissue and the liver is still not fully known (dashed line).
GRANTS
This work was supported by the Stephen C. Clark Fund, the E. Donnall Thomas Resident Research Fund, Auburn University start-up funds, and USDA Hatch Grant No. ALA043-1-13013.
DISCLOSURES
No conflicts of interest, financial or otherwise, are declared by the author(s).
AUTHOR CONTRIBUTIONS
Author contributions: Y.L., C.M.B., E.C.G., J.Z., P.S., Q.K., S.K.D., A.M.O., and M.W.G. performed experiments; Y.L., C.M.B., E.C.G., J.Z., P.S., Q.K., S.K.D., A.M.O., and M.W.G. analyzed data; Y.L., C.M.B., E.C.G., R.L.J., S.K.D., and M.W.G. interpreted results of experiments; Y.L., C.M.B., E.C.G., J.Z., and M.W.G. prepared figures; Y.L. and M.W.G. drafted manuscript; Y.L., C.M.B., E.C.G., J.Z., R.L.J., and M.W.G. edited and revised manuscript; Y.L., C.M.B., E.C.G., J.Z., R.L.J., P.S., Q.K., S.K.D., A.M.O., and M.W.G. approved final version of manuscript; M.W.G. conception and design of research.
Supplementary Material
ACKNOWLEDGMENTS
We are grateful to September Amspacher for kindly assisting with histology and Michelle Zanache and the University of Rochester Functional Genomics Center for performing the real-time PCR analysis. We are thankful to Kunatum Prasidthrathsint MD for kindly providing technical assistance.
REFERENCES
- 1.Abdelmalek MF, Suzuki A, Guy C, Unalp-Arida A, Colvin R, Johnson RJ, Diehl AM. Nonalcoholic Steatohepatitis Clinical Research N. Increased fructose consumption is associated with fibrosis severity in patients with nonalcoholic fatty liver disease. Hepatology (Baltimore MD) 51: 1961–1971, 2010. [DOI] [PMC free article] [PubMed] [Google Scholar]
- 2.Almind K, Kahn CR. Genetic determinants of energy expenditure and insulin resistance in diet-induced obesity in mice. Diabetes 53: 3274–3285, 2004. [DOI] [PubMed] [Google Scholar]
- 3.Charlton M, Krishnan A, Viker K, Sanderson S, Cazanave S, McConico A, Masuoko H, Gores G. Fast food diet mouse: novel small animal model of NASH with ballooning, progressive fibrosis, and high physiological fidelity to the human condition. Am J Physiol Gastrointest Liver Physiol 301: G825–G834, 2011. [DOI] [PMC free article] [PubMed] [Google Scholar]
- 4.Dhingra R, Sullivan L, Jacques PF, Wang TJ, Fox CS, Meigs JB, D'Agostino RB, Gaziano JM, Vasan RS. Soft drink consumption and risk of developing cardiometabolic risk factors and the metabolic syndrome in middle-aged adults in the community. Circulation 116: 480–488, 2007. [DOI] [PubMed] [Google Scholar]
- 5.Duffaut C, Galitzky J, Lafontan M, Bouloumie A. Unexpected trafficking of immune cells within the adipose tissue during the onset of obesity. Biochem Biophys Res Commun 384: 482–485, 2009. [DOI] [PubMed] [Google Scholar]
- 6.Duval C, Thissen U, Keshtkar S, Accart B, Stienstra R, Boekschoten MV, Roskams T, Kersten S, Muller M. Adipose tissue dysfunction signals progression of hepatic steatosis towards nonalcoholic steatohepatitis in C57BL/6 mice. Diabetes 59: 3181–3191, 2010. [DOI] [PMC free article] [PubMed] [Google Scholar]
- 7.Ekstedt M, Franzen LE, Mathiesen UL, Thorelius L, Holmqvist M, Bodemar G, Kechagias S. Long-term follow-up of patients with NAFLD and elevated liver enzymes. Hepatology (Baltimore, MD) 44: 865–873, 2006. [DOI] [PubMed] [Google Scholar]
- 8.Gastaldelli A, Harrison SA, Belfort-Aguilar R, Hardies LJ, Balas B, Schenker S, Cusi K. Importance of changes in adipose tissue insulin resistance to histological response during thiazolidinedione treatment of patients with nonalcoholic steatohepatitis. Hepatology (Baltimore, MD) 50: 1087–1093, 2009. [DOI] [PubMed] [Google Scholar]
- 9.Gatselis NK, Ntaios G, Makaritsis K, Dalekos GN. Adiponectin: a key playmaker adipocytokine in non-alcoholic fatty liver disease. Clin Exp Med 2013. [DOI] [PubMed]
- 10.Gray SL, Nora ED, Grosse J, Manieri M, Stoeger T, Medina-Gomez G, Burling K, Wattler S, Russ A, Yeo GS, Chatterjee VK, O'Rahilly S, Voshol PJ, Cinti S, Vidal-Puig A. Leptin deficiency unmasks the deleterious effects of impaired peroxisome proliferator-activated receptor gamma function (P465L PPARgamma) in mice. Diabetes 55: 2669–2677, 2006. [DOI] [PubMed] [Google Scholar]
- 11.Halberg N, Khan T, Trujillo ME, Wernstedt-Asterholm I, Attie AD, Sherwani S, Wang ZV, Landskroner-Eiger S, Dineen S, Magalang UJ, Brekken RA, Scherer PE. Hypoxia-inducible factor 1alpha induces fibrosis and insulin resistance in white adipose tissue. Mol Cell Biol 29: 4467–4483, 2009. [DOI] [PMC free article] [PubMed] [Google Scholar]
- 12.Hardy OT, Czech MP, Corvera S. What causes the insulin resistance underlying obesity? Curr Opin Endocrinol Diabet Obes 19: 81–87, 2012. [DOI] [PMC free article] [PubMed] [Google Scholar]
- 13.Hoevenaars FP, Keijer J, Swarts HJ, Snaas-Alders S, Bekkenkamp-Grovenstein M, van Schothorst EM. Effects of dietary history on energy metabolism and physiological parameters in C57BL/6J mice. Exp Physiol 98: 1053–1062, 2013. [DOI] [PubMed] [Google Scholar]
- 14.Ishimoto T, Lanaspa MA, Rivard CJ, Roncal-Jimenez CA, Orlicky DJ, Cicerchi C, McMahan RH, Abdelmalek MF, Rosen HR, Jackman MR, Maclean PS, Diggle CP, Asipu A, Inaba S, Kosugi T, Sato W, Maruyama S, Sanchez-Lozada LG, Sautin YY, Hill JO, Bonthron DT, Johnson RJ. High fat and high sucrose (western) diet induce steatohepatitis that is dependent on fructokinase. Hepatology (Baltimore, MD) 2013. [DOI] [PMC free article] [PubMed]
- 15.Jung Y, Diehl AM. Non-alcoholic steatohepatitis pathogenesis: role of repair in regulating the disease progression. Dig Dis 28: 225–228, 2010. [DOI] [PubMed] [Google Scholar]
- 16.Kaiyala KJ, Spiekerman CF, Podolsky RH, McGuinness O. MMPC Energy Expenditure Analysis Page. https://www.mmpc.org/shared/regression.aspx.
- 17.Khan T, Muise ES, Iyengar P, Wang ZV, Chandalia M, Abate N, Zhang BB, Bonaldo P, Chua S, Scherer PE. Metabolic dysregulation and adipose tissue fibrosis: role of collagen VI. Mol Cell Biol 29: 1575–1591, 2009. [DOI] [PMC free article] [PubMed] [Google Scholar]
- 18.Kim JY, van de Wall E, Laplante M, Azzara A, Trujillo ME, Hofmann SM, Schraw T, Durand JL, Li H, Li G, Jelicks LA, Mehler MF, Hui DY, Deshaies Y, Shulman GI, Schwartz GJ, Scherer PE. Obesity-associated improvements in metabolic profile through expansion of adipose tissue. J Clin Invest 117: 2621–2637, 2007. [DOI] [PMC free article] [PubMed] [Google Scholar]
- 19.Kohli R, Kirby M, Xanthakos SA, Softic S, Feldstein AE, Saxena V, Tang PH, Miles L, Miles MV, Balistreri WF, Woods SC, Seeley RJ. High-fructose, medium chain trans fat diet induces liver fibrosis and elevates plasma coenzyme Q9 in a novel murine model of obesity and nonalcoholic steatohepatitis. Hepatology (Baltimore, MD) 52: 934–944, 2010. [DOI] [PMC free article] [PubMed] [Google Scholar]
- 20.Lighton JR, Turner RJ. The hygric hypothesis does not hold water: abolition of discontinuous gas exchange cycles does not affect water loss in the ant Camponotus vicinus. J Exp Biol 211: 563–567, 2008. [DOI] [PubMed] [Google Scholar]
- 21.Machado MV, Michelotti GA, Xie G, de Almeida TP, Boursier J, Bohnic B, Guy CD, Diehl AM. Mouse models of diet-induced nonalcoholic steatohepatitis reproduce the heterogeneity of the human disease. PLos One 10: e0127991, 2015. [DOI] [PMC free article] [PubMed] [Google Scholar]
- 22.Malhi H, Guicciardi ME, Gores GJ. Hepatocyte death: a clear and present danger. Physiol Rev 90: 1165–1194, 2010. [DOI] [PMC free article] [PubMed] [Google Scholar]
- 23.Marklund S, Marklund G. Involvement of the superoxide anion radical in the autoxidation of pyrogallol and a convenient assay for superoxide dismutase. Eur J Biochem 47: 469–474, 1974. [DOI] [PubMed] [Google Scholar]
- 24.Mehta K, Van Thiel DH, Shah N, Mobarhan S. Nonalcoholic fatty liver disease: pathogenesis and the role of antioxidants. Nutr Rev 60: 289–293, 2002. [DOI] [PubMed] [Google Scholar]
- 25.Parlee SD, Lentz SI, Mori H, MacDougald OA. Quantifying size and number of adipocytes in adipose tissue. Methods Enzymol 537: 93–122, 2014. [DOI] [PMC free article] [PubMed] [Google Scholar]
- 26.Parlee SD, Simon BR, Scheller EL, Alejandro EU, Learman BS, Krishnan V, Bernal-Mizrachi E, MacDougald OA. Administration of saccharin to neonatal mice influences body composition of adult males and reduces body weight of females. Endocrinology 155: 1313–1326, 2014. [DOI] [PMC free article] [PubMed] [Google Scholar]
- 27.Pendergast JS, Branecky KL, Yang W, Ellacott KL, Niswender KD, Yamazaki S. High-fat diet acutely affects circadian organisation and eating behavior. Eur J Neurosci 37: 1350–1356, 2013. [DOI] [PMC free article] [PubMed] [Google Scholar]
- 28.Qureshi K, Abrams GA. Metabolic liver disease of obesity and role of adipose tissue in the pathogenesis of nonalcoholic fatty liver disease. World J Gastroenterol 13: 3540–3553, 2007. [DOI] [PMC free article] [PubMed] [Google Scholar]
- 29.Reedy J, Krebs-Smith SM. Dietary sources of energy, solid fats, and added sugars among children and adolescents in the United States. J Am Diet Assoc 110: 1477–1484, 2010. [DOI] [PMC free article] [PubMed] [Google Scholar]
- 30.Rombouts K, Marra F. Molecular mechanisms of hepatic fibrosis in non-alcoholic steatohepatitis. Dig Dis 28: 229–235, 2010. [DOI] [PubMed] [Google Scholar]
- 31.Sarjeant K, Stephens JM. Adipogenesis. Cold Spring Harbor Perspect Biol 4: a008417, 2012. [DOI] [PMC free article] [PubMed] [Google Scholar]
- 32.Simon BR, Learman BS, Parlee SD, Scheller EL, Mori H, Cawthorn WP, Ning X, Krishnan V, Ma YL, Tyrberg B, MacDougald OA. Sweet taste receptor deficient mice have decreased adiposity and increased bone mass. PLos One 9: e86454, 2014. [DOI] [PMC free article] [PubMed] [Google Scholar]
- 33.Stanhope KL, Schwarz JM, Keim NL, Griffen SC, Bremer AA, Graham JL, Hatcher B, Cox CL, Dyachenko A, Zhang W, McGahan JP, Seibert A, Krauss RM, Chiu S, Schaefer EJ, Ai M, Otokozawa S, Nakajima K, Nakano T, Beysen C, Hellerstein MK, Berglund L, Havel PJ. Consuming fructose-sweetened, not glucose-sweetened, beverages increases visceral adiposity and lipids and decreases insulin sensitivity in overweight/obese humans. J Clin Invest 119: 1322–1334, 2009. [DOI] [PMC free article] [PubMed] [Google Scholar]
- 34.Strissel KJ, DeFuria J, Shaul ME, Bennett G, Greenberg AS, Obin MS. T-cell recruitment and Th1 polarization in adipose tissue during diet-induced obesity in C57BL/6 mice. Obesity (Silver Spring, MD) 18: 1918–1925, 2010. [DOI] [PMC free article] [PubMed] [Google Scholar]
- 35.Sumiyoshi M, Sakanaka M, Kimura Y. Chronic intake of high-fat and high-sucrose diets differentially affects glucose intolerance in mice. J Nutr 136: 582–587, 2006. [DOI] [PubMed] [Google Scholar]
- 36.Sun K, Kusminski CM, Scherer PE. Adipose tissue remodeling and obesity. J Clin Invest 121: 2094–2101, 2011. [DOI] [PMC free article] [PubMed] [Google Scholar]
- 37.Sun K, Tordjman J, Clement K, Scherer PE. Fibrosis and adipose tissue dysfunction. Cell Metab 18: 470–477, 2013. [DOI] [PMC free article] [PubMed] [Google Scholar]
- 38.Syn WK, Yang L, Chiang DJ, Qian Y, Jung Y, Karaca G, Choi SS, Witek RP, Omenetti A, Pereira TA, Diehl AM. Genetic differences in oxidative stress and inflammatory responses to diet-induced obesity do not alter liver fibrosis in mice. Liver Int 29: 1262–1272, 2009. [DOI] [PMC free article] [PubMed] [Google Scholar]
- 39.Tetri LH, Basaranoglu M, Brunt EM, Yerian LM, Neuschwander-Tetri BA. Severe NAFLD with hepatic necroinflammatory changes in mice fed trans fats and a high-fructose corn syrup equivalent. Am J Physiol Gastrointest Liver Physiol 295: G987–G995, 2008. [DOI] [PMC free article] [PubMed] [Google Scholar]
- 40.van Beek L, van Klinken JB, Pronk AC, van Dam AD, Dirven E, Rensen PC, Koning F, Willems van Dijk K, van Harmelen V. The limited storage capacity of gonadal adipose tissue directs the development of metabolic disorders in male C57Bl/6J mice. Diabetologia 58: 1601–1609, 2015. [DOI] [PMC free article] [PubMed] [Google Scholar]
- 41.Voigt A, Agnew K, van Schothorst EM, Keijer J, Klaus S. Short-term, high fat feeding-induced changes in white adipose tissue gene expression are highly predictive for long-term changes. Mol Nutr Food Res 57: 1423–1434, 2013. [DOI] [PubMed] [Google Scholar]
- 42.Weir JB. New methods for calculating metabolic rate with special reference to protein metabolism. J Physiol 109: 1–9, 1949. [DOI] [PMC free article] [PubMed] [Google Scholar]
- 43.Weisberg SP, McCann D, Desai M, Rosenbaum M, Leibel RL, Ferrante AW Jr. Obesity is associated with macrophage accumulation in adipose tissue. J Clin Invest 112: 1796–1808, 2003. [DOI] [PMC free article] [PubMed] [Google Scholar]
- 44.Welsh JA, Sharma A, Abramson JL, Vaccarino V, Gillespie C, Vos MB. Caloric sweetener consumption and dyslipidemia among US adults. JAMA 303: 1490–1497, 2010. [DOI] [PMC free article] [PubMed] [Google Scholar]
Associated Data
This section collects any data citations, data availability statements, or supplementary materials included in this article.