

Abstract
Altered myocardial fuel selection likely underlies cardiac disease risk in diabetes, affecting oxygen demand and myocardial metabolic flexibility. We investigated myocardial fuel selection and metabolic flexibility in human type 2 diabetes mellitus (T2DM), using positron emission tomography to measure rates of myocardial fatty acid oxidation {16-[18F]fluoro-4-thia-palmitate (FTP)} and myocardial perfusion and total oxidation ([11C]acetate). Participants underwent paired studies under fasting conditions, comparing 3-h insulin + glucose euglycemic clamp conditions (120 mU·m−2·min−1) to 3-h saline infusion. Lean controls (n = 10) were compared with glycemically controlled volunteers with T2DM (n = 8). Insulin augmented heart rate, blood pressure, and stroke index in both groups (all P < 0.01) and significantly increased myocardial oxygen consumption (P = 0.04) and perfusion (P = 0.01) in both groups. Insulin suppressed available nonesterified fatty acids (P < 0.0001), but fatty acid concentrations were higher in T2DM under both conditions (P < 0.001). Insulin-induced suppression of fatty acid oxidation was seen in both groups (P < 0.0001). However, fatty acid oxidation rates were higher under both conditions in T2DM (P = 0.003). Myocardial work efficiency was lower in T2DM (P = 0.006) and decreased in both groups with the insulin-induced increase in work and shift in fuel utilization (P = 0.01). Augmented fatty acid oxidation is present under baseline and insulin-treated conditions in T2DM, with impaired insulin-induced shifts away from fatty acid oxidation. This is accompanied by reduced work efficiency, possibly due to greater oxygen consumption with fatty acid metabolism. These observations suggest that improved fatty acid suppression, or reductions in myocardial fatty acid uptake and retention, could be therapeutic targets to improve myocardial ischemia tolerance in T2DM.
Keywords: myocardial, heart, diabetes, metabolism, metabolic flexibility, positron emission tomography
alterations in metabolic substrate uptake and metabolism are part of the phenotype that defines type 2 diabetes mellitus (T2DM) (3, 4, 33, 39, 74). The phenomenon of “metabolic flexibility” is the capacity of an organism, a tissue bed, or a cell system to switch readily among fuel types. Impaired metabolic flexibility is another phenotypic feature of T2DM (33, 66). Impaired metabolic flexibility has been demonstrated in skeletal muscle in human diabetes (32, 66). This whole body effect likely arises due to effects of impaired insulin-stimulated glucose uptake, together with abnormalities in availability, uptake, and metabolism of fatty acid fuels (33, 66, 75).
The myocardium is also affected by T2DM. The fuel needs of the heart are dramatically different than those of skeletal muscle, supporting continuous work even under resting conditions. Abnormalities in myocardial fuel selection in animal models of diabetes have been described (42, 54, 75), including impairments in insulin-stimulated glucose uptake and impaired suppression of myocardial fatty acid uptake by insulin. The capacity for flexible selection among fuel sources has implications for ischemia tolerance, as the oxygen requirements for metabolizing fatty acids are higher than those for carbohydrates (43), and may contribute to efficiency of supplying fuel for contractile function more generally. Most studies to date that evaluated metabolic flexibility of the diabetic heart have studied the insulin-deficient state, i.e., models of type 1 diabetes (5, 42, 54). Very little data exist exploring effects of T2DM on myocardial fuel selection, and data are particularly lacking in human T2DM (75). Here we describe studies in nonobese nondiabetic control and obese type 2 diabetic humans, using positron emission tomography (PET) to quantify the effect of insulin to drive myocardial fuel selection away from fatty acids. We present evidence for metabolic inflexibility in the diabetic heart in T2DM, owing to diabetes-related abnormalities in fatty acid uptake and in fatty acid availability.
METHODS
Participant selection.
Participants were recruited from the general public by advertising in local newspapers and by word of mouth. Participants were recruited into two groups, lean and T2DM. Lean status was defined as body mass index <25 kg/m2 and percent fat by dual energy X-ray absorptiometry (Lunar DXA; GE, Madison WI) <28% in men and <30% in women. Lean volunteers were required to have normal glucose control by American Diabetes Association 2002 criteria on screening 75-g oral glucose tolerance test. T2DM participants could be treated with any combination of oral agents and insulin except agents of the PPARγ agonist class; diabetes management was standardized for a 1-wk period in advance of measurements to insulin only as detailed below. Inclusion criteria included age 18–45, in good general health (other than T2DM), without recognized diabetic complications. Lean subjects were required to be taking no regular medications. For T2DM volunteers the use of blood pressure and cholesterol medications was allowed, but these medications were discontinued for 3–5 days in advance of the PET studies. Exclusion criteria were chronic illnesses other than T2DM, extreme hypertension or hyperlipidemia that would preclude brief discontinuation of medications for these conditions, musculoskeletal conditions that would not allow comfortable performance of the 3-h supine glucose clamp and PET imaging procedure, claustrophobia, history of radiation exposure that would preclude the additional dosing with the PET imaging, and current pregnancy. This study was overseen by the Indiana University Institutional Review Board, and all participants gave written informed consent for their participation. This study was registered on clinicaltrails.gov as NCT02563834.
Study design.
Participants were studied on two consecutive days, under the protocol outlined in Fig. 1. Participants were admitted to the Indiana University Clinical Research Center (CRC) between 8 and 10 PM the evening before the first planned study and fasted overnight. No cigarette smoking was permitted starting 24 h before the planned study. A urine pregnancy test was performed on admission in female participants to ensure a negative result before proceeding with the study.
Fig. 1.

Study protocol diagram. Arrows indicate time points where measurements and blood sampling took place across the study protocol. FTP, 16-[18F]fluoro-4-thia-palmitate; ICG, impedance cardiography.
PET studies were performed in the fasting state on two consecutive days. On both days a two-tracer protocol was used to measure cardiac perfusion and oxidative metabolism ([11C]acetate) (52, 63, 68) and fatty acid uptake {16-[18F]fluoro-4-thia-palmitate (FTP), a synthetic 16 carbon fatty acid} (20, 21). FTP was selected because the presence of the thiol group at position 4 effectively traps the tracer in the mitochondrion after uptake and initial handling by the β-oxidation pathway without opportunity to redistribute into other intracellular fatty acid pools, therefore providing a direct measure of fatty acid oxidation rate (19–21). Blood samples for later measurement of circulating levels of relevant metabolites [glucose, insulin, and nonesterified fatty acid (NEFA)] were taken at planned intervals across the study (Fig. 1). Noninvasive measurements of systemic hemodynamics were taken simultaneously during the PET studies at similar intervals (impedance cardiography; BioZ.com, CardioDynamics, San Diego, CA) using surface electrodes placed on the thorax and neck and an automated blood pressure cuff.
On one study day, a control infusion of normal saline was applied to match the timing of PET imaging and the volume loading associated with the insulin-glucose clamp procedure. On the other study day, generally the second day, a hyperinsulinemic (120 mU·m−2·min−1)-euglycemic clamp procedure was initiated by 8 PM as we have previously done, according to the method of DeFronzo et al. (18). The PET imaging procedure began after 120 min of the saline or insulin infusion. The insulin-glucose infusion continued throughout the PET imaging sequence, maintaining euglycemia by continuous adjustment to the glucose infusion rate according to the arterialized blood samples every 5 min. At the end of the first study day, participants were returned to the CRC, fed a 2,000 kcal/day lunch and supper, and then fasted again from 8 PM until the end of the PET imaging procedure on the second day.
Glucose management.
Participants with T2DM underwent a 7-day standardization of glycemic control, using only long- and short-acting insulin and discontinuing all other diabetes medicines from 7 days before PET measurements. These changes were individualized by the team physician (K. J. Mather) and adjusted every 1–2 days based on self-monitored blood glucose values, targeting AM glucose levels 90–130 mg/dl (5.0–7.2 mmol/l). The goal of this intervention was to achieve near-normal levels of glycemia at the time of the studies with only long-acting insulin carrying into the interval of the glucose clamp and PET procedure. To the degree that improvement in glycemia and exposure to insulin also mitigated any adaptations or chronic effects of hyperglycemia on myocardial fuel selection, uptake, or metabolism, such secondary effects were anticipated to bias toward measuring the underlying state of the heart independent of chronic hyperglycemia. Similarly, such effects could improve insulin responses in other target tissues and thereby help isolate effects of diabetes per se independent of hyperglycemia and under-insulinization.
PET methodology.
Analytical grade source chemicals were used for the synthesis of labeled tracers. Carbon-11 (11C) and fluorine-18 (18F) were generated using a Siemens CTI RDS 112 medical cyclotron system. FTP was synthesized as described previously (21) with radiochemical purity >98%. FTP was formulated for intravenous administration in 1% human serum albumin and sterile filtered using a 0.2-μ filter. Acetate was labeled as previously described (31).
Imaging was performed using a Siemens ECAT EXACT HR+ whole body PET scanner. This system has an intrinsic in-plane image resolution of ∼4.2 mm full-width at half-maximal. The system simultaneously measures 63 image planes with an axial coverage of 15.5 cm.
Conventional data acquisition procedures were used to acquire and reconstruct the PET images. This included a transmission measurement to enable correction for attenuation by body mass. The image data were reconstructed using conventional filtered back-projection algorithms and a Hanning smoothing filter, which produces an image resolution of ∼1.0 cm full-width at half-maximal. This filter function was selected because it is consistent with the observed resolution degradation observed by the motion of the heart as determined with cardiac gated imaging studies. Custom software was used to identify the entire left ventricle as a single volume of interest and then apply mathematical modeling to the resulting volume of interest. The left ventricle cavity, concurrently identified, served as an arterial blood pool from which the input function was derived. Following acetate infusion, serial timed peripheral blood samples were taken (at minutes 0, 3, 6, 10, 15, 20, 25, and 30) and immediately analyzed for circulating concentrations of labeled CO2 and later used as a correction for the image-derived input function (11, 53). Similarly, timed samples were taken at these same intervals following FTP infusion and assayed for total and FTP-specific radioactivity to determine metabolite correction curves for the input function.
Compartmental modeling using a two-compartment model was applied to the metabolite-corrected acetate data to derive separate terms for influx and efflux kinetics. Myocardial blood flow was measured directly from the influx kinetic parameter k1 (31, 47). Myocardial oxygen consumption was derived from the efflux parameter k2 using k2 = 0.0071 + 0.0074 (MV̇o2) (67), as we have done previously (47). For FTP kinetics we applied Patlak analysis to derive uptake kinetics using metabolite-corrected input functions (55). In exploratory analyses we applied a variety of two- and three-compartment models, but owing to the monotonic uptake of FTP in many individual datasets we were unable to derive kinetic constants beyond simple uptake kinetics; therefore, data are only presented for Patlak-derived results.
The slope of the Patlak plot (Ki) for FTP represents the net rate at which the radiotracer is trapped, incorporating rates of fatty acid uptake and efflux before metabolic trapping. Multiplying Ki values by ambient NEFA concentrations at the time of fatty acid imaging provided net rates of fatty acid oxidation (FAO = Ki × NEFA/LC), where a lumped constant (LC) value of 2.10 was applied to account for the difference of FTP kinetics to natural fatty acid kinetics as based on studies in isolated rat hearts under normoxic conditions (19).
Impedance cardiography.
Systemic hemodynamic parameters were measured to assess cardiac work during the measurements of metabolic rates. Conventional automated cuff-derived blood pressures were measured concurrently with impedance cardiography (BioZ.com; CardioDynamics). Impedance cardiography provides a noninvasive measure of cardiac output and other systemic hemodynamic parameters, deriving parameters from cyclical fluctuations in the electrical resistance (impedance) of the with the cardiac cycle. The waveform directly reflects stroke volume, allowing derivation of cardiac output and (together with blood pressure measures) cardiac work (17, 27). The use of this system allowed repeated measurements to be made noninvasively during the course of the PET imaging with the subject positioned in the scanner. Steady-state measurements were taken twice, at 120 min (steady state, start of PET scanning) and at the end of the scan sequence, and the mean of these readings was taken to reflect cardiac status at the time of PET imaging.
Analyte measurement.
The concentrations of glucose in arterialized blood samples was measured by a glucose oxidase method (model 2300; Yellow Springs Instruments, Yellow Springs, OH). Blood for determination of other analytes was frozen at −80°C. Insulin determinations were made using a dual-site radioimmunoassay (Millipore, Billerica, MA). NEFA measurements were performed using a colorimetric assay (Wako Diagnostics, Richmond, VA). Cholesterol and triglyceride measures were made using standard methodologies through our local hospital's clinical laboratory
Statistical approach.
Descriptive statistics were presented as means ± SD; other results were presented as means ± SE. Normality of distribution of variables was assessed graphically, and by statistical testing using a Kolmogrov-Smirnov test; no variables required transformation to apply parametric testing. Baseline characteristics were compared between groups using unpaired t-tests.
The overall comparison of interest is in the set of measurements made at the time of PET imaging, comparing the two study groups. We used a mixed model approach, comparing effects of the insulin-glucose clamp vs. saline on parameters measured at the time of PET imaging across groups. For parameters where pre-PET values were measured (e.g., baseline and steady-state values on each study day), these were also incorporated into the analyses. Analyses were also performed comparing the two treatment groups under steady-state insulin conditions, to highlight differences in the achieved metabolic or hemodynamic effects. Regression analyses were used to evaluate the determinants of myocardial fuel consumption, efficiency, and blood flow under these treatment conditions. Statistical analyses were performed using SPSS version 23 (IBM, Chicago IL).
Statistical power for this study was based on the PET endpoints of blood flow, oxidation rate, and fatty acid utilization. For the acetate-derived measures, the population variability observed by us and by others is on the order of 15% (coefficient of variation), i.e., 1SD ∼0.15 of mean values (23, 36). At the time of this study no estimate of variability for the FTP imaging in humans was available; we assumed it was similar to that of the acetate parameters. Based on this estimate, we calculated that nine participants per group would be sufficient to demonstrate between-group differences on the order of 1SD at 83% power. To allow for dropouts and incomplete data, we planned to recruit 10 subjects per group.
RESULTS
Characteristics of the participants are described in Table 1. At the time of enrollment, the diabetic participants had an average HbA1c of 8.3 ± 3.5%, and their fasting glucose was 8.3 ± 2.6 mmol/l. Following the prestudy period of standardization of therapy using basal/bolus insulin without oral agents, the 7-day average fasting glucose was 5.8 ± 1.0 mmol/l, and the 7-day average presupper glucose was 6.7 ± 1.1 mmol/l.
Table 1.
Population description
| Lean (n = 10) | Type 2 Diabetes (n = 8) | P Value | |
|---|---|---|---|
| Age | 34.1 ± 9.0 | 40.4 ± 9.2 | 0.17 |
| Sex, M/F | 10/0 | 5/3 | |
| Race, W/B | 5/5 | 5/3 | |
| BMI, kg/m2 | 22.6 ± 2.4 | 32.7 ± 7.9 | 0.001 |
| Weight, kg | 71.0 ± 9.6 | 93.3 ± 22.4 | 0.01 |
| Percent fat, % | 17.5 ± 6.6 | 37.4 ± 12.2 | <0.001 |
| SBP/DBP, mmHg | 117 ± 11/70 ± 7 | 121 ± 12/76 ± 14 | 0.54/0.28 |
| Total cholesterol, mmol/l | 4.23 ± 0.61 | 4.81 ± 0.91 | 0.13 |
| LDL cholesterol, mmol/l | 2.71 ± 0.71 | 3.20 ± 0.84 | 0.20 |
| HDL cholesterol, mmol/l | 1.06 ± 0.27 | 1.03 ± 0.27 | 0.78 |
| TG, mmol/l | 0.81 ± 0.37 | 1.25 ± 0.42 | 0.03 |
| HbA1c enrollment, % | 8.3 ± 3.5 | ||
| Glucose enrollment, mmol/l | 4.9 ± 0.2 | 8.3 ± 2.6 | <0.0001 |
| Glucose AM control, mmol/l | 4.8 ± 0.2 | 6.3 ± 1.0 | <0.0001 |
| Glucose AM insulin, mmol/l | 5.1 ± 0.5 | 7.0 ± 1.3 | 0.001 |
| Glucose SS clamp, mmol/l | 5.1 ± 0.5 | 5.0 ± 0.6 | 0.97 |
| NEFA control, μmol/l | 414 ± 356 | 528 ± 252 | 0.46 |
| NEFA clamp, μmol/l | 28 ± 23 | 85 ± 35 | 0.001 |
| Insulin control, μU/ml | 8 ± 3 | 27 ± 29 | 0.06 |
| Insulin clamp, μU/ml | 204 ± 76 | 240 ± 67 | 0.31 |
| Glucose disposal rate, mg·kg fat free mass−1·min−1 | 8.33 ± 0.55 | 3.49 ± 0.61 | <0.0001 |
Values are means ± SE. M/F, male/female; W/B, white/black; SBP/DBP, systolic/diastolic blood pressure; TG, triglycerides; SS, steady state, the stage at ∼3 h where the insulin effect has stabilized; NEFA, nonesterified fatty acids.
Metabolic measures.
The approach to matching glucose concentrations for fasting study conditions was acceptably achieved. Lean control subjects had normal range glucose values the morning of both study days (Table 2; ∼5 mmol/l). Following short-term improvement of their glucose control in preparation for the study procedures, diabetic subjects had glucose values within the target range (Table 2; 6.3 ± 0.3 control day and 7.0 ± 0.5 clamp day). These values were significantly higher than those of the lean controls (P < 0.0001) but not different within diabetic subjects across the two study days (P = 0.08). On the control day, no study-imposed change in these values was undertaken, but on the clamp day we targeted a steady-state glucose value of 5 mmol/l.
Table 2.
Hemodynamic responses to insulin-glucose clamp
| Lean |
Type 2 DM |
P Values |
||||||||||
|---|---|---|---|---|---|---|---|---|---|---|---|---|
| Control day baseline | Control day 3-h saline | Clamp day baseline | Clamp day SS insulin | Control day baseline | Control day 3-h saline | Clamp day baseline | Clamp day SS insulin | Group | Study day | Insulin effect | Group × insulin effect | |
| SBP, mmHg | 119 ± 4 | 116 ± 5 | 124 ± 5 | 132 ± 6* | 115 ± 4 | 126 ± 5 | 120 ± 5 | 127 ± 6* | 0.87 | 0.005† | 0.03† | 0.01† |
| DBP, mmHg | 70 ± 4 | 69 ± 3 | 71 ± 4 | 76 ± 4* | 69 ± 4 | 79 ± 3 | 78 ± 4 | 77 ± 4* | 0.39 | 0.01† | 0.04 | 0.009† |
| MAP, mmHg | 84 ± 4 | 83 ± 4 | 87 ± 4 | 92 ± 4 | 85 ± 4 | 96 ± 4 | 93 ± 4 | 93 ± 4* | 0.28 | 0.007† | 0.01† | 0.01† |
| HR, bets/min | 55 ± 3 | 56 ± 3 | 60 ± 4 | 69 ± 4 | 64 ± 3 | 68 ± 3 | 69 ± 4 | 73 ± 4 | 0.08 | <0.001† | 0.04† | 0.31 |
| SV, ml | 97 ± 6 | 97 ± 7 | 93 ± 8 | 90 ± 7 | 87 ± 7 | 78 ± 8 | 84 ± 8 | 81 ± 8 | 0.27 | 0.25 | 0.34 | 0.50 |
| SI, ml/m2 | 51 ± 3 | 51 ± 3 | 48 ± 3 | 47 ± 3 | 43 ± 3 | 38 ± 3 | 41 ± 4 | 40 ± 3 | 0.03† | 0.19 | 0.03† | 0.47 |
| CO, l/min | 5.3 ± 0.4 | 5.3 ± 0.4 | 5.6 ± 0.4 | 6.1 ± 0.4 | 5.2 ± 0.4 | 5.2 ± 0.4 | 5.4 ± 0.5 | 5.7 ± 0.5 | 0.67 | 0.02† | 0.27 | 0.77 |
| CI, l·min−1·m−2 | 2.8 ± 0.1 | 2.8 ± 0.1 | 2.9 ± 0.2 | 3.2 ± 0.2 | 2.6 ± 0.1 | 2.5 ± 0.1 | 2.6 ± 0.2 | 2.8 ± 0.2 | 0.10 | 0.01† | 0.18 | 0.75 |
| SVR, dyn·s·cm−5 | 1,188 ± 109 | 1,190 ± 120 | 1,183 ± 137 | 1,150 ± 104 | 1,286 ± 121 | 1,470 ± 136 | 1,376 ± 145 | 1,294 ± 115 | 0.26 | 0.54 | 0.33 | 0.61 |
| SVRI, dyn·s·cm−5·m−2 | 2,042 ± 266 | 2,049 ± 289 | 2,025 ± 294 | 1,949 ± 257 | 2,561 ± 298 | 2,925 ± 328 | 2,705 ± 325 | 2,601 ± 288 | 0.09 | 0.45 | 0.35 | 0.65 |
| LCW, kg/m | 5.7 ± 0.4 | 5.6 ± 0.5 | 6.1 ± 0.5 | 7.3 ± 0.6* | 5.6 ± 0.5 | 6.4 ± 0.5 | 6.5 ± 0.5 | 7.0 ± 0.7 | 0.74 | 0.001† | 0.053 | 0.18 |
| LCWI, kg·m·m−2 | 3.0 ± 0.2 | 2.9 ± 0.2 | 3.1 ± 0.2 | 3.8 ± 0.3 | 2.7 ± 0.2 | 3.1 ± 0.2 | 3.2 ± 0.2 | 3.4 ± 0.3 | 0.72 | 0.001† | 0.07 | 0.12 |
Values are means ± SE. Results are presented from analyses using mixed modeling, evaluating overall differences by participant group, whether the overall results differ by study day, and the effect of insulin vs. saline adjusted for study day differences. CI, cardiac index; CO, cardiac output; DM, diabetes mellitus; HR, heart rate; LCW, left cardiac work; LCWI, left cardiac work index; MAP, mean arterial pressure; SBP, systolic blood pressure; SI, stroke index; SV, stroke volume; SVR, systemic vascular resistance, SVRI, systemic vascular resistance index.
Variables where the insulin effect was statistically significant (P < 0.05) within a specific group.
Statistically significant comparisons.
The NEFA concentrations were higher in the diabetic participants (fasting saline control day P = 0.46 and insulin-glucose clamp steady state P = 0.001) and were less completely suppressed by the high-dose insulin infusion than was achieved in the lean control subjects (Table 1). This reflects insulin resistance in adipose tissue for suppression of lipolysis.
One lean participant had unexpectedly high fatty acid concentrations, >3SD above the mean for the lean group (body mass index: 21.0; fasting NEFA: 1,310 μmol/l; fasting glucose: 5.1 mmol/l). In fact this NEFA value was higher than all the values from diabetic participants. Excluding that individual, the NEFA concentrations in the lean group (n = 9) were 314 ± 72 μmol/l and suppressed to 30 ± 10 with insulin (P = 0.002 at steady state). Analyses of metabolic and PET measurements were not overall affected by excluding this individual otherwise (not shown), and the results presented in the tables and figures include this individual.
Under control and insulin treated conditions, lean subjects had numerically but not statistically lower insulin concentrations than the diabetic subjects (Table 1). The clamp-derived glucose disposal rate differed as expected between groups, with steady-state values in lean subjects 10.2 ± 0.7 and in diabetic subjects 5.5 ± 0.7 mg·kg−1·min−1 (P < 0.0001). Expressed per kilograms of fat-free mass these values were 0.18 ± 0.02 and 0.10 ± 0.02, respectively (P = 0.004).
Hemodynamics and cardiac work.
We observed expected effects of the insulin-glucose clamp on systemic hemodynamics and cardiac work (Table 2). Heart rate (P = 0.04) and blood pressures (P = 0.01 - 0.007) were modestly increased at steady state of the insulin infusion compared with the equivalent time point of the control study day. The hemodynamic measures derived from the transthoracic impedance measures were also affected in expected ways by the insulin clamp. The stroke index was significantly increased (P = 0.03); cardiac index and systemic vascular resistance were unchanged; and the increase in left cardiac work index approached the threshold of significance (P = 0.07). Only the blood pressure effects of the insulin clamp differed between control and T2DM participants.
PET results.
The main parameters of interest for this study were myocardial blood flow and oxygen consumption (both derived from the acetate tracer) and myocardial fatty acid utilization [Patlak rate constant (Ki) and fatty acid oxidation rates]. The results of these analyses are presented in Figs. 2 and 3. The effects of insulin on systemic hemodynamics and cardiac work (Table 2) were also evident in the PET measures as an increase in perfusion and an increase in oxygen consumption (Fig. 2). These effects were observed in both groups of participants and did not differ between groups.
Fig. 2.
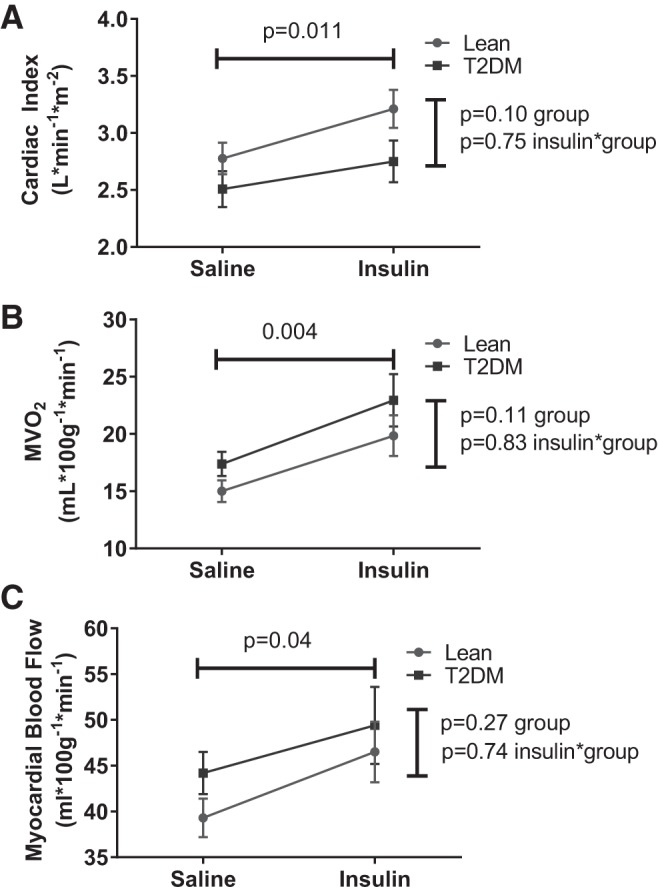
Effects of insulin on cardiac work and perfusion. Statistical comparisons indicate main effects (horizontal line: insulin vs. saline, combining study groups; vertical line: lean vs. diabetes, combining treatments) or the interaction term (evaluating whether the insulin effect differed by study group). A: cardiac index. B: myocardial oxygen consumption (MV̇o2). C: myocardial blood flow. T2DM, type 2 diabetes mellitus.
Fig. 3.

Effects of insulin on myocardial fatty acid dynamics. Statistical comparisons indicate main effects (horizontal line: insulin vs. saline, combining study groups; vertical line: lean vs. diabetes, combining treatments) or the interaction term (evaluating whether the insulin effect differed by study group). A: FTP. B: NEFA, nonesterified fatty acids (NEFA). C: fatty acid oxidation (FAO). D: FAO/MV̇o2.
Values for Ki and fatty acid oxidation rate were different between groups under control conditions (higher among diabetic participants; Fig. 3). Insulin significantly suppressed fatty acids in both groups, although the achieved fatty acid concentrations remained elevated among diabetic participants under steady-state insulin exposure (NEFA 28.4 ± 9.1 μmol/l lean; 85.0 ± 10.2 T2DM; P = 0.001). Under these insulin-stimulated, low NEFA conditions, net fatty acid uptake (Patlak Ki) was significantly increased in both groups (Fig. 3) and numerically but not significantly higher in T2DM. Together these factors produced a persisting significantly elevated fatty acid oxidation rate in T2DM even under high-dose insulin exposure. Although the between-group differences in fatty acid oxidation rates did not achieve significance when comparing all values (P = 0.07), the rates were significantly different under steady-state insulin clamp conditions (fatty acid oxidation at steady state: 0.13 ± 0.14 μmol·100 g−1·min−1 lean vs. 0.49 ± 0.15 μmol·100 g−1·min−1 T2DM; P = 0.005).
There were modest between-group differences in the measures of cardiac work, not achieving statistical significance (Table 2; Fig. 2); there were no group differences in the effects of insulin on cardiac work. Adjusting fatty acid oxidation for cardiac work did not materially change the overall result regardless of whether the selected measure of work was MV̇o2 (Fig. 3), cardiac index, or left cardiac work index (not shown), with higher work-adjusted fatty acid oxidation values in T2DM than controls.
We explored a number of potential contributors to the baseline and insulin-induced changes in fatty acid oxidation, including age, sex, race/ethnicity, baseline fatty acid and glucose concentrations, insulin-stimulated glucose disposal rate (i.e., insulin resistance), myocardial oxygen consumption, and myocardial blood flow. Including these parameters in a sequence of multivariable regression analyses (not shown), the only significant independent determinants of fatty acid oxidation were NEFA concentrations and glucose disposal rate (both P < 0.001). These parameters exerted effects in addition to the effect of insulin in the analyses of insulin-induced change in fatty acid oxidation (not shown).
One expected effect of changes in fuel substrate is a change in myocardial efficiency, i.e., work done per unit oxygen consumed. We therefore analyzed measures of cardiac work relative to the insulin-induced shift in fuel utilization. Figure 4 presents these analyses using cardiac index and left ventricular work index derived from the impedance cardiography measures, which were correlated with MV̇o2. Under saline and insulin-treated conditions there were differences in these measures of work between control and T2DM participants (Table 2 and Fig. 2), in the setting of nonsignificantly higher myocardial oxygen consumption in T2DM (Fig. 2). Reduced myocardial efficiency in T2DM compared with controls was observed in both saline and insulin conditions (Fig. 4). Fatty acid oxidation rates normalized by MV̇o2 were elevated in T2DM compared with controls in both saline and insulin conditions (Fig. 3), suggesting enhancement of fatty acid oxidation rates in T2DM in disproportion to the metabolic requirement. However, acute fuel shifts away from fatty acid utilization and changes in cardiac function and work induced by the insulin-glucose clamp reduced myocardial efficiency to a greater extent in T2DM (Fig. 4).
Fig. 4.
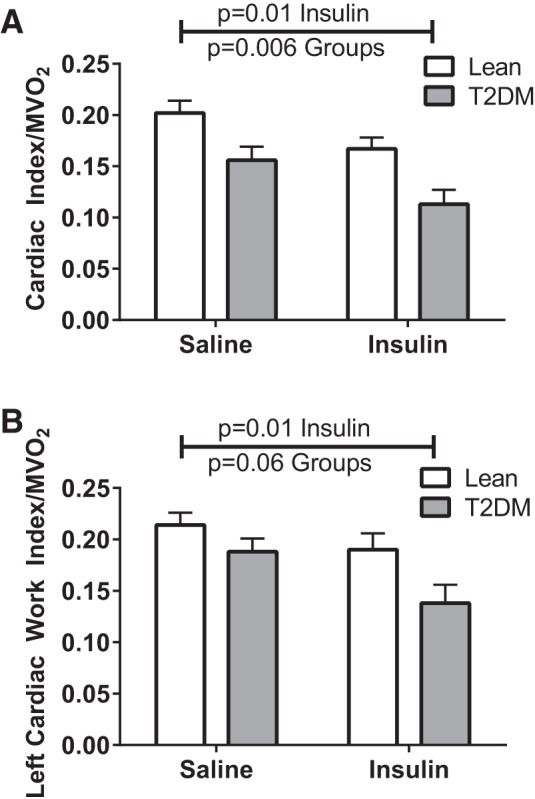
Cardiac work efficiency. Statistical comparisons indicate main effects (“Insulin” denotes insulin vs. saline, combining study groups; “Groups” indicates lean vs. T2DM, combining treatments). A: cardiac index/MV̇o2. B: left cardiac work index/MV̇o2.
DISCUSSION
Using PET and a metabolically trapped probe of mitochondrial β-oxidation (FTP), we have demonstrated elevated rates of fatty acid oxidation in T2DM under saline-treated and insulin-glucose clamp conditions. Insulin treatment resulted in reductions in fatty oxidation in both control and T2DM participants but the achieved rates of myocardial fatty oxidation remained elevated in T2DM compared with controls. This arose due to the combined effects of higher rates of FTP trapping (Ki) and less effective insulin-induced suppressions of fatty acid availability in T2DM. We also observed impaired myocardial work efficiency in T2DM.
Metabolic flexibility in the heart.
The concept of metabolic inflexibility was originally proposed as a phenomenon of impaired fuel switching in skeletal muscle in obesity and diabetes but applies equally to fuel selection in the heart. Given the energy needs of the heart and an existing preference for fatty acid fuel sources, it is not obvious a priori that obesity-related differences in fatty acid availability and uptake would be detrimental to the myocardium. Nevertheless, many prior reports have linked obesity and insulin resistance with increased myocardial fatty acid uptake and utilization (6, 8, 10, 13, 26, 37, 38, 48, 49, 56–58, 62). Furthermore, it is apparent from a number of experimental studies limiting or augmenting fatty acid uptake that the increased fatty acid uptake can contribute to impairments in myocardial function (2, 22, 25, 28, 34, 44, 48, 50, 51, 59, 73).
Our data implicate abnormalities in myocardial fatty acid transport in addition to failure to suppress adipose fatty acid release in the excess fatty acid uptake and oxidation in T2DM. Diabetes-related differences were observed in the fatty acid uptake kinetic as well as in the availability of fatty acid substrate, under control and insulin-stimulated conditions, and the net difference between groups results from combined effects of both of these phenomena. These data are consistent with observations of increased myocardial fatty acid uptake in animal models of insulin resistance (12–14, 16, 37, 50, 54) and in obesity/insulin resistance in humans (40, 49, 56, 57), here extended into observations in human T2DM. In humans, PPARγ agonists and weight loss can improve the abnormally increased fatty acid uptake (29, 41, 72), suggesting this phenomenon is subject to remodeling and not a fixed feature of the diabetic state. Experimental data support diabetes-related abnormalities in myocardial content and function of CD36 and FATP, the major sarcolemmal fatty acid transport proteins (1, 9, 15, 24, 37, 46, 64, 73). Consistent with experimental evidence in animal models (1, 9, 22, 45, 73), the importance of CD36 for human myocardial fatty acid uptake was recently demonstrated in a family recognized to have CD36 deficiency (30). Lipoprotein lipase, functioning in adipocytes or in vasculature more proximal to the myocardium, has also been implicated as a contributor to the detrimental phenotype of elevated fatty acid uptake (35). Overall, the presence of combined defects in fatty acid uptake and availability presents an opportunity and a need to address both factors concurrently to rescue the obese/diabetic heart from the effects of increased fatty acid uptake.
Myocardial efficiency.
We observed reduced myocardial work efficiency in T2DM compared with lean controls. This observation is in line with data from animal models (50, 61) and from obese humans (49, 56, 58) and augments the sparse human data evaluating this feature of myocardial function in human diabetes.
We observed a further reduction in work efficiency (i.e., more oxygen consumed per unit work) with the euglycemic-hyperinsulinemic clamp. This reduction was seen in both study groups, while maintaining the between-group difference noted under baseline conditions. This was concurrent with an observed reduction in fatty acid oxidation and with an insulin-induced increase in cardiac work. This result is paradoxical since the shift from fat oxidation (requiring 0.24 mol O2/mol ATP generated) to glucose (0.16 mol O2/mol ATP generated) (43) was expected to produce an improvement in metabolic efficiency. Direct changes in cardiac work have been shown to improve efficiency (dilated cardiomyopathy treated with vasodilator) (7), reduce efficiency (healthy humans subjected to right ventricular pacing tachycardia) (71), and leave efficiency unchanged (healthy humans subjected to bicycle exercise) (65). Experimentally imposed fuel shifts have similarly produced contradictory results: In an ovine model of type 1 diabetes, insulin-induced fuel shifts were associated with a reduction in work and in oxygen consumption, producing no change in the underlying relationship of these factors (60). In humans, acute pharmacologic reduction of fatty acid availability produced a parallel reduction in work in controls but not in patients with dilated cardiomyopathy (DCM), resulting in impaired work efficiency in DCM (69). This was interpreted as evidence that the fatty acid-dependent metabolism of the DCM state was intolerant of the depletion of fatty acid fuel. Also in DCM, trimetazidine induced a shift away from fatty acid dependence and a concurrent reduction in work, with no net change in the work efficiency (70). From this we conclude that the results of this sort of experiment on integrated work and metabolism at the organ level cannot be predicted a priori based on knowledge of cellular metabolism. Further studies are needed to better define the relationships of work, fuel selection, and myocardial efficiency in obesity and diabetes.
Limitations.
Our study has a number of limitations. In our assessment of metabolic flexibility we used two tracers to evaluate total oxidative metabolism ([11C]acetate) and rates of fatty acid oxidation ([18F]FTP) but did not include a thrid tracer to allow measurement of carbohydrate metabolism. We therefore do not have concurrent direct evidence of fuel shifts toward carbohydrate use but have inferred this from the large measured reductions in fatty acid uptake and utilization and from the known effects of insulin to drive glucose uptake and utilization in the heart. We did not include a group of obese nondiabetic individuals to evaluate whether the observed effects were specific to the diabetic state. We studied a comparatively small number of participants and therefore were not powered to demonstrate potentially important but small differences between groups. Nevertheless, we observed important and highly statistically significant effects of parameters related to our main study design questions. We had an unbalanced sex distribution between groups, which was potentially important given that others have demonstrated sex-specific differences in myocardial fuel selection (57). Our population had too few female participants to allow meaningful post hoc analyses by sex, and in particular female participants were uniquely present in the T2DM group, which could have contributed to the observed between-group differences; this will require further study with sufficient sample sizes in both sexes. The specialized fatty acid tracer FTP produced a more direct measure of fatty acid oxidation rate than is provided by traditional [11C]palmitate tracer methodology but conversely did not allow us to derive rates of transport, esterification, storage, or reverse transport out of the mitochondrion from compartmental modeling such as can be done with unmodified palmitate tracers. The FTP-derived rate of fatty acid oxidation is, however, more directly and simply measured and provides a complementary set of observations that are concordant with measures that have been previously published using palmitate modeling approaches.
Conclusion.
Elevated rates of myocardial fatty acid oxidation in type T2DM arise due to combined effects of elevated rates of transport and greater substrate availability. Myocardial metabolic inflexibility was observed as a failure to fully suppress myocardial fatty acid oxidation during a hyperinsulinemic-euglycemic clamp and reflected persistently elevated rates of myocardial fatty acid transport as well as impairment of insulin-induced suppression of fatty acid availability. This was associated with reduced work efficiency in diabetes, which persisted with the shift away from fatty acid metabolism. These phenomena likely contribute to the abnormalities in myocardial function and ischemia tolerance that are seen in T2DM.
GRANTS
Support for this project was provided by National Institute of Diabetes and Digestive and Kidney Diseases Grant R21-DK-071142, with additional support from the Indiana University Clinical Research Center (M01-RR00750 and TR000006) and the Indiana University Radiology Imaging Core.
DISCLOSURES
No conflicts of interest, financial or otherwise, are declared by the authors.
AUTHOR CONTRIBUTIONS
Author contributions: K.J.M., G.D.H., and T.R.D. conception and design of research; K.J.M., K.P., W.T., R.C., A.A., B.G.-W., R.V.C., and S.M. performed experiments; K.J.M., G.D.H., K.P., W.T., R.C., A.A., B.G.-W., R.V.C., S.M., and T.R.D. analyzed data; K.J.M., G.D.H., R.V.C., and T.R.D. interpreted results of experiments; K.J.M. prepared figures; K.J.M. drafted manuscript; K.J.M., G.D.H., R.V.C., and T.R.D. edited and revised manuscript; K.J.M., G.D.H., K.P., W.T., R.C., A.A., B.G.-W., R.V.C., S.M., and T.R.D. approved final version of manuscript.
ACKNOWLEDGMENTS
We are grateful to our study volunteers for their willing participation and J. D. Tune for critical review of the manuscript.
REFERENCES
- 1.Angin Y, Steinbusch LK, Simons PJ, Greulich S, Hoebers NT, Douma K, van Zandvoort MA, Coumans WA, Wijnen W, Diamant M, Ouwens DM, Glatz JF, Luiken JJ. CD36 inhibition prevents lipid accumulation and contractile dysfunction in rat cardiomyocytes. Biochem J 448: 43–53, 2012. [DOI] [PubMed] [Google Scholar]
- 2.Baranowski M, Blachnio-Zabielska A, Zabielski P, Gorski J. Pioglitazone induces lipid accumulation in the rat heart despite concomitant reduction in plasma free fatty acid availability. Arch Biochem Biophys 477: 86–91, 2008. [DOI] [PubMed] [Google Scholar]
- 3.Baron AD, Clark MG. Role of blood flow in the regulation of muscle glucose uptake. Annu Rev Nutr 17: 487–499, 1997. [DOI] [PubMed] [Google Scholar]
- 4.Barrett EJ, Eggleston EM, Inyard AC, Wang H, Li G, Chai W, Liu Z. The vascular actions of insulin control its delivery to muscle and regulate the rate-limiting step in skeletal muscle insulin action. Diabetologia 52: 752–764, 2009. [DOI] [PMC free article] [PubMed] [Google Scholar]
- 5.Barrett EJ, Schwartz RG, Young LH, Jacob R, Zaret BL. Effect of chronic diabetes on myocardial fuel metabolism and insulin sensitivity. Diabetes 37: 943–948, 1988. [DOI] [PubMed] [Google Scholar]
- 6.Barsotti A, Giannoni A, Di Napoli P, Emdin M. Energy metabolism in the normal and in the diabetic heart. Curr Pharm Des 15: 836–840, 2009. [DOI] [PubMed] [Google Scholar]
- 7.Beanlands RS, Armstrong WF, Hicks RJ, Nicklas J, Moore C, Hutchins GD, Wolpers HG, Schwaiger M. The effects of afterload reduction on myocardial carbon 11-labeled acetate kinetics and noninvasively estimated mechanical efficiency in patients with dilated cardiomyopathy. J Nucl Cardiol 1: 3–16, 1994. [DOI] [PubMed] [Google Scholar]
- 8.Bergman BC, Tsvetkova T, Lowes B, Wolfel EE. Myocardial FFA metabolism during rest and atrial pacing in humans. Am J Physiol Endocrinol Metab 296: E358–E366, 2009. [DOI] [PMC free article] [PubMed] [Google Scholar]
- 9.Bonen A, Campbell SE, Benton CR, Chabowski A, Coort SL, Han XX, Koonen DP, Glatz JF, Luiken JJ. Regulation of fatty acid transport by fatty acid translocase/CD36. Proc Nutr Soc 63: 245–249, 2004. [DOI] [PubMed] [Google Scholar]
- 10.Borradaile NM, Schaffer JE. Lipotoxicity in the heart. Curr Hypertens Rep 7: 412–417, 2005. [DOI] [PubMed] [Google Scholar]
- 11.Buck A, Wolpers HG, Hutchins GD, Savas V, Mangner TJ, Nguyen N, Schwaiger M. Effect of carbon-11-acetate recirculation on estimates of myocardial oxygen consumption by PET. J Nucl Med 32: 1950–1957, 1991. [PubMed] [Google Scholar]
- 12.Carley AN, Atkinson LL, Bonen A, Harper ME, Kunnathu S, Lopaschuk GD, Severson DL. Mechanisms responsible for enhanced fatty acid utilization by perfused hearts from type 2 diabetic db/db mice. Arch Physiol Biochem 113: 65–75, 2007. [DOI] [PubMed] [Google Scholar]
- 13.Carley AN, Severson DL. Fatty acid metabolism is enhanced in type 2 diabetic hearts. Biochim Biophys Acta 1734: 112–126, 2005. [DOI] [PubMed] [Google Scholar]
- 14.Carley AN, Severson DL. What are the biochemical mechanisms responsible for enhanced fatty acid utilization by perfused hearts from type 2 diabetic db/db mice? Cardiovasc Drugs Ther 22: 83–89, 2008. [DOI] [PubMed] [Google Scholar]
- 15.Chabowski A, Gorski J, Glatz JF, Luiken JJ, Bonen A. Protein-mediated fatty acid uptake in the heart. Curr Cardiol Rev 4: 12–21, 2008. [DOI] [PMC free article] [PubMed] [Google Scholar]
- 16.Coort SL, Bonen A, van der Vusse GJ, Glatz JF, Luiken JJ. Cardiac substrate uptake and metabolism in obesity and type-2 diabetes: role of sarcolemmal substrate transporters. Mol Cell Biochem 299: 5–18, 2007. [DOI] [PMC free article] [PubMed] [Google Scholar]
- 17.Critchley LA. Impedance cardiography. The impact of new technology. Anaesthesia 53: 677–684, 1998. [DOI] [PubMed] [Google Scholar]
- 18.DeFronzo RA, Tobin JD, Andres R. Glucose clamp technique: a method for quantifying insulin secretion and resistance. Am J Physiol Endocrinol Metab Gastrointest Physiol 237: E214–E223, 1979. [DOI] [PubMed] [Google Scholar]
- 19.DeGrado TR, Kitapci MT, Wang S, Ying J, Lopaschuk GD. Validation of 18F-fluoro-4-thia-palmitate as a PET probe for myocardial fatty acid oxidation: effects of hypoxia and composition of exogenous fatty acids. J Nucl Med 47: 173–181, 2006. [PubMed] [Google Scholar]
- 20.DeGrado TR, Moka DC. Non-beta-oxidizable omega-[18F]fluoro long chain fatty acid analogs show cytochrome P-450-mediated defluorination: implications for the design of PET tracers of myocardial fatty acid utilization. Int J Rad Appl Instrum B 19: 389–397, 1992. [DOI] [PubMed] [Google Scholar]
- 21.DeGrado TR, Wang S, Holden JE, Nickles RJ, Taylor M, Stone CK. Synthesis and preliminary evaluation of (18)F-labeled 4-thia palmitate as a PET tracer of myocardial fatty acid oxidation. Nucl Med Biol 27: 221–231, 2000. [DOI] [PubMed] [Google Scholar]
- 22.Dirkx E, Schwenk RW, Glatz JF, Luiken JJ, van Eys GJ. High fat diet induced diabetic cardiomyopathy. Prostaglandins Leukot Essent Fatty Acids 85: 219–225, 2011. [DOI] [PubMed] [Google Scholar]
- 23.Giedd KN, Bergmann SR. Fatty acid imaging of the heart. Curr Cardiol Rep 13: 121–131, 2011. [DOI] [PubMed] [Google Scholar]
- 24.Gimeno RE, Ortegon AM, Patel S, Punreddy S, Ge P, Sun Y, Lodish HF, Stahl A. Characterization of a heart-specific fatty acid transport protein. J Biol Chem 278: 16039–16044, 2003. [DOI] [PubMed] [Google Scholar]
- 25.Glatz JF, Angin Y, Steinbusch LK, Schwenk RW, Luiken JJ. CD36 as a target to prevent cardiac lipotoxicity and insulin resistance. Prostaglandins Leukot Essent Fatty Acids 88: 71–77, 2013. [DOI] [PubMed] [Google Scholar]
- 26.Govindarajan G, Hayden MR, Cooper SA, Figueroa SD, Ma L, Hoffman TJ, Stump CS, Sowers JR. Metabolic derangements in the insulin-resistant heart. J Cardiometab Syndr 1: 102–106, 2006. [DOI] [PubMed] [Google Scholar]
- 27.Greenberg BH, Hermann DD, Pranulis MF, Lazio L, Cloutier D. Reproducibility of impedance cardiography hemodynamic measures in clinically stable heart failure patients. Congest Heart Fail 6: 74–80, 2000. [DOI] [PubMed] [Google Scholar]
- 28.Guleria RS, Singh AB, Nizamutdinova IT, Souslova T, Mohammad AA, Kendall JA Jr, Baker KM, Pan J. Activation of retinoid receptor-mediated signaling ameliorates diabetes-induced cardiac dysfunction in Zucker diabetic rats. J Mol Cell Cardiol 57: 106–118, 2013. [DOI] [PMC free article] [PubMed] [Google Scholar]
- 29.Hallsten K, Virtanen KA, Lonnqvist F, Janatuinen T, Turiceanu M, Ronnemaa T, Viikari J, Lehtimaki T, Knuuti J, Nuutila P. Enhancement of insulin-stimulated myocardial glucose uptake in patients with Type 2 diabetes treated with rosiglitazone. Diabet Med 21: 1280–1287, 2004. [DOI] [PubMed] [Google Scholar]
- 30.Hames KC, Vella A, Kemp BJ, Jensen MD. Free fatty acid uptake in humans with CD36 deficiency. Diabetes 63: 3606–3614, 2014. [DOI] [PMC free article] [PubMed] [Google Scholar]
- 31.Hutchins GD, Chen T, Carlson KA, Fain RL, Winkle W, Vavrek T, Mock BH, Zipes DP. PET imaging of oxidative metabolism abnormalities in sympathetically denervated canine myocardium. J Nucl Med 40: 846–853, 1999. [PubMed] [Google Scholar]
- 32.Kelley DE, Goodpaster B, Wing RR, Simoneau JA. Skeletal muscle fatty acid metabolism in association with insulin resistance, obesity, and weight loss. Am J Physiol Endocrinol Metab 277: E1130–E1141, 1999. [DOI] [PubMed] [Google Scholar]
- 33.Kelley DE, Mandarino LJ. Fuel selection in human skeletal muscle in insulin resistance: a reexamination. Diabetes 49: 677–683, 2000. [DOI] [PubMed] [Google Scholar]
- 34.Keung W, Ussher JR, Jaswal JS, Raubenheimer M, Lam VH, Wagg CS, Lopaschuk GD. Inhibition of carnitine palmitoyltransferase-1 activity alleviates insulin resistance in diet-induced obese mice. Diabetes 62: 711–720, 2013. [DOI] [PMC free article] [PubMed] [Google Scholar]
- 35.Kim MS, Wang Y, Rodrigues B. Lipoprotein lipase mediated fatty acid delivery and its impact in diabetic cardiomyopathy. Biochim Biophys Acta 1821: 800–808, 2012. [DOI] [PubMed] [Google Scholar]
- 36.Knuuti J, Takala TO, Nagren K, Sipila H, Turpeinen AK, Uusitupa MI, Nuutila P. Myocardial fatty acid oxidation in patients with impaired glucose tolerance. Diabetologia 44: 184–187, 2001. [DOI] [PubMed] [Google Scholar]
- 37.Koonen DP, Glatz JF, Bonen A, Luiken JJ. Long-chain fatty acid uptake and FAT/CD36 translocation in heart and skeletal muscle. Biochim Biophys Acta 1736: 163–180, 2005. [DOI] [PubMed] [Google Scholar]
- 38.Kota SK, Kota SK, Jammula S, Panda S, Modi KD. Effect of diabetes on alteration of metabolism in cardiac myocytes: therapeutic implications. Diabetes Technol Ther 13: 1155–1160, 2011. [DOI] [PubMed] [Google Scholar]
- 39.Kovacs P, Stumvoll M. Fatty acids and insulin resistance in muscle and liver. Best Pract Res Clin Endocrinol Metab 19: 625–635, 2005. [DOI] [PubMed] [Google Scholar]
- 40.Labbe SM, Grenier-Larouche T, Noll C, Phoenix S, Guerin B, Turcotte EE, Carpentier AC. Increased myocardial uptake of dietary fatty acids linked to cardiac dysfunction in glucose-intolerant humans. Diabetes 61: 2701–2710, 2012. [DOI] [PMC free article] [PubMed] [Google Scholar]
- 41.Labbe SM, Noll C, Grenier-Larouche T, Kunach M, Bouffard L, Phoenix S, Guerin B, Baillargeon JP, Langlois MF, Turcotte EE, Carpentier AC. Improved cardiac function and dietary fatty acid metabolism after modest weight loss in subjects with impaired glucose tolerance. Am J Physiol Endocrinol Metab 306: E1388–E1396, 2014. [DOI] [PubMed] [Google Scholar]
- 42.Larsen TS, Aasum E. Metabolic (in)flexibility of the diabetic heart. Cardiovasc Drugs Ther 22: 91–95, 2008. [DOI] [PubMed] [Google Scholar]
- 43.Lewandowski E, Ingwall J. The physiological chemistry of energy production in the heart. In: Hurst's The Heart, edited by Schlant R, O'Rourke R, Roberts R, Sonnenblick E. New York: McGraw-Hill, 1994, p. 153–164. [Google Scholar]
- 44.Luiken JJ. Sarcolemmal fatty acid uptake vs. mitochondrial beta-oxidation as target to regress cardiac insulin resistance. Appl Physiol Nutr Metab 34: 473–480, 2009. [DOI] [PubMed] [Google Scholar]
- 45.Luiken JJ, Arumugam Y, Dyck DJ, Bell RC, Pelsers MM, Turcotte LP, Tandon NN, Glatz JF, Bonen A. Increased rates of fatty acid uptake and plasmalemmal fatty acid transporters in obese Zucker rats. J Biol Chem 276: 40567–40573, 2001. [DOI] [PubMed] [Google Scholar]
- 46.Luiken JJ, Bonen A, Glatz JF. Cellular fatty acid uptake is acutely regulated by membrane-associated fatty acid-binding proteins. Prostaglandins Leukot Essent Fatty Acids 67: 73–78, 2002. [DOI] [PubMed] [Google Scholar]
- 47.Mather KJ, Lteif AA, Veeneman E, Fain R, Giger S, Perry K, Hutchins GD. Role of endogenous ET-1 in the regulation of myocardial blood flow in lean and obese humans. Obesity (Silver Spring) 18: 63–70, 2010. [DOI] [PubMed] [Google Scholar]
- 48.Mazumder PK, O'Neill BT, Roberts MW, Buchanan J, Yun UJ, Cooksey RC, Boudina S, Abel ED. Impaired cardiac efficiency and increased fatty acid oxidation in insulin-resistant ob/ob mouse hearts. Diabetes 53: 2366–2374, 2004. [DOI] [PubMed] [Google Scholar]
- 49.McGill JB, Peterson LR, Herrero P, Saeed IM, Recklein C, Coggan AR, Demoss AJ, Schechtman KB, Dence CS, Gropler RJ. Potentiation of abnormalities in myocardial metabolism with the development of diabetes in women with obesity and insulin resistance. J Nucl Cardiol 18: 421–429; quiz 432–423, 2011. [DOI] [PMC free article] [PubMed] [Google Scholar]
- 50.Menard SL, Croteau E, Sarrhini O, Gelinas R, Brassard P, Ouellet R, Bentourkia M, van Lier JE, Des Rosiers C, Lecomte R, Carpentier AC. Abnormal in vivo myocardial energy substrate uptake in diet-induced type 2 diabetic cardiomyopathy in rats. Am J Physiol Endocrinol Metab 298: E1049–E1057, 2010. [DOI] [PubMed] [Google Scholar]
- 51.Nemanich S, Rani S, Shoghi K. In vivo multi-tissue efficacy of peroxisome proliferator-activated receptor-gamma therapy on glucose and fatty acid metabolism in obese type 2 diabetic rats. Obesity (Silver Spring) 21: 2522–2529, 2013. [DOI] [PMC free article] [PubMed] [Google Scholar]
- 52.Ng CK, Huang SC, Schelbert HR, Buxton DB. Validation of a model for [1–11C]acetate as a tracer of cardiac oxidative metabolism. Am J Physiol Heart Circ Physiol 266: H1304–H1315, 1994. [DOI] [PubMed] [Google Scholar]
- 53.Ng Y, Moberly SP, Mather KJ, Brown-Proctor C, Hutchins GD, Green MA. Equivalence of arterial and venous blood for [11C]CO2-metabolite analysis following intravenous administration of 1-[11C]acetate and 1-[11C]palmitate. Nucl Med Biol 40: 361–365, 2013. [DOI] [PMC free article] [PubMed] [Google Scholar]
- 54.Oakes ND, Thalen P, Aasum E, Edgley A, Larsen T, Furler SM, Ljung B, Severson D. Cardiac metabolism in mice: tracer method developments and in vivo application revealing profound metabolic inflexibility in diabetes. Am J Physiol Endocrinol Metab 290: E870–E881, 2006. [DOI] [PubMed] [Google Scholar]
- 55.Patlak CS, Blasberg RG, Fenstermacher JD. Graphical evaluation of blood-to-brain transfer constants from multiple-time uptake data. J Cereb Blood Flow Metab 3: 1–7, 1983. [DOI] [PubMed] [Google Scholar]
- 56.Peterson LR, Herrero P, Schechtman KB, Racette SB, Waggoner AD, Kisrieva-Ware Z, Dence C, Klein S, Marsala J, Meyer T, Gropler RJ. Effect of obesity and insulin resistance on myocardial substrate metabolism and efficiency in young women. Circulation 109: 2191–2196, 2004. [DOI] [PubMed] [Google Scholar]
- 57.Peterson LR, Saeed IM, McGill JB, Herrero P, Schechtman KB, Gunawardena R, Recklein CL, Coggan AR, DeMoss AJ, Dence CS, Gropler RJ. Sex and type 2 diabetes: obesity-independent effects on left ventricular substrate metabolism and relaxation in humans. Obesity (Silver Spring) 20: 802–810, 2012. [DOI] [PMC free article] [PubMed] [Google Scholar]
- 58.Peterson LR, Soto PF, Herrero P, Mohammed BS, Avidan MS, Schechtman KB, Dence C, Gropler RJ. Impact of gender on the myocardial metabolic response to obesity. JACC Cardiovasc Imaging 1: 424–433, 2008. [DOI] [PMC free article] [PubMed] [Google Scholar]
- 59.Pulinilkunnil T, Kienesberger PC, Nagendran J, Sharma N, Young ME, Dyck JR. Cardiac-specific adipose triglyceride lipase overexpression protects from cardiac steatosis and dilated cardiomyopathy following diet-induced obesity. Int J Obes (Lond) 38: 205–215, 2014. [DOI] [PubMed] [Google Scholar]
- 60.Ramanathan T, Morita S, Huang Y, Shirota K, Nishimura T, Zheng X, Hunyor SN. Glucose-insulin-potassium solution improves left ventricular energetics in chronic ovine diabetes. Ann Thorac Surg 77: 1408–1414, 2004. [DOI] [PubMed] [Google Scholar]
- 61.Ramanathan T, Shirota K, Morita S, Nishimura T, Huang Y, Zheng X, Hunyor S. Left ventricular oxygen utilization efficiency is impaired in chronic streptozotocin-diabetic sheep. Cardiovasc Res 55: 749–756, 2002. [DOI] [PubMed] [Google Scholar]
- 62.Rider OJ, Cox P, Tyler D, Clarke K, Neubauer S. Myocardial substrate metabolism in obesity. Int J Obes (Lond) 37: 972–979, 2013. [DOI] [PubMed] [Google Scholar]
- 63.Rigo P, de Landsheere C, Melon P, Kulbertus H. Imaging of myocardial metabolism by positron emission tomography. Cardiovasc Drugs Ther Pharmacotherapy 4, Suppl 4: 847–851, 1990. [DOI] [PubMed] [Google Scholar]
- 64.Samovski D, Sun J, Pietka T, Gross RW, Eckel RH, Su X, Stahl PD, Abumrad NA. Regulation of AMPK activation by CD36 links fatty acid uptake to beta-oxidation. Diabetes 64: 353–359, 2015. [DOI] [PMC free article] [PubMed] [Google Scholar]
- 65.Sorensen J, Valind S, Andersson LG. Simultaneous quantification of myocardial perfusion, oxidative metabolism, cardiac efficiency and pump function at rest and during supine bicycle exercise using 1-11C-acetate PET–a pilot study. Clin Physiol Funct Imaging 30: 279–284, 2010. [DOI] [PubMed] [Google Scholar]
- 66.Storlien L, Oakes ND, Kelley DE. Metabolic flexibility. Proc Nutr Soc 63: 363–368, 2004. [DOI] [PubMed] [Google Scholar]
- 67.Sun KT, Yeatman LA, Buxton DB, Chen K, Johnson JA, Huang SC, Kofoed KF, Weismueller S, Czernin J, Phelps ME, Schelbert HR. Simultaneous measurement of myocardial oxygen consumption and blood flow using [1-carbon-11]acetate. J Nucl Med 39: 272–280, 1998. [PubMed] [Google Scholar]
- 68.Timmer SA, Lubberink M, Germans T, Gotte MJ, ten Berg JM, ten Cate FJ, van Rossum AC, Lammertsma AA, Knaapen P. Potential of [11C]acetate for measuring myocardial blood flow: Studies in normal subjects and patients with hypertrophic cardiomyopathy. J Nucl Cardiol 17: 264–275, 2010. [DOI] [PubMed] [Google Scholar]
- 69.Tuunanen H, Engblom E, Naum A, Nagren K, Hesse B, Airaksinen KE, Nuutila P, Iozzo P, Ukkonen H, Opie LH, Knuuti J. Free fatty acid depletion acutely decreases cardiac work and efficiency in cardiomyopathic heart failure. Circulation 114: 2130–2137, 2006. [DOI] [PubMed] [Google Scholar]
- 70.Tuunanen H, Engblom E, Naum A, Nagren K, Scheinin M, Hesse B, Juhani Airaksinen KE, Nuutila P, Iozzo P, Ukkonen H, Opie LH, Knuuti J. Trimetazidine, a metabolic modulator, has cardiac and extracardiac benefits in idiopathic dilated cardiomyopathy. Circulation 118: 1250–1258, 2008. [DOI] [PubMed] [Google Scholar]
- 71.Ukkonen H, Tops L, Saraste A, Naum A, Koistinen J, Bax J, Knuuti J. The effect of right ventricular pacing on myocardial oxidative metabolism and efficiency: relation with left ventricular dyssynchrony. Eur J Nucl Med Mol Imaging 36: 2042–2048, 2009. [DOI] [PubMed] [Google Scholar]
- 72.van der Meer RW, Rijzewijk LJ, de Jong HW, Lamb HJ, Lubberink M, Romijn JA, Bax JJ, de Roos A, Kamp O, Paulus WJ, Heine RJ, Lammertsma AA, Smit JW, Diamant M. Pioglitazone improves cardiac function and alters myocardial substrate metabolism without affecting cardiac triglyceride accumulation and high-energy phosphate metabolism in patients with well-controlled type 2 diabetes mellitus. Circulation 119: 2069–2077, 2009. [DOI] [PubMed] [Google Scholar]
- 73.Yang J, Sambandam N, Han X, Gross RW, Courtois M, Kovacs A, Febbraio M, Finck BN, Kelly DP. CD36 deficiency rescues lipotoxic cardiomyopathy. Circ Res 100: 1208–1217, 2007. [DOI] [PubMed] [Google Scholar]
- 74.Yokoyama I, Yonekura K, Ohtake T, Kawamura H, Matsumoto A, Inoue Y, Aoyagi T, Sugiura S, Omata M, Ohtomo K, Nagai R. Role of insulin resistance in heart and skeletal muscle F-18 fluorodeoxyglucose uptake in patients with non-insulin-dependent diabetes mellitus. J Nucl Cardiol 7: 242–248, 2000. [DOI] [PubMed] [Google Scholar]
- 75.Zhang L, Keung W, Samokhvalov V, Wang W, Lopaschuk GD. Role of fatty acid uptake and fatty acid beta-oxidation in mediating insulin resistance in heart and skeletal muscle. Biochim Biophys Acta 1801: 1–22, 2010. [DOI] [PubMed] [Google Scholar]