

Abstract
Temperature changes affect metabolism on acute, acclamatory, and evolutionary time scales. To better understand temperature's affect on metabolism at these different time scales, we quantified cardiac oxidative phosphorylation (OxPhos) in three Fundulus taxa acclimated to 12 and 28°C and measured at three acute temperatures (12, 20, and 28°C). The Fundulus taxa (northern Maine and southern Georgia F. heteroclitus, and a sister taxa, F. grandis) were used to identify evolved changes in OxPhos. Cardiac OxPhos metabolism was quantified by measuring six traits: state 3 (ADP and substrate-dependent mitochondrial respiration); E state (uncoupled mitochondrial activity); complex I, II, and IV activities; and LEAK ratio. Acute temperature affected all OxPhos traits. Acclimation only significantly affected state 3 and LEAK ratio. Populations were significantly different for state 3. In addition to direct effects, there were significant interactions between acclimation and population for complex I and between population and acute temperature for state 3. Further analyses suggest that acclimation alters the acute temperature response for state 3, E state, and complexes I and II: at the low acclimation temperature, the acute response was dampened at low assay temperatures, and at the high acclimation temperature, the acute response was dampened at high assay temperatures. Closer examination of the data also suggests that differences in state 3 respiration and complex I activity between populations were greatest between fish acclimated to low temperatures when assayed at high temperatures, suggesting that differences between the populations become more apparent at the edges of their thermal range.
Keywords: enzyme complexes, mitochondria, oxidative phosphorylation, state 3, fundulus
mitochondria produce the majority of cellular ATP through the oxidative phosphorylation (OxPhos) pathway. The OxPhos pathway comprises five enzyme complexes; these complexes contain 89 proteins encoded by 76 nuclear and all 13 mitochondrial protein genes (41). A diversity of ectotherms have adaptive nucleotide substitutions in the mitochondrial OxPhos proteins, which are affected by thermal environments (1, 9, 16, 30, 32, 39, 57, 59, 60). OxPhos function is also affected by adaptive differences in mRNA expression in Fundulus heteroclitus (28, 55, 56). The mRNA expression changes are related to changes in protein expression (40) and explain up to 82% of the variation in cardiac metabolism (29). These data showing adaptive changes in animals from flies to humans highlight OxPhos' biological importance. Yet OxPhos' adaptive importance is a function of environmental conditions, especially temperature (36, 37), and these environmental conditions could modulate the importance of evolved differences among populations (8).
Lower temperatures decrease chemical reactions and diffusion rates. Thus, at cold temperatures, ectotherms need to counteract slower enzymatic reactions and oxygen diffusion rates to maintain normal physiological function (7, 24, 27). In contrast, warm temperatures increase basal metabolic rates, which results in a higher oxygen demand and leads to reduced aerobic scope (37). Consequently, tradeoffs exist for responses to cold and warm environmental temperatures. In cold environments, organisms tend to increase their basal metabolic rate, while warm environments require a decreased basal metabolic rate (4, 20, 38). These acclimation differences (increases at cold and decreases at warm acclimation temperatures) can affect acute responses; specifically, acclimation alters the temperature response curve (44–46): warm acclimation shifts the preferred temperatures to the right (18), increases the critical thermal maximum (17), and reduces the effect (decrease in the slope) of acute temperature for mitochondrial respiration (4, 12) or critical swimming speeds (11). These thermal performance differences reflect metabolic changes due to genetic differences among populations, as well as both acclimation and acute physiological responses (44, 45).
Metabolic rate depends on mitochondrial function, which is affected by both physiological acclimation and evolved changes. F. heteroclitus is distributed along a steep thermal cline (∼1°C/degree latitude; Fig. 1), where two major mitochondrial haplotypes with five nonsynonymous substitutions co-occur. A “northern” haplotype, common in populations north of the Hudson River, and a “southern” haplotype, common in populations south of the Hudson River (54). In previous studies, cold temperature acclimation enhanced northern F. heteroclitus mitochondrial respiration levels more than that of its warmer southern counterpart, and acclimation altered the acute temperature effect (12). These data support earlier findings (33, 34), that physiological acclimation has little phylogenetic constraint, and further suggest that physiological adjustment alters the acute response. Based on these observations, one should expect significant interaction between acute temperature change, acclimation, and evolved differences among populations as related to OxPhos metabolism.
Fig. 1.

Three Fundulus populations with mean annual temperatures. F. heteroclitus population are from Maine (ME) and Georgia (GA). F. grandis (Fg) is from the Florida panhandle in the Gulf of Mexico.
Differences between organisms in cold and warm environments should be reflected in OxPhos because of its importance in ATP production. Thus we expect F. heteroclitus individuals living along a thermal cline to have biologically adaptive differences that enable optimal OxPhos function at different temperatures. To better understand OxPhos function in different thermal environments, we investigated acclimation and acute temperature effects in different Fundulus populations. Specifically, we investigated the effect of acclimation to 12 and 28°C in three Fundulus taxa (populations or species groups): northern and southern F. heteroclitus populations and a F. grandis population. Northern and southern F. heteroclitus populations were used to explore differences within species, and F. grandis was included to explore differences between species (Fig. 1). We investigated how acclimation temperature modulates acute temperature effects by quantifying OxPhos function in heart ventricles at three assay temperatures (12, 20, and 28°C). These three temperatures represent the mean spring and summer temperature range for natural Fundulus populations. Because F. grandis populations naturally experience temperatures similar to the F. heteroclitus Georgia (GA) populations, we expected similar acclimation and acute temperature effects, despite the greater phylogenetic distance. Heart mitochondrial function is an important indicator of an organism's ability to adapt to different temperatures and constrains thermal range expansion (22, 23). The data presented here add to the understanding of temperature's effect on mitochondrial respiration by providing data on six OxPhos respiration parameters (state 3, E state, complexes I, II and IV, and LEAK ratio). Furthermore, similar to previous published data on mitochondrial respiration (4, 12), these data demonstrate that acclimation temperature affects acute temperature response. There are two surprising results from our studies not captured in previous reviews (44, 45): 1) while evolved differences between populations alter thermal response, these differences are only evident at specific acclimation temperatures (for state 3, E state, and complex I); and, most importantly, 2) the acute temperature response is muted for temperatures similar to the acclimation temperature (for state 3, E state, and complexes I and II). These results help explain how acclimation tends to mitigate acute responses (45).
MATERIALS AND METHODS
Experimental Animals
Adult F. heteroclitus were collected during the summer months from northern and southern locations. The northern individuals were collected from two locations, Wiscassett, Maine (ME) (43°57′15.10“N, 69°43′13.64”W) and Mount Desert Island, ME (44°25′29.04“N, 68°19′38.83”W), but these two collections were treated as one northern population. The southern population was collected from Sapelo Island, GA (31°27′13.39“N, 81°21′47.65”W). The sister taxa F. grandis was collected from Crawfordville, Florida (FL) (30°04′48.72“N, 84°10′43.47”W). The southern populations, GA F. heteroclitus and F. grandis, inhabit similar thermal environments with mean summer temperatures of 29.8 and 29.6°C, respectively, while the northern ME population experiences mean summer temperatures of 17.4°C (calculated from National Oceanic and Atmospheric Administration, National Estuarine Research Reserve System, Sapelo Island, GA; Apalachicola, FL; and Wells, ME). The warm-adapted southern populations experience daily average seawater temperatures ranging from 7 to 31°C while the cold-adapted northern population experiences temperatures ranging from −1.4 to 28°C (National Oceanic and Atmospheric Administration, National Estuarine Research Reserve System).
All fish were kept at 20°C for 4 wk, then acclimated to either 12 or 28°C for 4 wk. They were exposed to a 14-h light cycle, kept at 15 parts per thousand salinity and fed twice a day, 7 days/wk. Housing and protocols were in compliance with the University of Miami Institutional Animal Care and Use Committee (IACUC) guidelines.
Field work was completed within publically available lands, and no permission was required for access. F. heteroclitus does not have endangered or protected status, and small marine minnows do not require collecting permits for noncommercial purposes. All fish were captured in minnow traps with little stress and removed in <1 h. IACUC-approved procedures were used for acclimation and nonsurgical tissue sampling. Fish were killed by pithing and decapitation, using procedures approved by IACUC.
High-Resolution Respirometry
Tissue permeabilization.
Heart ventricles were dissected, cut into quarters, and three quarters were placed into a muscle relaxation solution [10 mM Ca-EGTA buffer, 0.1 μM free calcium, 20 mM imidazole, 20 mM taurine, 50 mM potassium-2-(N-morpholino)ethanesulfonic acid MES, 0.5 mM DTT, 6.56 mM MgCl2, 5.77 mM ATP, 15 mM phosphocreatine, pH 7.1] (13). The last quarter was saved for future RNA work. The tissues were too small to accurately weigh. Hearts were cut anteriorly/posteriorly and dorsally/ventrally, and pieces were randomized for each assay. The amount of tissue in the respirometer was estimated by determining the DNA concentration for each quarter (see below). Before respiration was measured, each tissue was permeabilized using 0.25% saponin solution for 15 min, followed by four washes in relaxation solution for 5 min each (31). Once permeabilized, tissues were immediately transferred to the respirometry chambers containing a respiration medium (5 mM EGTA, 3 mM MgCl2·6H2O, 60 mM potassium-lactobionate, 20 mM taurine, 10 mM KH2PO4, 20 mM HEPES, 110 mM sucrose, 0.1% BSA).
OxPhos determinations.
The acute temperature effect on mitochondrial activity was measured at three temperatures, 12, 20, and 28°C, in Miro5 media (EGTA, 0.5 mM; MgCl2, 3 mM; potassium-lactobionate, 60 mM; taurine, 20 mM; KH2PO4, 10 mM; HEPES, 20 mM, pH 7.1; sucrose, 110 mM; BSA, essentially fatty acid free, 0.1%). The pH of HEPES at 20°C was 7.1, and the pH changed by ∼0.11 pH unit at 12°C (+0.11) and 28°C (−0.11). Activity was measured and analyzed using the Oxygraph 2-k and DatLab software (Oroboros Instruments, Innsbruck, Austria). Oxygen sensors were calibrated by marking air saturation and zero oxygen concentration before all assays. Air saturation for calibration was achieved by adding Miro5 medium and then allowing oxygen concentration to stabilize. Zero oxygen concentration was achieved by adding sodium dithionite. One-quarter of the heart from each fish was used to measure activity at each of the three assay temperatures. Therefore, each fish was measured at all assay temperatures. For measurements, the order of the population, acclimation temperature, and acute temperature were all randomized.
After tissue addition to the respiration chamber, pyruvate (5 mM), glutamate (10 mM), and succinate (10 mM) were added to reach state 2 levels. This was followed by the addition of ADP (5 mM, state 3), cytochrome c (10 μM, to check mitochondrial membrane integrity), oligomycin (2 μg/ml, to block complex V), FCCP (a mitochondrial uncoupler used to reach E state; 0.5 μM was added sequentially until activity no longer increased), rotenone (0.5 μM to block complex I), malonate (5 mM to block complex II), antimycin A (2.5 μM to block complex III), and finally tetramethylpentadecane (TMPD) and ascorbate (artificial substrate for complex IV, 0.5 mM TMPD, and 0.2 mM ascorbate; these were kept in separate tubes) (Table 1). Background oxygen consumption levels that could arise from TMDP and ascorbate were not measured and thus, if significant, could mask significant effects. For our study, we are measuring “LEAK ratio,” which we define as state 2-to-state 3 ratio (state 2/state 3). Alternatively, it can also be calculated as state 4/state 3, since state 2 and state 4 are equivalent (no ADP, depletion of ADP, respectively) (15).
Table 1.
Oxidative phosphorylation function expressed as mean respiration rates
| Trait | Definition | Substrate or Inhibitors |
|---|---|---|
| State 3 | ADP stimulated respiration | ADP plus substrates (pyruvate, glutamate, and succinate) |
| RCR | Respiratory control ratio | State 3 (ADP + substrates)/state 2 (substrates only) |
| QC | Quality control | Cytochrome c/state 3 (per assay) |
| LEAK ratio | O2 consumption due to proton leak across membrane when no ADP is present | State 2/state 3 |
| E state | Uncoupled respiration, without limitation from complex V | FCCP, proton gradient uncoupler |
| Complex I | Complex I activity | E state activity: rotenone (complex I inhibitor) |
| Complex II | Complex II activity | Rotenone-malonic acid (complex II inhibitor) |
| Complex IV | Complex IV activity | TMPD + ascorbate (electron donors) |
Respiratory rates are O2·s−1·ml−1·ng DNA−1.
TMPD, tetramethylpentadecane.
Cytochrome c addition tests whether mitochondrial membranes were damaged during tissue isolation and cell permeabilization and was performed for each assay. Assays in which cytochrome c levels differed from state 3 by >10% were discarded. Although chambers were not made hyperoxic, oxygen levels remained above 100 nM/ml, and these lower oxygen levels had no effect on state 3 respiration (n = 7, paired t-test P value > 0.25, where the pairs comparison is between the same individual at normoxia vs. 20% oxygen).
The tissue from each chamber was recovered after respiration assays, homogenized, and total DNA was quantified from the homogenate using AccuBlue high-sensitivity double-stranded DNA quantitation solution (BIOTIUM, Hayward, CA). All activity was normalized by nanograms of DNA. OxPhos metabolic rates are reported as picomoles of O2 per second per milliliter per nanograms of DNA. Although DNA concentration, protein concentration, and cell count have a linear relationship, DNA has been found to be the most consistent way of normalizing metabolomics data across a range of cell numbers (50). Since we had small amounts of tissue that we permeabilized before assays, we recovered the tissue from the respiration chambers as the most accurate way to quantify tissue amount. Since our tissues were too small to accurately weigh, and because the respiration medium contained BSA (which interferes with protein assays), we used DNA amount to normalize.
E state activity, induced by the uncoupler FCCP, unexpectedly did not reach state 3 levels if oligomycin had been used to block complex V (ATP synthase) activity. Four different types of oligomycin and three different types of FCCP were tested for optimum E state activity. Oligomycin A from two different companies (Enzo Lifesciences and TOCRIS Bioscience), oligomycin B (ENZO Lifesciences), and a mixture of oligomycin A, B, and C (Sigma Aldrich) were tested in combination with FCCP from three different companies (Enzo Lifesciences, TOCRIS Biosciences, and Sigma Aldrich). The oligomycin mixture and the FCCP from Sigma Aldrich were the most successful combination that brought FCCP levels close to, or higher than, state 3. The other combinations had lower E states relative to state 3. Therefore, for our study, we used the mixture of oligomycin and the FCCP from Sigma Aldrich. The reason E state did not exceed state 3 is likely due to the interaction with oligomycin; when FCCP is added without oligomycin, respiration levels always equaled or exceeded state 3 levels (data not shown). FCCP starting concentrations were not too high, as FCCP was sequentially added with observed increases in E state after each addition. All data used in analyses had E state values that were at least 80% of ADP levels. Contributions to OxPhos by enzyme complexes (I, II, and IV) were measured by sequential addition of complex-specific poisons. However, the starting rate is that of the E state (complex I = E state − rotenone) (Table 1); thus these measures may reflect the additional effect of oligomycin (<20% of state 3).
The respiratory control ratio (RCR) is used to quality check tissues used for respiration analysis. Appropriate RCR ratios change, depending on organism and tissue type (14). We included all data with an RCR of 2.5 or higher (Fig. 2). These RCR values are consistent with other publications using heart tissues in ectotherms (2, 21).
Fig. 2.
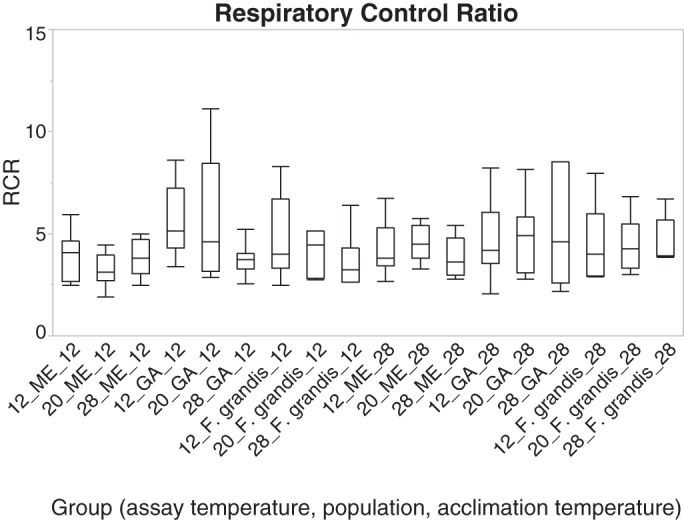
Box plot of respiratory control ratio (RCR) for each “group” of individuals tested. The first number for the group label is the assay temperature, followed by population, and then followed by acclimation temperature. Plot includes mean and 25 and 75% quartile and range.
Statistical Analyses
A three-way mixed-model analysis was performed with all factors: population, acclimation temperature, and assay temperature (JMP; SAS, Cary, NC). Body mass (Tables 2 and 3) often affects metabolic physiology (10, 42), and, to correct for variation in body masses, we included body mass as a covariate in our mixed model.
Table 2.
Population sample sizes and body masses
| ME | GA | Fg | |
|---|---|---|---|
| Total sample size, n | 59 | 61 | 49 |
| Sample 12°C acclimation, n | 33 | 30 | 24 |
| Sample size 28°C acclimation, n | 26 | 31 | 25 |
| Average body mass, g | 7.86 | 8.35 | 10.34 |
| SE of the mean | 0.30 | 0.42 | 0.62 |
n, No. of fish. ME, Maine F. heteroclitus; GA, Georgia F. heteroclitus; Fg, F. grandis.
Table 3.
Three-way ANOVA for acclimation, population, and assay temperature and all interactions
| Body Mass Effect |
Treatment P Values |
||||||||
|---|---|---|---|---|---|---|---|---|---|
| Threeway | Mass slope | P value | Acc | Pop | Acute | Acc × Pop × Assay | Acc × Pop | Acc × Assay | Pop × Assay |
| State 3 | 0.063 | 0.096 | 0.033 | 0.042 | <0.0001 | 0.271 | 0.065 | 0.463 | 0.030 |
| E state | 0.065 | 0.090 | 0.139 | 0.162 | <0.0001 | 0.175 | 0.105 | 0.717 | 0.207 |
| Complex I | 0.066 | 0.013 | 0.085 | 0.121 | <0.0001 | 0.197 | 0.017 | 0.373 | 0.131 |
| Complex II | −0.022 | 0.882 | 0.363 | 0.289 | <0.0001 | 0.091 | 0.523 | 0.633 | 0.477 |
| Complex IV | −0.086 | 0.098 | 0.762 | 0.116 | <0.0001 | 0.244 | 0.641 | 0.814 | 0.811 |
| LEAK 2/3 | 0.004 | 0.178 | 0.018 | 0.255 | 0.004 | 0.594 | 0.643 | 0.139 | 0.960 |
Acc, acclimation; Pop, population; Assay, assay temperature.
Significant P values are in bold. Body mass effects are the slope and the significance of this slope.
The analysis was performed on six important traits: state 3 (substrates and ADP), E state (uncoupled mitochondrial activity with FCCP), complex I activity, complex II activity, complex IV activity, and LEAK ratio. LEAK reflects the number of protons that “leak” across the membrane where the creation of a proton gradient consumes O2 but does not produce ATP (15). In our study, LEAK ratio is measured as state 2/state 3 (Table 1). Although the three-way mixed-model analysis gives us a comprehensive overview (Table 4 and Fig. 3), to explore the more intricate patterns that exist between treatments, we performed separate analyses to examine patterns between two treatments with the third factor as a covariate or random factor. Notice that we are using two-way ANOVAs with one treatment as a covariate to better understand the data, yet with these analyses, there are three ANOVAs for acute temperature effects, three ANOVAs for population, and two ANOVAs for acclimation. If we were to provide multiple correction for these separate ANOVAs, a Bonferroni's corrected critical P value of 0.05, would equal 0.017 for acute and population effects or 0.025 for acclimation. There is no appreciable difference in our results using this more stringent P value.
Table 4.
Population and acclimation effects
| State 3 | E State | Complex I | Complex II | Complex IV | LEAK | |
|---|---|---|---|---|---|---|
| Population significance at each acclimation temperature | ||||||
| Effect of population | ||||||
| P value at 12°C acclimation | 0.006 | 0.025 | 0.007 | 0.343 | 0.094 | 0.332 |
| P value at 28°C acclimation | 0.771 | 0.916 | 0.872 | 0.326 | 0.566 | 0.661 |
| Acclimation significance for each population | ||||||
| Effect of acclimation | ||||||
| P value for ME | 0.228 | 0.502 | 0.345 | 0.852 | 0.314 | 0.084 |
| P value for GA | 0.433 | 0.378 | 0.614 | 0.157 | 0.862 | 0.422 |
| P value for Fg | 0.017 | 0.051 | 0.017 | 0.570 | 0.882 | 0.162 |
P values for significant effects are in bold.
Fig. 3.

Complete dataset for six measured traits. Graphs are separated by acclimation temperature. Within each panel are the population and the assay temperature of measured individuals. Shaded background indicates 12°C acclimation, and white background indicates 28°C acclimation. Green lines, F. grandis; red and blue lines, GA and ME F. heteroclitus populations, respectively. Values are means ± SE. Assay temperature is always significant (P < 0.05). See Table 3 for other P values. Lines are to aid in the identification of the three populations and acute effects and are not a regression.
In Figs. 2–6, the data for these analyses are presented with untransformed numbers for clarity, but statistical analyses were performed with body mass and other factors as covariates. A linear regression was used to analyze each population's response to acute temperature change. Clearly, acute responses typically have an exponential rise (44, 45), but, for our limited range of acute temperatures, a linear model was found to be the best fit. Post hoc analyses were performed using Tukey's test, which corrects for multiple comparisons, to identify which means are different.
Fig. 6.

Difference in OxPhos between populations at different acclimation temperatures: 12°C (shaded background) and 28°C (white background). Green lines, F. grandis; red and blue lines, GA and ME F. heteroclitus populations, respectively. Values are means ± SE. *Significant effect of population at each acclimation temperature (P < 0.05).
RESULTS
The six OxPhos functions are quantified by measuring oxygen consumption rates with substrate addition, or poison inhibition (Table 1): state 3 (ADP-stimulated respiration); E state (uncoupled mitochondrial activity with the dissolution of the H+ gradient); complexes I, II, and IV; and LEAK ratio (respiration limited by the leakage of H+ back into the mitochondrial matrix). DNA concentration was used to correct for differences in the amount of tissue used for each assay.
Cytochrome c addition did not affect respiration [the average cytochrome c-to-state 3 ratio was 1.03 (SE 0.009)], indicating the functional integrity of the outer mitochondrial membranes. A separate measure of functional coupling for OxPhos is RCR (state 3/state 2). RCR determinations, which measure respiration dependency on ADP, are shown in Fig. 2. The mean RCR was 4.14 (SE 0.26) across all groups, indicating intact OxPhos respiratory chain.
Table 2 provides the sample sizes (for individuals used in analysis) and body masses for the three populations: ME and GA F. heteroclitus and F. grandis from the Gulf of Mexico. Body masses ranged from 3.2 to 25.9 g. Body mass often affects metabolic physiology (10, 42), and, to correct for variation in body masses, we included body mass as a covariate in our mixed model. The effect of body mass was only significant for complex I (P value < 0.05), and the P values for body mass effects for state 3 and E state are between 0.05 and 0.1 (Table 3). We use body mass as a covariate to avoid potential population bias due to body mass and to keep all analyses consistent.
OxPhos Functions
We performed a mixed-model analysis using acclimation temperature, population, and acute temperature change and their interactions (Table 3). Acute temperature significantly affected all six OxPhos determinations. Acclimation and population had significant effects for state 3, and, additionally, acclimation had a significant effect on LEAK ratio. The interaction of acclimation and population was significant for complex I, and the interaction of population and assay temperature was significant for state 3. All data are present in Fig. 3. Tukey's post hoc test reveals significant differences among all three acute temperatures for all six OxPhos functions except LEAK. For LEAK, 12°C is different from 28°C.
Acute and Acclimation Temperature Interactions
To better understand the effect of acclimation temperature on the acute response, we minimized the effect of populations by using mixed-model residuals with population as a covariate and compared the effect of acute temperature for each of the two acclimation temperatures. The P values for these analyses are shown in Fig. 4, but the data graphed are raw values (i.e., graphs do not use residual values, and graphs with residuals are not substantially different). For state 3, E state, and complexes I and II, these analyses show a consistent pattern: assays at 12 and 20°C are similar at the low-acclimation temperature, and assays at 20 and 28°C are similar at the high-acclimation temperature (see “aab”/“dcc” significance patterns, Fig. 4). Complex IV and LEAK show a change with acute temperature, but with little difference between acclimation temperatures. These patterns for state 3, E state, and complexes I and II suggest that, with cold acclimation, cooler assay temperatures have less effect, and, with warm acclimation, warmer assay temperatures have less effect. If we include population in the analysis (Fig. 3), we can see that this pattern is still evident for most populations at each measured trait. Thus, even though acclimation only significantly affects state 3 and LEAK in our mixed model (Table 3), acclimation may play a role in OxPhos sensitivity to acute temperature changes.
Fig. 4.

The effect of acclimation and assay temperature on oxidative phosphorylation (OxPhos) functions. Acclimation at 12°C is depicted by a shaded dashed line. Acclimation at 28°C is depicted by a black solid line. Values are means ± SE. a,b,c,d|Differences between assay temperature: a,b|12°C acclimation, c,d|28°C acclimation. *Significant effect of assay temperature at each acclimation temperature (P < 0.05). Lines are to aid in the identification of the two acclimation groups and acute effects and are not a regression.
Acute Temperature and Population Interactions
To better understand the difference among populations, we statistically minimized the acclimation effect by using the mixed-model residuals with acclimation as a covariate. While the graphs (Fig. 5) display raw values (i.e., not using the residuals), the P values reflect differences in slopes between each population using these acclimation residuals. In general, acute temperature change affected all six OxPhos traits (Table 3). However, when broken down by population, acute response differences were observed among populations. This was determined by comparing linear regression slopes between assay temperature and population. The acute response for F. grandis was significantly stronger for state 3 and complex I, but the trend is seen in all other traits, excluding LEAK. For the ME F. heteroclitus population, the acute temperature change slope was similar to the slope for the GA F. heteroclitus population. Complex II was the only trait where, unlike for GA F. heteroclitus and F. grandis, the slope for ME F. heteroclitus was marginally insignificant. With the exception of LEAK, F. grandis always had the steeper slope with the largest deviation from the two F. heteroclitus populations occurring at the 28°C measurement.
Fig. 5.

The effect of acute temperature change on OxPhos. Values are means ± SE. P values represent significant differences between slopes (*P value < 0.05). Green lines, F. grandis; red and blue lines, GA and ME F. heteroclitus populations, respectively. Regression is significant for all populations (P < 0.01), for state 3, E state, complex I, and complex IV. For complex II, regression is only significant (P < 0.01) for the GA and F. grandis populations. Regression was only significant in the GA population for LEAK (P < 0.01).
Acclimation and Population Interactions
Acclimation effects were significant for state 3 and LEAK (Table 3). Because acclimation and population showed a significant interaction for complex I, we examined their relationship separately by using residuals from assay temperature. This approach is similar to correcting for body mass and appears to be appropriate because these residuals are unaffected by assay temperatures. The significance of the differences among populations or between acclimation temperatures is shown in Table 4. Significant OxPhos differences among populations occur only at the 12°C acclimation temperature; there are no significant differences among populations at 28°C acclimation (Table 4, top, and Fig. 6). At 12°C acclimation, three OxPhos functions are significantly different among populations: state 3, E state, and complex I. In all cases, ME is less than F. grandis, and GA is intermediate (Fig. 6). Thus differences among populations are a function of acclimation temperature.
When looking at how acclimation affects the different populations, there was no significant acclimation effect on OxPhos respiration in the two F. heteroclitus populations (Table 4, bottom). However, acclimation did significantly affect state 3 and complex I in the F. grandis population; therefore F. grandis is the driving force for the significant differences between acclimation temperatures.
DISCUSSION
To investigate the effect of temperature on adaptation of cardiac metabolism, we examined six different OxPhos functions (Tables 1 and 3) among three Fundulus populations (northern and southern F. heteroclitus and F. grandis) acclimated to two temperatures and assayed at three acute temperatures. In general, acute temperature affected OxPhos function (Fig. 3 and Table 3), and acclimation temperature had a significant effect on state 3 and LEAK ratio, while population only had a significant effect on state 3. There were also significant interactions between acclimation and population for complex I and between population and acute temperature for state 3. Yet the influence of acclimation on both acute temperature sensitivity and differences among populations was seen in subsequent ANOVA analyses, where only acclimation and acute temperature were considered (Figs. 4 and 6). These analyses revealed that, when population is removed as a parameter (through the use of residuals), the acute temperature response curve shape was dependent on acclimation temperature (Fig. 4). In addition, significant population differences are restricted to low-acclimation temperatures (Fig. 6), are larger at higher acute temperatures (Fig. 5), and mostly reflect genetic distance: ME F. heteroclitus < GA F. heteroclitus < F. grandis. These patterns are similar to those for state 3 measured in livers: there are few differences among fish acclimated to 5, 15, and 25°C, and differences between ME and GA populations were more apparent when acclimated to low temperatures and assayed at 25°C and above (12). Chung and Schulte (4) showed that, in a northern population from Nova Scotia, acclimated to 33°C, state 3 respiration is reduced overall, and acclimation to this high temperature reduced the acute temperature effects.
State 3 showed an interaction between population and acute temperature in our mixed-model analysis (Table 3). When acclimation was removed as a parameter (using residuals), the slope of the acute response was different between F. heteroclitus (ME and GA) and F. grandis (Figs. 4 and 5 and Table 4, bottom), although this is only significant for state 3 when all parameters were included (Table 3 and Fig. 3). Acclimation only had a significant effect on OxPhos function for state 3 and LEAK ratio (Fig. 3, Tables 3 and 4). These data suggest that both acclimation and differences among populations account for changes in acute responses such that, in the ME F. heteroclitus population, a rapid or acute temperature change results in a less dramatic increase in metabolic demand at seasonal low temperatures than it would for F. grandis. Our supposition is that these conditions (low, long-term, or seasonal temperatures with high acute temperatures) expose potential evolutionary differences that define a species' thermal niche space.
Acute Temperature Responses
One of the more important observations presented here is how acclimation alters the acute response curve shape. Thermal performance curves provide insights into the environmental-genetic interactions that shape an organism's physiology (44–46). Schulte (44, 45) makes an important distinction between acute and acclimation thermal response: acute responses provide insight into the biochemistry and biophysics of temperature effects, and acclimation tends to mitigate these responses. That is, acclimation is a physiological process that compensates for the chemical and physical temperature effects. Our data support this supposition. For the data presented here, we only have three acute temperatures, all within the normal range of Fundulus' thermal environment. While these three acute temperatures do not provide the breadth of temperatures needed to fully describe a thermal performance curve (45, 46), they do provide insight on how acclimation alters an acute response.
Acclimation, while rarely a significant factor for the six OxPhos functions, mitigated acute temperature effects when measured near the acclimation temperatures (Fig. 4). Thus there are no significant acute temperature effects at low temperatures using cardiac tissue from fish acclimated to low temperature, nor between high acute temperatures when fish were acclimated to high temperature. Specifically, acute temperature significantly affected all six OxPhos functions, yet for state 3, E state, and complexes I and II, there is little difference between 12 and 20°C OxPhos function when fish were acclimated to 12°C, nor did acute temperature have much affect on 20 and 28°C OxPhos function when fish were acclimated to 28°C. Although the statistics were performed using residuals from population, a similar pattern is seen when considering all parameters (Fig. 3). These data reflect a similar pattern seen in F. heteroclitus whole metabolic rates, where there is no acute effect between 5 and 10°C when fish were acclimated to 5°C, and the steepest acute effects occur above 15°C (12). Yet our data on cardiac state 3 respiration are different from liver state 3 respiration, where the response was dampened only at high acute temperatures at all acclimation temperatures (4, 12). The reduced acute response is not due to technical problems since this pattern occurs in all three populations, and the dampened acute response happens at both low and high assay temperatures, depending on the acclimation conditions. Additionally, these patterns are observed in many individuals in three separate populations, making them unlikely to be spurious. Yet these patterns are different from those observed in similar F. heteroclitus studies that measure OxPhos state 3 metabolism (4, 12, 46). These other studies used pooled livers from several individuals and examined a wider range of acclimation (5, 15, and either 25 or 33°C) and acute temperatures, providing a more thorough description of temperature performance curves. Thus the acute response dampening we observed is unlikely to be due to the difference in the range of temperature per se, but may reflect differences among tissues. We used cardiac tissue because, along with neural tissue, it is most susceptible to deleterious mutations in OxPhos that affect human health (51). Cardiac tissue has also been shown to affect teleosts' thermal ranges as they have narrow thermal limits (22, 23). This sensitivity to alteration in OxPhos proteins likely reflects dependency of high aerobic metabolism. If the different acute responses are due to tissue-specific responses, it suggests that acclimation more strongly buffers acute response in cardiac tissues than in liver tissues. How this is achieved could provide insights into mitigating deleterious effects on OxPhos metabolism.
OxPhos Metabolism Reliance on Enzyme Complexes
State 3 measures OxPhos metabolism-mitochondrial respiration with substrates and ADP. State 3 respiration depends on complex V (ATP synthase) depleting the intermembrane proton gradient, thus allowing hydrogen pumping and electrons to pass from complex I or complex II through complex III and then to complex IV, which reduces O2 to H2O. It should be noted that state 3 also has a “leak” component, which is incorporated in all our measurements; protons may still leak through the membrane and enhance O2 consumption (this should not be confused with our measured “LEAK ratio”). With little limitation by complex V activity, changes in state 3 will be mirrored in E state (respiration unconstrained by complex V, ATP synthase). In our data, state 3 and E state are tightly correlated (correlation coefficient 0.977). Thus, for our data, we can investigate how state 3 or E state depends on complexes I-IV. Significant differences among populations for state 3 and E state are associated with changes only in complex I (Table 4, bottom): complex II and IV were not significantly different among populations. The lack of significant differences in complexes II and IV when there is a significant difference in state 3 and E state suggests that changes in these enzyme complexes are less important. Although acute temperature changes and population differences affect complex II similarly to complex I, the lack of significance in complex II activity reflects a lower mean without a similar decrease in individual variation. Complex IV is unlike state 3, E state, and complex I: how acclimation and population affect the acute temperature response shows a different and nonsignificant pattern for complex IV. Importantly, similar to complex II, individual variation is also larger (SD > 2-fold) for complex IV. These data suggest that many differences in OxPhos function among populations and treatments are more dependent on complex I than the other enzyme complexes, and the lack of significant difference for complexes II and IV is related to individual or technical variation.
A linear regression is a statistically strong approach to define the relationship between state 3 and the enzyme complexes and LEAK. A linear regression between state 3 and these other OxPhos factors shows a significant relationship independent of acute temperatures. We removed the effect of acute temperatures because similar OxPhos responses to acute temperatures could create spurious relationships. Complexes I, II, IV, and LEAK have a significant relationship with state 3 (P < 0.05, linear regression). The relative importance of each of these OxPhos functions reflects their statistical significances [the R2 for complex I (69%) > complex II (62%) > complex IV (23%) > LEAK (3%)]. Thus most variation in state 3 is explained by the variation in complexes I and II. This relative importance is reflected in a stepwise regression: complexes I and II are the only significant factors in the stepwise regression, and together they explain 90% of the state 3 variance (P value to be included in the equation < 0.0001). Thus, similar to the ANOVA, complex I is the most important OxPhos function affecting OxPhos respiration (state 3), followed by complex II.
The dependence of OxPhos metabolism, measured as state 3 respiration, on complex I is similar to the importance of this enzyme complex when Fundulus is acclimated to 33°C; at this high acclimation temperature, state 3 suppression depends on complex I (4). The importance of complex I is seen across acclimation temperatures and among populations and thus represents environmental and evolutionary impacts on OxPhos. The strong association between complex I and state 3 is different from investigations of metabolic control, which suggest that control coefficients are spread among the respiratory complex (reviewed in Ref. 26). These studies focus on a single vertebrate and tissue-specific differences. Integrating these observations with our data suggests that the variation in complex I is more likely to effect an evolutionary change. This makes sense if much adaptive variation is from standing genetic variation, because complex I has 46 protein subunits (vs. <20 for the other complexes) and thus would have more targets for functional polymorphisms to occur. That is, with more proteins, there are more nucleotides that could contain important polymorphisms.
Evolved Population Differences
Population differences were a function of both assay and acclimation temperatures (Figs. 5 and 6). State 3, E state, and complex I were greater in F. grandis than ME F. heteroclitus, and the GA F. heteroclitus population was intermediate between these two populations. Yet these differences only occur at the 12°C acclimation temperature (Table 4, top, and Fig. 6) and were largest at the high acute temperature (Fig. 5). Although acclimation temperature influences the significant difference between populations, it had little effect on the F. heteroclitus populations (Table 4, bottom). These results are similar to differences among Drosophila simulans haplotypes, which are apparent only at low acute temperatures (32). Additionally, Fangue et al. (12) found differences between northern and southern F. heteroclitus populations at all acclimation temperatures, but only at certain assay temperatures. Our assay temperatures did not include temperatures below 12°C, and we, therefore, did not observe differences between populations at the lower assay temperatures (2.5–10°C) that were observed by Fangue et al. (12). Also consistent with their data, the southern populations used in our study, F. grandis, and GA F. heteroclitus, had higher respiration rates when significant differences were present at 12°C acclimation and 28°C assay temperature.
Population differences could be due to heritable (evolved), developmental, or epigenetic effects. Development at one environmental temperature affects adult metabolic rates, and there is always a possibility of epigenetic changes (3, 25). In fish, there is a complex interaction between acclimation and irreversible developmental effects (25, 43, 48). For example, developmental temperatures alter adult growth and enzyme expression in response to acclimation (25, 43, 48). In contrast, while thermal sensitivity of swimming performance is reduced at the developmental temperature, this effect is not maintained after acclimation, suggesting that the magnitude of developmental plasticity's effect is limited relative to thermal acclimation. Although we cannot rule out irreversible developmental or maternal effects, we propose that many of the significant differences in OxPhos function likely have a heritable genetic basis. First, acclimation in fish reaches a steady state after 3–4 wk (19, 49), and developmental plasticity on swimming performance is largely eliminated with acclimation (48), suggesting that maintaining fish for 4 wk to a common temperature removes most developmental effects. Second, in Fundulus, many physiological determinations are a function of genetic distance within and among species, especially for biochemical traits that affect metabolism (5, 6, 28, 40, 55, 56). Third, variations in these traits are higher when a population has greater genetic variation (47). Importantly, variations in these traits affect changes in metabolism (29, 35), suggesting that the differences in these biochemical traits manifest physiological changes. Fourth, specific DNA changes are associated with enhanced metabolic and biochemical functions (6, 58). Finally, acclimation had the largest effect on F. grandis, which shares a similar thermal environment with southern (GA) F. heteroclitus. However, both F. heteroclitus populations were relatively insensitive to acclimation. This pattern would require complex population-specific developmental effects. These observations for Fundulus suggest that much of metabolism, including mitochondrial-dependent respiration (OxPhos), has a strong heritable component. Assuming that many of the differences are heritable, the data suggest that F. heteroclitus has evolved to be less sensitive to both acclimation temperature and acute temperature than its sister taxa F. grandis.
The greater differences between populations at the low acclimation temperature shown here and in other F. heteroclitus studies (12), the small effect of acclimation to 5 or 15°C (4), combined with our data showing that ME and GA F. heteroclitus were insensitive to acclimation temperature, indicate that F. heteroclitus has evolved mechanisms to be less sensitive to acute and acclimatory temperature changes. We speculate this is due to change in both protein sequence and expression. The greater OxPhos function in F. grandis vs. ME F. heteroclitus only at the low acclimation temperature (Fig. 6) suggests OxPhos protein expression differences in F. grandis: either a quantitative difference in the expression or a change in isozymes. Yet the largest difference between ME F. heteroclitus and F. grandis occurs at the 28°C assay temperature, with little difference at the 12°C assay temperature (Fig. 5). The enzyme complexes and the 89 proteins making up these complexes have different sensitivities when acclimated to low or high temperatures. Unlike acclimation, these acute effects are unlikely due to changes in expression. Instead, this acute change could reflect differences in the sensitivity of the proteins: ME and GA F. heteroclitus are less sensitive to acute change, whereas F. grandis is much more sensitive. We speculate that this could occur by altering the importance of hydrogen and ionic vs. hydrophobic interactions among the proteins that make up the OxPhos enzyme complexes or changing the mitochondrial membrane where these enzymes function. At low temperatures, hydrogen or ionic bonds would have to play a more important role in maintaining protein stability and flexibility, and at higher temperatures greater thermal stability would occur with a greater reliance on hydrophobic interactions (20). The balance of these can be altered by a few amino acid substitutions (52, 53), and, because a large number of proteins (∼89) are involved in the five OxPhos enzyme complexes, many opportunities exist to balance interactions and maintain catalysis across a broad temperature range. The differences between populations are dependent on acclimation effects. These differences reflect both a change in OxPhos proteins and their sensitivity to acute temperature change and the effect of acclimation on the expression of these proteins.
Perspectives and Significance
The data presented here suggest that acclimation, while rarely a significant factor on OxPhos functions, alters the acute temperature response when measured near the acclimation temperatures. This is seen within acclimation temperatures, where acute effects are dampened at temperatures similar to acclimation temperatures, and across acclimation temperatures, where higher acclimation temperatures are less sensitive to acute changes. Thus these data support the supposition that acute responses provide insight into the biochemistry and biophysics of temperature effects, and acclimation tends to mitigate these responses (44, 45). These changes in mitochondrial respiration are most reliant on complex I and to a lesser degree complex II.
GRANTS
This work was supported by the National Science Foundation Grant MCB 1434565.
DISCLOSURES
No conflicts of interest, financial or otherwise, are declared by the author(s).
AUTHOR CONTRIBUTIONS
Author contributions: T.Z.B., D.L.C., and M.F.O. conception and design of research; T.Z.B. performed experiments; T.Z.B., D.L.C., and M.F.O. analyzed data; T.Z.B., D.L.C., and M.F.O. interpreted results of experiments; T.Z.B. prepared figures; T.Z.B., D.L.C., and M.F.O. drafted manuscript; T.Z.B., D.L.C., and M.F.O. edited and revised manuscript; T.Z.B., D.L.C., and M.F.O. approved final version of manuscript.
ACKNOWLEDGMENTS
Special thanks go to Pierre Blier and Chris Wood for input on the manuscript.
REFERENCES
- 1.Ballard JW, Kreitman M. Unraveling selection in the mitochondrial genome of Drosophila. Genetics 138: 757–772, 1994. [DOI] [PMC free article] [PubMed] [Google Scholar]
- 2.Boudina S, Sena S, O'Neill BT, Tathireddy P, Young ME, Abel ED. Reduced mitochondrial oxidative capacity and increased mitochondrial uncoupling impair myocardial energetics in obesity. Circulation 112: 2686–2695, 2005. [DOI] [PubMed] [Google Scholar]
- 3.Campos C, Valente LM, Fernandes JM. Molecular evolution of zebrafish dnmt3 genes and thermal plasticity of their expression during embryonic development. Gene 500: 93–100, 2012. [DOI] [PubMed] [Google Scholar]
- 4.Chung DJ, Schulte PM. Mechanisms and costs of mitochondrial thermal acclimation in a eurythermal killifish (Fundulus heteroclitus). J Exp Biol 218: 1621–1631, 2015. [DOI] [PubMed] [Google Scholar]
- 5.Crawford DL, Oleksiak MF. The biological importance of measuring individual variation. J Exp Biol 210: 1613–1621, 2007. [DOI] [PubMed] [Google Scholar]
- 6.Crawford DL, Pierce VA, Segal JA. Evolutionary physiology of closely related taxa: analyses of enzyme expression. Am Zool 39: 389–400, 1999. [Google Scholar]
- 7.Crawford DL, Powers DA. Molecular basis of evolutionary adaptation at the lactate dehydrogenase-B locus in the fish Fundulus heteroclitus. Proc Natl Acad Sci USA 86: 9365–9369, 1989. [DOI] [PMC free article] [PubMed] [Google Scholar]
- 8.Dayan DI, Crawford DL, Oleksiak MF. Phenotypic plasticity in gene expression contributes to divergence of locally-adapted populations of Fundulus heteroclitus. Mol Ecol 24: 3345–3359, 2015. [DOI] [PubMed] [Google Scholar]
- 9.Ellison CK, Burton RS. Interpopulation hybrid breakdown maps to the mitochondrial genome. Evolution 62: 631–638, 2008. [DOI] [PubMed] [Google Scholar]
- 10.Everett MV, Crawford DL. Adaptation vs. allometry: population and body mass effects on hypoxic metabolism in Fundulus grandis. Physiol Biochem Zool 83: 182–190, 2010. [DOI] [PubMed] [Google Scholar]
- 11.Fangue NA, Mandic M, Richards JG, Schulte PM. Swimming performance and energetics as a function of temperature in killifish Fundulus heteroclitus. Physiol Biochem Zool 81: 389–401, 2008. [DOI] [PubMed] [Google Scholar]
- 12.Fangue NA, Richards JG, Schulte PM. Do mitochondrial properties explain intraspecific variation in thermal tolerance? J Exp Biol 212: 514–522, 2009. [DOI] [PubMed] [Google Scholar]
- 13.Gnaiger E, Kuznetsov A, Schneeberger S, Seiler R, Brandacher G, Steurer W, Margreiter R. Mitochondria in the cold. In: Life in the Cold, edited by Heldmaier G and Klingenspor M: Berlin: Springer, 2000, p. 431–442. [Google Scholar]
- 14.Gomes AP, Price NL, Ling AJY, Moslehi JJ, Montgomery MK, Rajman L, White JP, Teodoro JS, Wrann CD, Hubbard BP, Mercken EM, Palmeira CM, de Cabo R, Rolo AP, Turner N, Bell EL, Sinclair DA. Declining NAD(+) induces a pseudohypoxic state disrupting nuclear-mitochondrial communication during aging. Cell 155: 1624–1638, 2013. [DOI] [PMC free article] [PubMed] [Google Scholar]
- 15.Hand SC, Gnaiger E. Basic protocol with isolated mitochondria: LEAK, OXPHOS, ETS, ROX. Mito Phys Net 12: 1–5, 2014. [Google Scholar]
- 16.Harrison JS, Burton RS. Tracing hybrid Incompatibilities to single amino acid substitutions. Mol Biol Evol 23: 559–564, 2006. [DOI] [PubMed] [Google Scholar]
- 17.Healy TM, Schulte PM. Factors affecting plasticity in whole-organism thermal tolerance in common killifish (Fundulus heteroclitus). J Comp Physiol B 182: 49–62, 2012. [DOI] [PubMed] [Google Scholar]
- 18.Healy TM, Schulte PM. Thermal acclimation is not necessary to maintain a wide thermal breadth of aerobic scope in the common killifish (Fundulus heteroclitus). Physiol Biochem Zool 85: 107–119, 2012. [DOI] [PubMed] [Google Scholar]
- 19.Heap SP, Watt PW, Goldspink G. Consequences of thermal change on the myofibrillar ATPase of five freshwater teleosts. J Fish Biol 26: 733–738, 1985. [Google Scholar]
- 20.Hochachka PW, Somero GN. Biochemical Adaptation, Mechanism and Process in Physiological Evolution. New York: Oxford University Press, 2002. [Google Scholar]
- 21.Hughey CC, Hittel DS, Johnsen VL, Shearer J. Respirometric oxidative phosphorylation assessment in saponin-permeabilized cardiac fibers. J Vis Exp 48: 2431, 2011. [DOI] [PMC free article] [PubMed] [Google Scholar]
- 22.Iftikar FI, Hickey AJR. Do mitochondria limit hot fish hearts? Understanding the role of mitochondrial function with heat stress in Notolabrus celidotus. PloS One 8: e64120, 2013. [DOI] [PMC free article] [PubMed] [Google Scholar]
- 23.Iftikar FI, MacDonald JR, Baker DW, Renshaw GM, Hickey AJ. Could thermal sensitivity of mitochondria determine species distribution in a changing climate? J Exp Biol 217: 2348–2357, 2014. [DOI] [PubMed] [Google Scholar]
- 24.Johnston IA, Dunn J. Temperature acclimation and metabolism in ectotherms with particular reference to teleost fish. Symp Soc Exp Biol 41: 67–93, 1987. [PubMed] [Google Scholar]
- 25.Jonsson B, Jonsson N. Early environment influences later performance in fishes. J Fish Biol 85: 151–188, 2014. [DOI] [PubMed] [Google Scholar]
- 26.Mazat JP, Ransac S, Heiske M, Devin A, Rigoulet M. Mitochondrial energetic metabolism-some general principles. IUBMB Life 65: 171–179, 2013. [DOI] [PubMed] [Google Scholar]
- 27.O'Brien KM. Mitochondrial biogenesis in cold-bodied fishes. J Exp Biol 214: 275–285, 2011. [DOI] [PubMed] [Google Scholar]
- 28.Oleksiak MF, Churchill GA, Crawford DL. Variation in gene expression within and among natural populations. Nat Genet 32: 261–266, 2002. [DOI] [PubMed] [Google Scholar]
- 29.Oleksiak MF, Roach JL, Crawford DL. Natural variation in cardiac metabolism and gene expression in Fundulus heteroclitus. Nat Genet 37: 67–72, 2005. [DOI] [PMC free article] [PubMed] [Google Scholar]
- 30.Parmakelis A, Kotsakiozi P, Rand D. Animal mitochondria, positive selection and cyto-nuclear coevolution: insights from pulmonates. PloS One 8: e61970, 2013. [DOI] [PMC free article] [PubMed] [Google Scholar]
- 31.Pesta D, Gnaiger E. High-resolution respirometry: OXPHOS protocols for human cells and permeabilized fibers from small biopsies of human muscle. Methods Mol Biol 810: 25–58, 2012. [DOI] [PubMed] [Google Scholar]
- 32.Pichaud N, Chatelain EH, Ballard JW, Tanguay R, Morrow G, Blier PU. Thermal sensitivity of mitochondrial metabolism in two distinct mitotypes of Drosophila simulans: evaluation of mitochondrial plasticity. J Exp Biol 213: 1665–1675, 2010. [DOI] [PubMed] [Google Scholar]
- 33.Pierce VA, Crawford DL. Phylogenetic analysis of glycolytic enzyme expression. Science 276: 256–259, 1997. [DOI] [PubMed] [Google Scholar]
- 34.Pierce VA, Crawford DL. Variation in the glycolytic pathway: The role of evolutionary and physiological processes. Physiol Zool 69: 489–508, 1996. [Google Scholar]
- 35.Podrabsky JE, Javillonar C, Hand Steven C, Crawford DL. Intraspecific variation in aerobic metabolism and glycolytic enzyme expression in heart ventricles. Am J Physiol Regul Integr Comp Physiol 279: R2344–R2348, 2000. [DOI] [PubMed] [Google Scholar]
- 36.Portner HO, Schulte PM, Wood CM, Schiemer F. Niche dimensions in fishes: an integrative view. Physiol Biochem Zool 83: 808–826, 2010. [DOI] [PubMed] [Google Scholar]
- 37.Portner HO, Storch D, Heilmayer O. Constraints and trade-offs in climate-dependent adaptation: energy budgets and growth in a latitudinal cline. Scientia Marina 69: 271–285, 2005. [Google Scholar]
- 38.Prosser CL. Adaptational Biology: From Molecules to Organisms. New York: Wiley, 1986. [Google Scholar]
- 39.Rand DM. The units of selection on mitochondrial DNA. Annu Rev Ecol Syst 2001: 415–448, 2001. [Google Scholar]
- 40.Rees BB, Andacht T, Skripnikova E, Crawford DL. Population proteomics: quantitative variation within and among populations in cardiac protein expression. Mol Biol Evol 28: 1271–1279, 2011. [DOI] [PubMed] [Google Scholar]
- 41.Ryan MT, Hoogenraad NJ. Mitochondrial-nuclear communications. Annu Rev Biochem 76: 701–722, 2007. [DOI] [PubMed] [Google Scholar]
- 42.Schmidt-Neilsen K. Animal Physiology: Adaptation and Environment. New York,: Cambridge University Press, 1990. [Google Scholar]
- 43.Schnurr ME, Yin Y, Scott GR. Temperature during embryonic development has persistent effects on metabolic enzymes in the muscle of zebrafish. J Exp Biol 217: 1370–1380, 2014. [DOI] [PubMed] [Google Scholar]
- 44.Schulte PM. The effects of temperature on aerobic metabolism: towards a mechanistic understanding of the responses of ectotherms to a changing environment. J Exp Biol 218: 1856–1866, 2015. [DOI] [PubMed] [Google Scholar]
- 45.Schulte PM. What is environmental stress? Insights from fish living in a variable environment. J Exp Biol 217: 23–34, 2014. [DOI] [PubMed] [Google Scholar]
- 46.Schulte PM, Healy TM, Fangue NA. Thermal performance curves, phenotypic plasticity, and the time scales of temperature exposure. Integr Comp Biol 51: 691–702, 2011. [DOI] [PubMed] [Google Scholar]
- 47.Scott CP, Williams DA, Crawford DL. The effect of genetic and environmental variation on gene expression. Mol Ecol 18: 2832–2843, 2009. [DOI] [PMC free article] [PubMed] [Google Scholar]
- 48.Scott GR, Johnston IA. Temperature during embryonic development has persistent effects on thermal acclimation capacity in zebrafish. Proc Natl Acad Sci USA 109: 14247–14252, 2012. [DOI] [PMC free article] [PubMed] [Google Scholar]
- 49.Sidell B, Wilson FR, Hazel J, Prosser CL. Time course of thermal acclimation in goldfish. J Comp Physiol 84: 119–127, 1973. [Google Scholar]
- 50.Silva LP, Lorenzi PL, Purwaha P, Yong V, Hawke DH, Weinstein JN. Measurement of DNA concentration as a normalization strategy for metabolomic data from adherent cell lines. Anal Chem 85: 9536–9542, 2013. [DOI] [PMC free article] [PubMed] [Google Scholar]
- 51.Smeitink J, van den Heuvel L. Human mitochondrial complex I in health and disease. Am J Hum Genet 64: 1505–1510, 1999. [DOI] [PMC free article] [PubMed] [Google Scholar]
- 52.Somero GN. Proteins and temperature. Annu Rev Physiol 57: 43–68, 1995. [DOI] [PubMed] [Google Scholar]
- 53.Somero GN. Temperature and proteins: little things can mean a lot. News Physiol Sci 11: 72–77, 1996. [Google Scholar]
- 54.Whitehead A. Comparative mitochondrial genomics within and among species of killifish. BMC Evol Biol 9: 11, 2009. [DOI] [PMC free article] [PubMed] [Google Scholar]
- 55.Whitehead A, Crawford DL. Neutral and adaptive variation in gene expression. Proc Natl Acad Sci USA 103: 5425–5430, 2006. [DOI] [PMC free article] [PubMed] [Google Scholar]
- 56.Whitehead A, Crawford DL. Variation within and among species in gene expression: raw material for evolution. Mol Ecol 15: 1197–1211, 2006. [DOI] [PubMed] [Google Scholar]
- 57.Willett CS, Burton RS. Viability of cytochrome C genotypes depends on cytoplasmic backgrounds in Tigriopus californicus. Evolution 55: 1592–1599, 2001. [DOI] [PubMed] [Google Scholar]
- 58.Williams LM, Oleksiak MF. Evolutionary and functional analyses of cytochrome P4501A promoter polymorphisms in natural populations. Mol Ecol 20: 5236–5247, 2011. [DOI] [PMC free article] [PubMed] [Google Scholar]
- 59.Zhu CT, Ingelmo P, Rand DM. GxGxE for lifespan in Drosophila: mitochondrial, nuclear, and dietary interactions that modify longevity. PLoS Genet 10: e1004354, 2014. [DOI] [PMC free article] [PubMed] [Google Scholar]
- 60.Zink RM. Natural selection on mitochondrial DNA in Parus and its relevance for phylogeographic studies. Proc Biol Sci 272: 71–78, 2005. [DOI] [PMC free article] [PubMed] [Google Scholar]