


Abstract
Regulatory DNA elements, short genomic segments that regulate gene expression, have been implicated in developmental disorders and human disease. Despite this clinical urgency, only a small fraction of the regulatory DNA repertoire has been confirmed through reporter gene assays. The overall success rate of functional validation of candidate regulatory elements is low. Moreover, the number and diversity of datasets from which putative regulatory elements can be identified is large and rapidly increasing. We generated a flexible and user-friendly tool to integrate the information from different types of genomic datasets, e.g. ATAC-seq, ChIP-seq, conservation, aiming to increase the ease and success rate of functional prediction. To this end, we developed the EMERGE program that merges all datasets that the user considers informative and uses a logistic regression framework, based on validated functional elements, to set optimal weights to these datasets. ROC curve analysis shows that a combination of datasets leads to improved prediction of tissue-specific enhancers in human, mouse and Drosophila genomes. Functional assays based on this prediction can be expected to have substantially higher success rates. The resulting integrated signal for prediction of functional elements can be plotted in a build-in genome browser or exported for further analysis.
INTRODUCTION
The multitude of cell types that arise throughout animal development acquire their different morphologies and functions from the expression of distinct sets of genes. The regulation of the spatio-temporal patterns of gene expression is a highly controlled process that allows for fine-tuning at many levels (1). An important part of gene regulation occurs at the transcriptional level: the degree to which genomic DNA is transcribed into RNA by RNA polymerase II (Pol II). The promoter of a gene, consisting of the genomic sequence surrounding the transcription start site (TSS), is by itself sufficient to engage the Pol II machinery. However, typically the required level of transcription of a gene within a tissue is established through the activity of a repertoire of interacting regulatory DNA elements and their associated protein complexes. Such regulatory DNA has been found in the form of transcriptional activators, repressors, insulators and tissue-specific switches; collectively these elements have been dubbed cis-regulatory modules. The first regulatory DNA regions that were identified markedly enhanced the transcription of reporter genes and these elements are thus generally referred to as enhancers (2). Enhancers contain short DNA motifs that function as binding sites for sequence-specific transcription factors (TF). TF binding depends on chromatin accessibility and thus on chromatin remodelling proteins (reviewed in (3)). The interaction of TFs with co-activators and co-repressors leads to a complex of which the regulatory cues determine the activity of the enhancer.
Genetic variation in regulatory elements, including enhancers, the most studied representative, is heavily implicated in developmental disorders and human disease (4,5). Despite this clinical urgency, enhancer identification has been hampered by the daunting complexity of gene regulation that has been encountered and the relatively high costs of functional assays. Furthermore, the average success rate of enhancer validation studies stands at a low 55% (6). Thus far less than 1000 enhancers have been validated (6), whereas the human genome may contain as many as 100 000 enhancers (7). In terms of linear genomic DNA sequence, enhancers can be located hundreds to millions of base pairs (bp) away from their target genes (8), which makes their identification challenging. Enhancer activity is correlated with the presence of characteristic histone modifications, such as histone H3 lysine 4 monomethylation (H3K4me1) and H3 lysine 27 acetylation (H3K27ac), which make the chromatin accessible for TF-binding (3,9–11). The recruitment and activation of mediator complexes, which in turn bring Pol II into contact with the target gene promoter then results in gene transcription (12).
Traditionally, enhancer prediction methods focus on computationally matching TF-binding motifs, following the logic that TFs bind to their preferred sequences (13–17). However, the relationship between TF-binding and DNA motifs is not fully understood and results in inaccurate predictions. Typically only a small fraction of all motifs in a genome is bound by the corresponding TF in a given cell-type, which can in part be explained by context specificity and the dependency on other proteins (18).
The ChIP-seq technique can reveal the genomic locations of specific histone modifications and TF-binding events in specific tissues and has therefore been used intensively for enhancer prediction (19–21). However, a major issue with enhancer prediction through ChIP-seq is the substantial proportion of the detected regions that are not associated with enhancers, as TF-binding also occurs abundantly outside known functional contexts. Similarly, the detection of an enhancer-associated histone modification at a certain genomic site cannot always be correlated to function. Often a single ChIP-seq dataset already contains in the order of a 100 000 peaks that may or may not represent an enhancer.
The activity of regulatory DNA elements typically requires a characteristic combination of modification and occupation. This will result in a signature of overlapping signals when the respective functional genomic datasets are interrogated. This principle is the main working hypothesis upon which the EMERGE approach, that will be presented in this paper, is based. Following this logic, overlap analysis of multiple datasets can be used to narrow down the number of likely regulatory DNA candidate regions. The complexity of such overlap analyses quickly increases upon adding more datasets (Figure 1). To address this problem, EMERGE allows users to select and combine the various types of functional genomic datasets that they consider informative and then enables them to systematically score DNA co-modification and occupation; the program can then be used to visualize this overlap using an integrated genome browser (Figure 2B).
Figure 1.
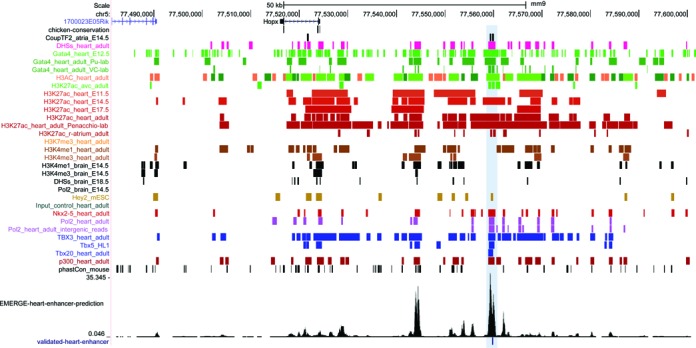
The EMERGE approach. UCSC browser view of the Hopx locus. The wealth of functional genomic data available for the heart generates a complex landscape of peaks, making it difficult to pinpoint enhancer locations. EMERGE calculates dataset overlap and collapses the signal into an overall (heart enhancer) prediction. The highlighted region denotes a strong peak in the prediction signal which coincides with a validated heart enhancer.
Figure 2.
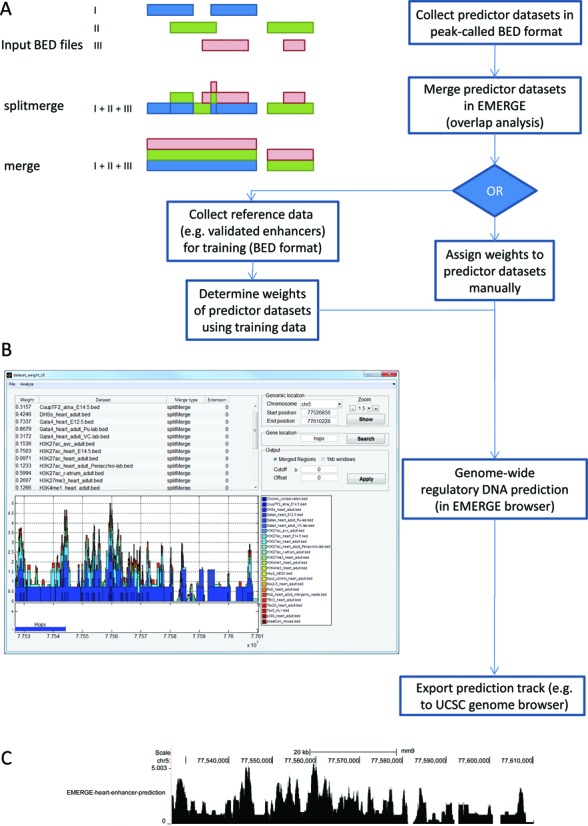
Overview of the EMERGE framework. (A) The EMERGE flowchart, including the collecting and merging of input BED files, the assignment of dataset weights for prediction and the possibility to export the resulting prediction tracks. (B) Screenshot of the graphical user interface of the EMERGE program, after the combination of the datasets shown in panel A. The build-in genome browser shows the accumulated signal at the Hopx locus. After calculation of dataset overlap, weights can be assigned to determine each set's contribution to enhancer prediction. (C) The resulting overall prediction signal can be exported for use in external tools, such as the UCSC genome browser.
The overlap principle has been used with varying success by several other enhancer prediction methods. One approach, CSI-ANN, applies pattern recognition to chromatin signatures using artificial neural networks, reporting 65.5% sensitivity and 66.3% positive predictive value (ppv) for enhancer prediction (22). Other programs using epigenetic states reported better performances: a Hidden Markov model approach reached a ppv of 80% (23), whereas a support vector machine (SVM) approach, dubbed ChromaGenSVM, recovered 88% of experimentally validated enhancers (24). However, all aforementioned methods limit their scope to histone states and miss the freedom to interrogate specific TF-pathways or to include cues from evolution. EnhancerFinder, another SVM-based program, uses multiple enhancer identification approaches, including evolutionary conservation, TF-binding, chromatin modifications and DNA-sequence motifs (25). The publication comes with a set of predicted enhancers, based on the data then available. However, the flexibility of the approach is limited as the EnhancerFinder program is not publicly available.
Existing research has mostly focused on transcriptional enhancers alone, thereby largely neglecting the complexity of gene regulation and the other classes of regulatory elements that are involved. The flexibility of EMERGE makes the program especially helpful for the identification of different classes of regulatory DNA regions, because the user can select the relevant datasets. The user can manually assign weights to the individual datasets, allowing for (research question driven) focus on specific marks of interest. Furthermore, using appropriate sets of validated functional genomic elements, a logistic regression model can be applied to maximally separate active regulatory sites from non-(active) regulatory sites. The program then automatically determines an optimal combination of dataset weights to predict active sites. The resulting overall prediction signal can be exported for use in external tools, such as the UCSC genome browser (Figure 2C). Currently, only enhancer screening efforts have generated sufficiently large reference libraries to base a modelling approach on. Therefore, we validated the automated approach of EMERGE by predicting enhancer sites, using an integrated mix of functional cues, including evolutionary conservation, DNase hypersensitivity and ChIP-seq datasets. The prohibitive costs of large scale in vivo functional reporter assays makes that this study is restricted to receiver operating characteristic (ROC) curve analysis. We used experimentally validated enhancers from human, mouse and Drosophila as training sets (6,26). In the results section we show that EMERGE only requires a limited number of datasets to reach highly reliable enhancer prediction with ROC curves that show area under the curve (AUC)-values of above 0.8 and even 0.9, outperforming commonly used approaches that solely use p300 and/or H3K27ac as enhancer markers. Comparison of the performances of different enhancer predicting approaches is difficult because the reported performances are obviously dependent on the included datasets. Overall, our method performs similar to EnhancerFinder (25), the only other method of enhancer prediction that used the VISTA enhancer database (6) to validate their data. EMERGE stands out through the flexibility in its approach; the users are free to include whichever datasets they consider relevant and, equally important, are free to use their preferred set of validated regulatory DNA elements.
MATERIALS AND METHODS
EMERGE
To start EMERGE, the user needs an inventory of predictor datasets in BED format, commonly used to denote specific genomic regions of interest (https://genome.ucsc.edu/FAQ/FAQformat.html). These predictor datasets can, for example, be peaks called in ChIP-seq experiments, DNaseI hypersensitivity (DHS) assays, evolutionary conservation, etcetera. The latest version of EMERGE and source code are available from http://download.hfrc.nl. The version of the program as described in this paper is available as Supplementary File 1.
The most basic way of combining predictor datasets in EMERGE is to apply a ‘Merge’. With this option EMERGE creates a union of the identified genomic regions resulting in the maximum spanning regions of the partially overlapping datasets (Supplemental Figure S1). This option can be useful when a limited number of datasets is used and the region density in each dataset is relatively low. A more advanced way of merging, which is preserving the original resolution of the datasets, is the ‘Split merge’ function. This function splits up the overlapping regions and thus annotates the presence of an identified region in each dataset at the exact location. This function, the default way of merging, is useful when relatively many or densely peaked datasets are used (Figure 2A).
In addition, datasets can be added that ‘Only overlap with’ the previously merged datasets. This option only adds the presence of the dataset to the previously defined regions and can be useful when the information in the dataset is not specific for the tissue of interest but has to be considered in the merge. One can think of data derived from cell lines or genomic conservation.
Interacting genomic features can be arranged next to each other on the genome, without sharing the exact same position. Therefore, we provide the user the option to extend the marked regions in each dataset with a specified length. This option ensures the detection of association of features that are in close proximity.
When the datasets are merged, the integrated genome browser shows an overview of the datasets (Figure 2B) at the user-selected gene locations. At this stage the user can manually change the weight of the individual datasets and instantly see the effect of these changes in the genome browser. The user can either view the overlap of the datasets exactly as was determined or at a scale of 1 kbp bins, which better resembles the size of regulatory elements. When dataset weights are allocated manually, the values do not have to conform to any predisposed model. The user is free to assign any value to each dataset, according to the perceived importance of the dataset in the performed study.
Alternatively, the program can determine the optimal weight to each dataset in order to predict to occurrence of a regulatory element at the site of overlap. This option requires a training set, often referred to in diagnostic research as a gold standard. This training set consists of a True Positive (TP) population and a True Negative (TN) population of the regulatory element type of which the genomic locations have to be predicted. To determine the most optimal dataset weights, their predictor coefficients, EMERGE uses the elastic net logistic regression method (27).
Elastic net logistic regression extends the least squares minimization with a term that includes the values of the predictor coefficients, β, in the minimization process. Elastic net thus solves:
 |
 |
where;
Deviance is the squared deviance of the model fit from the responses using intercept β0 and predictor coefficients β. We used a 10-fold cross validation to estimate the deviance.
N is the number of observations, p is the number of predictors.
Parameters β0 and β are scalar and p-vector, respectively
We used an α of 0.1 (has to be between 0 and 1)
Elastic net regression assigns similar β-values to correlated predictor datasets whereas normal regression would assign all weight to just one of those sets. Elastic net thus encourages a grouping effect, where strongly correlated predictors tend to be in or out of the model together. It ‘removes’ datasets that have no predictive value by assigning a low or zero weight. Moreover, this method is particularly suitable when there is a relatively large number of predicting datasets and a relatively small training set, a situation that can occur when only a small number of enhancers is validated for the tissue of interest.
The elastic net implementation of Matlab was used in EMERGE. In comparison with other regression approaches that we tried on the data, elastic net logistic regression showed the best performance (Supplemental Figure S2).
When the user is satisfied by the, manually or automatically, assigned weights, the prediction track can be exported in bedgraph format and then visualized and analysed in external tools such as the UCSC genome browser (Figure 2C).
Datasets for evaluation of EMERGE
To test enhancer prediction by EMERGE, we have selected and combined a number of enhancer predictor datasets (generated by varying techniques, such as ChIP-seq). For an overview of these datasets, see Supplemental Table S1. All the datasets that were used in this study can be downloaded as BED files from ‘http://download.hfrc.nl’ under the ‘EMERGE BED files’ header. These files are ready to be used in EMERGE and references to the source data are attached.
ChIP-seq datasets used for enhancer prediction
All datasets were downloaded as Sequence Read Archives (SRA) files and processed into FASTQ format using the open source SRA Toolkit software package (http://www.ncbi.nlm.nih.gov/books/NBK56560/). Subsequently, Bowtie (version 1.1.2) (28) was used to map reads to the appropriate reference genome assembly (mm9 for mouse, hg19 for human and dm3 for Drosophila melanogaster). To prevent genomic repeats from confounding the analysis, the ‘-m’ parameter was set to 1 (all alignments for a read are suppressed if more than 1 reportable alignment exists across the genome). For the remaining parameters the default settings were used. Peaks were called on the resulting Sequence Alignment Map (SAM) files with OccuPeak (29) using the default settings, resulting in a BED file. For some large datasets the threshold was manually adjusted to limit the number of peaks to 150 000 for the mouse genome and 30 000 for the Drosophila genome. The identified peaks were imported into EMERGE for enhancer prediction.
Additional datasets used for enhancer prediction
DHS datasets for target tissues were downloaded from ENCODE and modENCODE (7,30,31). The downloadable NARROWPEAK files were used.
Evolutionary conservation of genomic sequence has been a useful property for enhancer identification (32). As such, PhastCon files for mm9 and hg19 were downloaded from the UCSC genome browser database (PhastConsElements100way).
ChIP-on-ChIP datasets on D. melanogaster mesoderm tissue were downloaded from the Furlong laboratory website (http://furlonglab.embl.de/data/download) (33). The peaks called by the authors were directly used for EMERGE enhancer prediction.
RESULTS
Training data
We have used experimentally validated enhancers from human, mouse and Drosophila (6,26) to both train and validate the enhancer prediction by EMERGE. In the publicly available enhancer screening depositories, the tested genomic enhancer regions are annotated according to their activity per tissue. To test enhancer prediction, we defined a TP enhancer as a genomic region that has (reproducibly) been shown to display reporter gene activity within the tissue of choice (e.g. heart). The definition of a TN is less straightforward because TN populations can be defined in three different ways:
(i) Regions that tested negative in a validation study.
(ii) Validated enhancers that are not active in the target tissue.
(iii) Random genomic DNA regions of 1 kb (background).
Each of these TN classes has its own implicated strengths and weaknesses, from both theoretical and practical points of view. We discuss the pros and cons of each TN class in more detail in the discussion section of this paper.
To determine the performance of the predictive model of EMERGE, receiver operating characteristic (ROC)-curves were generated, by repeatedly fitting (25 times on a random selection of 75% of the training set and testing on the remaining 25%). The final weights are determined by fitting on the complete training dataset.
Integrating datasets improves enhancer prediction
EMERGE predicts enhancers by integrating and assigning weights to datasets generated with the purpose to identify enhancers (see Supplemental Table S1 for an overview of the datasets used). We have evaluated the performance of EMERGE by determining how accurately the program can distinguish TPs from TNs through the assignments of weights to each dataset (Figure 3A). To this end, the AUC for ROC curves was computed (Figure 3B–F).
Figure 3.

Benchmarking EMERGE performance with ROC curves. Populations of validated tissue-specific enhancers were split into training and testing data. EMERGE assigns the optimal dataset weights through modelling with an elastic net logistic regression approach on the training data. These weights are subsequently tested on the testing data. (A) Scatterplot of the modelled weights assigned to validated heart enhancers and enhancers active in other tissues, showing clearly separated distributions. This same data served to construct an ROC curve in panel B (purple line). (B–F) Plotted ROC curves of EMERGE enhancer prediction using the training data as indicated and explained in the text. Area under the curve (AUC) values are given for each ROC curve. The number of true positive training regions is indicated above the organ and species icons. The number of true negative (TN) training regions is indicated per category. (B and C) Performance of mouse enhancer prediction by EMERGE on heart (B) and brain (C) tissue. (D) Performance of Drosophila enhancer prediction by EMERGE. Regions tested negative in validation assays were used as TN reference data. (E and F) Performance of human enhancer prediction by EMERGE on heart (E) and brain (F) tissue.
A powerful AUC of 0.91 was reached when EMERGE was given all the available mouse datasets for enhancer prediction (Figure 3B). These results were reached using mouse heart enhancers as TP and other enhancers (class B) as TNs. EMERGE still reached a respectable AUC of 0.78 when validated negatives (class A TNs) were used to train the prediction. However, an almost perfect AUC of 0.97 was found when heart enhancer prediction was performed against genomic background (class C) TNs. Despite the fact that fewer brain-specific ChIP-seq datasets were available, similar AUCs were found when brain enhancers were used as TPs (Figure 3C).
Despite the scarcity of human heart ChIP-seq datasets (Supplemental Table S1), EMERGE's prediction of human heart enhancers showed a similar good performance, with AUCs reaching 0.86 or higher for all TN classes (Figure 3E). In contrast, human brain enhancer prediction was less successful, but still adequate at AUC values of 0.68 and 0.64 (Figure 3F). This decrease possibly reflects the quality of the individual human brain ChIP-seq datasets or the high diversity of enhancer-types and -signatures present in this organ (6,34). Again, when using the random genome regions as the TN population, near perfect prediction was observed (Figure 3F).
The generation of an extensively tested enhancer library for D. melanogaster by the Stark laboratory (26), provides an excellent reference database for testing enhancer prediction. Owing to the small genome size of Drosophila (∼123 Mbp), its gene regulation modules are very compactly organized. This challenges the resolution of the ChIP-seq technique, making it harder to pinpoint enhancer locations. The signal processing and subsequent enhancer prediction by EMERGE solves this problem, effectively discriminating ubiquitous enhancers (AUC 0.94) and mesoderm specific enhancers (AUC 0.8) from tested negative regions (class A TNs; Figure 3D).
Tissue-specific signatures of p300 and H3K27ac are commonly viewed as hallmarks for enhancer activity (10,35,36). Therefore, typically, studies in which enhancer screens are performed use p300 or H3K27ac ChIP-seq data as the single identification marker. We have determined the predictive value of heart-specific H3K27ac and p300 as single datasets for mouse heart enhancer prediction (versus other enhancers, TN class B) and compared this prediction to using a multitude of datasets with EMERGE (Figure 4 and Table 1). Of the single datasets, H3K27ac of E14.5 mouse hearts reached the highest AUC (0.80). The combination of all datasets by EMERGE outperforms this, even when p300 and H3K27ac are not included in the overall merge (AUC scores of 0.91). As can be appreciated from the weight parameters given in Supplemental Table S2, many datasets are roughly equally contributing to enhancer prediction. Furthermore, the combination of p300 and H3K27ac data (using EMERGE) showed only a slight improvement over the individual components. This result indicates that using solely p300 or H3K27ac for enhancer discovery is sub-optimal. When a false positive rate of 0.1 is accepted in a functional assay (vertical dotted line in Figure 4), the single dataset prediction will only detect 50% of the TP elements. Integrating all datasets in the prediction will increase this success rate to 75%, thus reducing the number of required reporter assays (Table 1).
Figure 4.
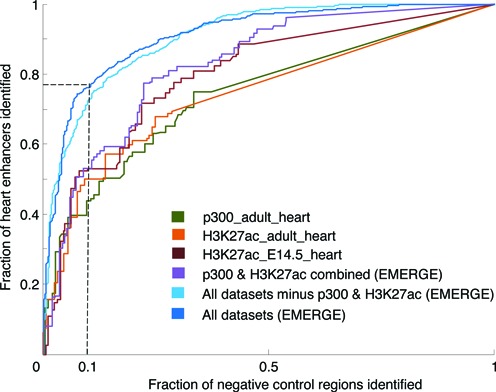
Combining datasets in EMERGE outperforms classical enhancer hallmarks p300 and H3K27ac. Performance of enhancer prediction by EMERGE and heart H3K27ac and p300 ChIP-seq. Individual ChIP-seq datasets were sorted on significance. The combination of H3K27ac and p300 and EMERGE without these three datasets are also plotted. Enhancers active in other tissue were used as negative control region reference data. The dashed line indicates the fraction of reporter assays that will detect a true enhancer when a false positive rate of 10% is accepted (see Table 1).
Table 1. Combining datasets in EMERGE outperforms H3K27ac and p300 based approaches at 10% false positive stringency threshold.
| Dataset(s) on heart tissue | % of enhancers identified |
|---|---|
| p300 adult | 40 |
| H3K27ac adult | 50 |
| H3K27ac E14.5 | 53 |
| p300 & H3K27ac combined (EMERGE) | 53 |
| All datasets minus p300 and H3K27ac (EMERGE) | 73 |
| All datasets (EMERGE) | 76 |
Given per dataset (or combination of datasets) is the percentage of heart enhancers identified at the same stringency threshold (see Figure 4, dashed line for threshold). Enhancers active in other tissues were used as negative control region reference data.
We compared the performance of EMERGE enhancer prediction with those of CSI-ANN (22) and ChromaGenSVM (24), two methods that also use overlapping functional genomic data for prediction. In the study that presents ChromaGenSVM (24), a collection of histone-methylation and -acetylation datasets in CD4+ T cells were used to predict DNaseI hypersensitive sites (DHSs) in the same tissue. We ran EMERGE on the same data. The results of this comparison shows that EMERGE outperforms CSI-ANN and has very similar predictive power to ChromaGenSVM (procedure details and results are given in Supplemental Table S3).
In summary, EMERGE provides powerful enhancer predictions for different species and tissues of interest. We have tested these predictions for mouse, human and Drosophila genomes, but other genomes can be imported and analysed. When EMERGE's enhancer prediction is based on multiple integrated datasets, it far outperforms the use of even the best single datasets.
Interacting chromatin domains are enriched with predicted enhancers
Enhancer-mediated activation of target gene promoters requires these genomic elements to be in close proximity to each other in 3D-space through chromatin looping (reviewed in (37)). The development of chromatin conformation capture (3C)-based technology and its genome-wide derivatives have enabled the study of this spatial organization of DNA (reviewed in (38)). Recently, high resolution (1000 bp range) HiC data for several human cell lines has become available (39). When EMERGE enhancer prediction points to actual enhancer locations, we expect the predicted regions to be predominantly located in interacting chromatin domains. Furthermore, we expect this relation to hold across different tissue-types. Though chromatin 3D topology has been reported to be distinct between cell types, for example through enhancer activation (40,41), it has since been shown that the bulk of chromatin configurations are conserved between tissue-types, in so-called permissive chromatin states (reviewed in (1)). Therefore, we have studied the overlap between human heart enhancer prediction by EMERGE and intergenic HiC signal in various human cell lines (Figure 5 shows an example of a validated enhancer on the human GATA4 locus co-localizing with a significant HiC interaction). Although only 7% of the validated enhancers overlap with HiC peaks, we found that significantly interacting chromatin domains are enriched with EMERGE-predicted human heart enhancers; moreover we found this to be true for all cell lines that were addressed in the Rao study (Table 2).
Figure 5.

Validated human heart enhancer located in significantly interacting chromatin domains. The HiC and HiC-complement peaks in red and green denote chromatin domains that are frequently interacting with each other. The chromatin domain that covers part of a GATA4 intron contains a validated heart enhancer.
Table 2. EMERGE-predicted human heart enhancers are located in interacting chromatin domains as identified by HiC.
| HiC datasets (cell lines) | # of intergenic HiC peaks | Area Under the Curve |
|---|---|---|
| GM12878 | 11 803 | 0.70 |
| HeLa | 4003 | 0.76 |
| HMEC | 7211 | 0.74 |
| HUVEC | 5004 | 0.76 |
| K562 | 7074 | 0.73 |
| KBM7 | 3403 | 0.77 |
| NHEK | 5923 | 0.71 |
EMERGE predicted enhancers were overlapped with intergenic HiC peaks. Heart enhancer prediction was done using validated human heart enhancers as true positives (TPs) for training; enhancers active in other tissues than heart were used as TNs. We calculated overlap between the predicted enhancer track and high resolution HiC peaks (Rao et al. .) of various human cell lines. HICCUPS was used to call peaks on the HiC data (as detailed in Rao et al.). All HiC peaks located at transcription start sites (TSS) were removed (−3000 bp +1000 bp of all known UCSC gene promoters (hg19)). To construct ROC curves, the weights of the EMERGE predicted enhancer track were used. HiC peaks were then used as TPs and a matching number of random genomic regions were used as TNs. The Area Under the Curve (AUC) values of these ROC curves are given.
DISCUSSION
We have tested the applicability of the EMERGE program by combining a multitude of functional genomic datasets and by assigning automated weights to these predictors. The accuracy with which these weights discriminate between validated enhancers and TNs was captured by AUC scores of ROC curves (Figure 3B–F). These scores show that EMERGE is able to provide powerful enhancer predictions, for different species and tissues of interest, which go beyond the power of single dataset approaches. Typically, p300 and/or H3K27ac signatures are used as the sole markers for identification in enhancer screen studies. Our data show that this is a sub-optimal approach when compared to combining a multitude of relevant datasets using EMERGE (Figure 4 and Table 1). This indicates that either not all active enhancers are marked by H3K27ac and p300 (sub-optimal sensitivity) or that these markers are promiscuous and mark other regions of the genome (sub-optimal specificity). An alternative explanation that cannot easily be dismissed is that the ChIP-seq data does not perfectly reflect the genomic profile of these marks. Regardless of which of these explanations is correct, combining a number of relevant datasets results in more reliable enhancer prediction.
We have used experimentally validated enhancers from publicly available enhancer screening depositories as training data for EMERGE enhancer prediction. From a historical perspective, the genomic regions that are represented in the VISTA enhancer depository were, in general, selected for testing based on the presence of a single enhancer marker. For example, the majority of mouse heart enhancers present in the VISTA depository (6) were screened based solely on the presence of embryonic p300 ChIP-seq signal. Obviously, the manner in which these regions were selected results in a bias in the training data. For this reason, we did not include this embryonic p300 dataset itself as a predictor dataset in our analyses. Moreover, adult p300 data on heart tissue was not among the top predictor datasets (Supplemental Table S2). The robustness of EMERGE prediction when several key datasets are removed (Figure 4), combined with the similar weights of many predictor datasets (Supplemental Table S2), indicates that training data bias does not confound the enhancer predictions presented in this paper. Moreover, for Drosophila a sufficiently large portion (13.5%) of the genome has been screened without selection bias (26). This makes this database particularly suitable for enhancer prediction efforts, making for reliable EMERGE prediction results.
In general, a tissue-specific enhancer is expected to be occupied by enhancer markers only in that specific cell-type. We show that EMERGE enhancer prediction is able to handle and exploit this modularity to a large extent (e.g. Figure 6). Although the brain enhancer on the Pim1 locus exemplified in Figure 6 is also marked by predictors indicative for heart enhancer activity (such as a Tbx3 binding-site), a number of other important predictors for heart enhancer activity, such as Nkx2–5 and Gata4, are absent. This is in agreement with the observed absence of heart enhancer activity for this element. When prediction is based on heart enhancers, datasets derived from heart tissue receive positive weights, whereas all brain-derived datasets are allocated negative weights; the opposite is true when the location of brain enhancers is to be predicted (Supplementary File 2). Though this paper focuses on EMERGE as a predictive tool for enhancers, EMERGE was designed so that it can be used to predict any type of genomic feature that leaves a signature on the genome (and can be used in the form of predictor data). One can think of the prediction of gene repressive elements, topological domain boundaries, specific chromatin states, etcetera.
Figure 6.

EMERGE enhancer prediction is able to recognize and use tissue-specific signatures. Screenshot of the Pim1 locus, containing a validated heart and a validated brain enhancer located in close proximity. Using tissue-specific training data, the logistic regression approach of EMERGE is able to discriminate between heart and brain enhancers on the basis of their genomic signatures. The images of the enhancer screened transgenic embryos are taken from the Vista enhancer browser (reference in main text).
Obviously, the modelling results are by definition dependent on the quality of the predictor and the training-datasets. When testing enhancer prediction, we defined a TP as a genomic region that has shown (reproducible) reporter gene activity within the tissue of choice (e.g. heart). For various reasons, the definition of a TN is more difficult. Intuitively, the regions tested negative in a validation assay are the easiest TN class to understand. This class includes all regions that did not show reporter gene activity upon testing. Although it is attractive to consider this class as the ideal TN class, there are reasons to believe that this class is contaminated with regions that should have been labelled positive. Such contamination within the TN class will lead to a negative bias in the specificity, which in turn leads to a ROC-curve that is skewed to the right and thus leads to a decreased AUC.
Contamination of this TN may result from reporter gene assays that have failed for technical reasons, such as transgenic DNA integrating in silenced genomic sites. Due to the multiple embryos (and thus individual integration events) tested per transgenic enhancer screen, we suspect that such problems affect only a minor proportion of the assays. Secondly, a regulatory DNA region may have an enhancer-like function of a type that would not become apparent with the used screening method. For example, there are synergistic enhancers described that will only lead to tissue-specific enhancer activity, or indeed any enhancer activity at all, when their regulatory DNA partner region is also available for interaction (42,43). Such a situation would not be mimicked with the current enhancer screening methods. Despite these limitations, we still expect that a large proportion of the genomic regions present within this TN class (A) is labelled correctly. That is to say that most of the regions in this TN class have no actual enhancer function in vivo. However, as the extent of contamination is hard to estimate, we have modelled with additional TN classes to obtain a more complete picture.
The second class of TNs contains validated tissue-specific enhancers that were shown to drive expression in another tissue than the tissue of interest (e.g. limb enhancers that are not active in heart). For this class of TNs, contamination is less likely to occur since the validation procedure technically worked and the presence of synergistic other enhancers is less likely to be required. Therefore, we expect this TN class to be contaminated to a lesser extent than the first class. The generally higher AUC of the ROC-curves compared to the class A TNs could indeed indicate that class A TNs are contaminated with unobserved enhancers.
The third class of TNs consists of random genomic regions. Technically speaking, these are not negatives, but the genomic background. This background reflects the entire genome, so it is expected to contain some randomly selected enhancers. EMERGE consistently reached near perfect prediction when this class of TNs was used in the analysis (Figure 3B, C, E, F; blue curves). The presence of any kind of enhancer related signal on the genome, versus the absence of this in a very large proportion of the complete genome, makes this type of distinction easier to capture.
We have cross-referenced EMERGE enhancer prediction with genome-wide chromatin conformation data. HiC technology has undergone major improvements in the past year(s), but its sensitivity and resolution are not yet sufficient to identify each individual contact within a locus. The number of real interactions between gene promoters and distal regions is expected to be at least an order of magnitude higher than the number of interactions observed in the HiC datasets (38). Therefore, the sparse overlap between validated enhancers and HiC peaks is not conclusive. Contrarily, where there is overlap, the presence of HiC peaks can constitute powerful predictive support. To this end, we have assessed the genome-wide enrichment of HiC peaks at EMERGE predicted enhancer loci. We found that human heart enhancer prediction by EMERGE is consistent with human HiC data (39); frequently interacting chromatin domains were found to be enriched with predicted enhancers (Table 2).
Such chromatin conformation data can be utilized in the EMERGE pipeline in several ways. The interacting regions can be used as predictors, but they can also be used as a TP training dataset. Following the logic that enhancers need contact with their target gene promoter to function, interacting regions can even be used as a filter on top of enhancer prediction.
CONCLUSION
The activity of regulatory DNA elements is typically characterized by the genomic co-localization of specific histone marks and TF-binding sites (44,45). Therefore, functional genomics data (e.g., ChIP-seq) are extensively used to identify regulatory DNA loci on the genome. Often a single dataset already contains in the order of a 100 000 peaks that may or may not represent a functional element. Therefore, additional datasets are generally used to narrow down the number of likely candidates. The complexity of such overlap analyses quickly increases upon adding more datasets. With EMERGE we provide an easy-to-use solution to select and combine various types of functional genomic datasets. The results of the overlap analysis can be viewed in an integrated genome browser. The user then has the option to interactively assign weights to the individual datasets, allowing for (research question driven) focus on specific marks of interest. Furthermore, dataset weights can be automatically assigned through a modelling approach using validated biological data for training. The research question that one wishes to address dictates which predictor and training datasets are to be used.
AVAILABILITY
EMERGE is available for download at http://download.hfrc.nl.
Source code is available under a BSD license at http://download.hfrc.nl.
All BED files used in this study are available for download at http://download.hfrc.nl.
Supplementary Material
Acknowledgments
We would like to thank Shahab Rezaei Mazinani for his contributions during the earliest stages of programming the EMERGE software.
SUPPLEMENTARY DATA
Supplementary Data are available at NAR Online.
FUNDING
Fondation Leducq; ZonMW TOP [40-00812-98-12086]; CVON HUSTCARE. Funding for open access charge: Academic Medical Center.
Conflict of interest statement. None declared.
REFERENCES
- 1.de Laat W., Duboule D. Topology of mammalian developmental enhancers and their regulatory landscapes. Nature. 2013;502:499–506. doi: 10.1038/nature12753. [DOI] [PubMed] [Google Scholar]
- 2.Banerji J., Rusconi S., Schaffner W. Expression of a beta-globin gene is enhanced by remote SV40 DNA sequences. Cell. 1981;27:299–308. doi: 10.1016/0092-8674(81)90413-x. [DOI] [PubMed] [Google Scholar]
- 3.Jenuwein T., Allis C.D. Translating the histone code. Science. 2001;293:1074–1080. doi: 10.1126/science.1063127. [DOI] [PubMed] [Google Scholar]
- 4.Hindorff L.A., Sethupathy P., Junkins H.A., Ramos E.M., Mehta J.P., Collins F.S., Manolio T.A. Potential etiologic and functional implications of genome-wide association loci for human diseases and traits. Proc. Natl. Acad. Sci. U.S.A. 2009;106:9362–9367. doi: 10.1073/pnas.0903103106. [DOI] [PMC free article] [PubMed] [Google Scholar]
- 5.Maurano M.T., Humbert R., Rynes E., Thurman R.E., Haugen E., Wang H., Reynolds A.P., Sandstrom R., Qu H., Brody J., et al. Systematic localization of common disease-associated variation in regulatory DNA. Science. 2012;337:1190–1195. doi: 10.1126/science.1222794. [DOI] [PMC free article] [PubMed] [Google Scholar]
- 6.Visel A., Minovitsky S., Dubchak I., Pennacchio L.A. VISTA Enhancer Browser—a database of tissue-specific human enhancers. Nucleic Acids Res. 2007;35:D88–D92. doi: 10.1093/nar/gkl822. [DOI] [PMC free article] [PubMed] [Google Scholar]
- 7.Dunham I., Kundaje A., Aldred S.F., Collins P.J., Davis C.A., Doyle F., Epstein C.B., Frietze S., Harrow J., Kaul R., et al. An integrated encyclopedia of DNA elements in the human genome. Nature. 2012;489:57–74. doi: 10.1038/nature11247. [DOI] [PMC free article] [PubMed] [Google Scholar]
- 8.Kleinjan D.A., van Heyningen V. Long-range control of gene expression: emerging mechanisms and disruption in disease. Am. J. Hum. Genet. 2005;76:8–32. doi: 10.1086/426833. [DOI] [PMC free article] [PubMed] [Google Scholar]
- 9.Bonn S., Zinzen R.P., Girardot C., Gustafson E.H., Perez-Gonzalez A., Delhomme N., Ghavi-Helm Y., Wilczynski B., Riddell A., Furlong E.E. Tissue-specific analysis of chromatin state identifies temporal signatures of enhancer activity during embryonic development. Nat. Genet. 2012;44:148–156. doi: 10.1038/ng.1064. [DOI] [PubMed] [Google Scholar]
- 10.Creyghton M.P., Cheng A.W., Welstead G.G., Kooistra T., Carey B.W., Steine E.J., Hanna J., Lodato M.A., Frampton G.M., Sharp P.A., et al. Histone H3K27ac separates active from poised enhancers and predicts developmental state. Proc. Natl. Acad. Sci. U.S.A. 2010;107:21931–21936. doi: 10.1073/pnas.1016071107. [DOI] [PMC free article] [PubMed] [Google Scholar]
- 11.Ruthenburg A.J., Li H., Patel D.J., Allis C.D. Multivalent engagement of chromatin modifications by linked binding modules. Nat. Rev. Mol. Cell Biol. 2007;8:983–994. doi: 10.1038/nrm2298. [DOI] [PMC free article] [PubMed] [Google Scholar]
- 12.Yin J.W., Wang G. The Mediator complex: a master coordinator of transcription and cell lineage development. Development. 2014;141:977–987. doi: 10.1242/dev.098392. [DOI] [PubMed] [Google Scholar]
- 13.Hallikas O., Palin K., Sinjushina N., Rautiainen R., Partanen J., Ukkonen E., Taipale J. Genome-wide prediction of mammalian enhancers based on analysis of transcription-factor binding affinity. Cell. 2006;124:47–59. doi: 10.1016/j.cell.2005.10.042. [DOI] [PubMed] [Google Scholar]
- 14.Herrmann C., Van de Sande B., Potier D., Aerts S. i-cisTarget: an integrative genomics method for the prediction of regulatory features and cis-regulatory modules. Nucleic Acids Res. 2012;40:e114. doi: 10.1093/nar/gks543. [DOI] [PMC free article] [PubMed] [Google Scholar]
- 15.Jolma A., Yan J., Whitington T., Toivonen J., Nitta K.R., Rastas P., Morgunova E., Enge M., Taipale M., Wei G., et al. DNA-binding specificities of human transcription factors. Cell. 2013;152:327–339. doi: 10.1016/j.cell.2012.12.009. [DOI] [PubMed] [Google Scholar]
- 16.Sinha S., van Nimwegen E., Siggia E.D. A probabilistic method to detect regulatory modules. Bioinformatics. 2003;19(Suppl. 1):i292–i301. doi: 10.1093/bioinformatics/btg1040. [DOI] [PubMed] [Google Scholar]
- 17.Wei G.H., Badis G., Berger M.F., Kivioja T., Palin K., Enge M., Bonke M., Jolma A., Varjosalo M., Gehrke A.R., et al. Genome-wide analysis of ETS-family DNA-binding in vitro and in vivo. EMBO J. 2010;29:2147–2160. doi: 10.1038/emboj.2010.106. [DOI] [PMC free article] [PubMed] [Google Scholar]
- 18.Yanez-Cuna J.O., Dinh H.Q., Kvon E.Z., Shlyueva D., Stark A. Uncovering cis-regulatory sequence requirements for context-specific transcription factor binding. Genome Res. 2012;22:2018–2030. doi: 10.1101/gr.132811.111. [DOI] [PMC free article] [PubMed] [Google Scholar]
- 19.Barski A., Cuddapah S., Cui K., Roh T.Y., Schones D.E., Wang Z., Wei G., Chepelev I., Zhao K. High-resolution profiling of histone methylations in the human genome. Cell. 2007;129:823–837. doi: 10.1016/j.cell.2007.05.009. [DOI] [PubMed] [Google Scholar]
- 20.Johnson D.S., Mortazavi A., Myers R.M., Wold B. Genome-wide mapping of in vivo protein-DNA interactions. Science. 2007;316:1497–1502. doi: 10.1126/science.1141319. [DOI] [PubMed] [Google Scholar]
- 21.Robertson G., Hirst M., Bainbridge M., Bilenky M., Zhao Y., Zeng T., Euskirchen G., Bernier B., Varhol R., Delaney A., et al. Genome-wide profiles of STAT1 DNA association using chromatin immunoprecipitation and massively parallel sequencing. Nat. Methods. 2007;4:651–657. doi: 10.1038/nmeth1068. [DOI] [PubMed] [Google Scholar]
- 22.Firpi H.A., Ucar D., Tan K. Discover regulatory DNA elements using chromatin signatures and artificial neural network. Bioinformatics. 2010;26:1579–1586. doi: 10.1093/bioinformatics/btq248. [DOI] [PMC free article] [PubMed] [Google Scholar]
- 23.Won K.J., Chepelev I., Ren B., Wang W. Prediction of regulatory elements in mammalian genomes using chromatin signatures. BMC Bioinformatics. 2008;9:547. doi: 10.1186/1471-2105-9-547. [DOI] [PMC free article] [PubMed] [Google Scholar]
- 24.Fernandez M., Miranda-Saavedra D. Genome-wide enhancer prediction from epigenetic signatures using genetic algorithm-optimized support vector machines. Nucleic Acids Res. 2012;40:e77. doi: 10.1093/nar/gks149. [DOI] [PMC free article] [PubMed] [Google Scholar]
- 25.Erwin G.D., Oksenberg N., Truty R.M., Kostka D., Murphy K.K., Ahituv N., Pollard K.S., Capra J.A. Integrating diverse datasets improves developmental enhancer prediction. PLoS Comput. Biol. 2014;10:e1003677. doi: 10.1371/journal.pcbi.1003677. [DOI] [PMC free article] [PubMed] [Google Scholar]
- 26.Kvon E.Z., Kazmar T., Stampfel G., Yanez-Cuna J.O., Pagani M., Schernhuber K., Dickson B.J., Stark A. Genome-scale functional characterization of Drosophila developmental enhancers in vivo. Nature. 2014;512:91–95. doi: 10.1038/nature13395. [DOI] [PubMed] [Google Scholar]
- 27.Zou H., Hastie T. Regularization and variable selection via the elastic net. J. Roy. Stat. Soc. B. 2005;67:301–320. [Google Scholar]
- 28.Langmead B., Trapnell C., Pop M., Salzberg S.L. Ultrafast and memory-efficient alignment of short DNA sequences to the human genome. Genome Biol. 2009;10:R25. doi: 10.1186/gb-2009-10-3-r25. [DOI] [PMC free article] [PubMed] [Google Scholar]
- 29.de Boer B.A., van Duijvenboden K., van den Boogaard M., Christoffels V.M., Barnett P., Ruijter J.M. OccuPeak: ChIP-Seq peak calling based on internal background modelling. PLoS One. 2014;9:e99844. doi: 10.1371/journal.pone.0099844. [DOI] [PMC free article] [PubMed] [Google Scholar]
- 30.Stamatoyannopoulos J.A., Snyder M., Hardison R., Ren B., Gingeras T., Gilbert D.M., Groudine M., Bender M., Kaul R., Canfield T., et al. An encyclopedia of mouse DNA elements (Mouse ENCODE) Genome Biol. 2012;13:418. doi: 10.1186/gb-2012-13-8-418. [DOI] [PMC free article] [PubMed] [Google Scholar]
- 31.modENCODE Consortium. Roy S., Ernst J., Kharchenko P.V., Kheradpour P., Negre N., Eaton M.L., Landolin J.M., Bristow C.A., Ma L., et al. Identification of functional elements and regulatory circuits by Drosophila modENCODE. Science. 2010;330:1787–1797. doi: 10.1126/science.1198374. [DOI] [PMC free article] [PubMed] [Google Scholar]
- 32.Visel A., Bristow J., Pennacchio L.A. Enhancer identification through comparative genomics. Semin. Cell Dev. Biol. 2007;18:140–152. doi: 10.1016/j.semcdb.2006.12.014. [DOI] [PMC free article] [PubMed] [Google Scholar]
- 33.Junion G., Spivakov M., Girardot C., Braun M., Gustafson E.H., Birney E., Furlong E.E. A transcription factor collective defines cardiac cell fate and reflects lineage history. Cell. 2012;148:473–486. doi: 10.1016/j.cell.2012.01.030. [DOI] [PubMed] [Google Scholar]
- 34.Hawrylycz M.J., Lein E.S., Guillozet-Bongaarts A.L., Shen E.H., Ng L., Miller J.A., van de Lagemaat L.N., Smith K.A., Ebbert A., Riley Z.L., et al. An anatomically comprehensive atlas of the adult human brain transcriptome. Nature. 2012;489:391–399. doi: 10.1038/nature11405. [DOI] [PMC free article] [PubMed] [Google Scholar]
- 35.Blow M.J., McCulley D.J., Li Z., Zhang T., Akiyama J.A., Holt A., Plajzer-Frick I., Shoukry M., Wright C., Chen F., et al. ChIP-Seq identification of weakly conserved heart enhancers. Nat. Genet. 2010;42:806–810. doi: 10.1038/ng.650. [DOI] [PMC free article] [PubMed] [Google Scholar]
- 36.Heintzman N.D., Hon G.C., Hawkins R.D., Kheradpour P., Stark A., Harp L.F., Ye Z., Lee L.K., Stuart R.K., Ching C.W., et al. Histone modifications at human enhancers reflect global cell-type-specific gene expression. Nature. 2009;459:108–112. doi: 10.1038/nature07829. [DOI] [PMC free article] [PubMed] [Google Scholar]
- 37.Kulaeva O.I., Nizovtseva E.V., Polikanov Y.S., Ulianov S.V., Studitsky V.M. Distant activation of transcription: mechanisms of enhancer action. Mol. Cell. Biol. 2012;32:4892–4897. doi: 10.1128/MCB.01127-12. [DOI] [PMC free article] [PubMed] [Google Scholar]
- 38.de Wit E., de Laat W. A decade of 3C technologies: insights into nuclear organization. Genes Dev. 2012;26:11–24. doi: 10.1101/gad.179804.111. [DOI] [PMC free article] [PubMed] [Google Scholar]
- 39.Rao S.S., Huntley M.H., Durand N.C., Stamenova E.K., Bochkov I.D., Robinson J.T., Sanborn A.L., Machol I., Omer A.D., Lander E.S., et al. A 3D map of the human genome at kilobase resolution reveals principles of chromatin looping. Cell. 2014;159:1665–1680. doi: 10.1016/j.cell.2014.11.021. [DOI] [PMC free article] [PubMed] [Google Scholar]
- 40.Tolhuis B., Palstra R.J., Splinter E., Grosveld F., de L.W. Looping and interaction between hypersensitive sites in the active beta-globin locus. Mol. Cell. 2002;10:1453–1465. doi: 10.1016/s1097-2765(02)00781-5. [DOI] [PubMed] [Google Scholar]
- 41.Carter D., Chakalova L., Osborne C.S., Dai Y.F., Fraser P. Long-range chromatin regulatory interactions in vivo. Nat. Genet. 2002;32:623–626. doi: 10.1038/ng1051. [DOI] [PubMed] [Google Scholar]
- 42.Blasquez V.C., Hale M.A., Trevorrow K.W., Garrard W.T. Immunoglobulin kappa gene enhancers synergistically activate gene expression but independently determine chromatin structure. J. Biol. Chem. 1992;267:23888–23893. [PubMed] [Google Scholar]
- 43.van Weerd J.H., Badi I., van den Boogaard M., Stefanovic S., van de Werken H.J., Gomez-Velazquez M., Badia-Careaga C., Manzanares M., de L.W., Barnett P. A large permissive regulatory domain exclusively controls Tbx3 expression in the cardiac conduction system. Circ. Res. 2014;115:432–441. doi: 10.1161/CIRCRESAHA.115.303591. [DOI] [PubMed] [Google Scholar]
- 44.He A., Kong S.W., Ma Q., Pu W.T. Co-occupancy by multiple cardiac transcription factors identifies transcriptional enhancers active in heart. Proc. Natl. Acad. Sci. U.S.A. 2011;108:5632–5637. doi: 10.1073/pnas.1016959108. [DOI] [PMC free article] [PubMed] [Google Scholar]
- 45.Spitz F., Furlong E.E. Transcription factors: from enhancer binding to developmental control. Nat. Rev. Genet. 2012;13:613–626. doi: 10.1038/nrg3207. [DOI] [PubMed] [Google Scholar]
Associated Data
This section collects any data citations, data availability statements, or supplementary materials included in this article.