

Abstract
Background:
Mitochondrial dysfunction plays an important role in the pathogenesis of amyotrophic lateral sclerosis (ALS). We aimed to demonstrate mitochondrial dysfunction in ALS using a lactate stress test and to examine the relationship between mitochondrial dysfunction with motor deterioration.
Methods:
We enrolled 116 patients and observed clinical variables, including the survival state.
Results:
Patients with a rapid slope of revised ALS functional rating scales (ALSFRS-r) (>20 U/year) exhibited the slowest elimination rate (median −4.67 × 10⁻³ mmol∙L−1∙min−1, coefficient of variation, 590.15%), the shortest duration (0.63 ± 0.28 years) and the worst ALSFRS-r (32.59 ± 4.93). Patients with a moderate slope of ALSFRS-r (10–20 U/year) showed a moderate elimination rate (median −11.33 × 10⁻³ mmol∙L−1∙min−1, coefficient of variation, 309.89%), duration (1.16 ± 0.45 years), and ALSFRS-r (34.83 ± 6.11). The slower progressing (<10 U/year group) patients exhibited a rapid elimination rate (median: −12.00 × 10⁻³ mmol∙L−1∙min−1, coefficient of variation: 143.08%), longer duration (median: 3 years, coefficient of variation: 193.33%), and adequate ALSFRS-r values (39.58 ± 9.44). Advanced-phase ALS patients also showed slower elimination rate (ER, quartiles −17.33, −5.67, 4.00) and worse ALSFRS-r (34.88 ± 9.27), while early-phase patients showed a more rapid ER (quartiles −25.17, −11.33, −3.50) and better ALSFRS-r (39.28 ± 7.59). These differences were statistically significant. Multiple linear regression analysis revealed strong direct associations among ER, ALSFRS-r slope (standard beta = 0.33, P = 0.007), and forced vital capacity (predict %) (standard beta = −0.458, P = 0.006, adjusted for ALSFRS-r, course and onset region). However, the data obtained from 3 years of follow-up showed no statistically significant difference in the survival rates between the most rapid and slowest ER groups.
Conclusion:
There is a potential linear relationship between ER and motor deterioration in ALS. Slower ER might be associated with faster disease progression.
Keywords: Advanced Phase, Amyotrophic Lateral Sclerosis, Early Phase, Elimination Rate of Serum Lactate
INTRODUCTION
Amyotrophic lateral sclerosis (ALS) is a fatal neurodegenerative disease; however, the pathogenic mechanism underlying motor neuron loss remains undetermined. Hypotheses concerning the mechanisms contributing to neurodegeneration include susceptibility to oxidative damage, glutamate excitotoxicity, mitochondrial dysfunction, intracellular aggregate accumulation, axonal transport defects, growth factors deficiencies, aberrant RNA metabolism, and glial cell pathology.[1] In addition to mitochondrial morbidity, other mechanisms are directly or indirectly associated with mitochondrial physiology. There has been increasing evidence for mitochondrial dysfunction in sporadic and familial ALS. Swollen and pale-staining mitochondria were described in a cell-culture model of superoxide dismutase 1 (SOD1) mutant motor neurons. The morphological abnormalities were accompanied by reduced activity of respiratory chain complexes II and IV. Inhibition of the glycolytic pathway consequently increased cell death.[2] Morphological and functional defects in mitochondria have been observed in both human patients and ALS mice over-expressing mutant SOD1.[3] Abnormal clustering of mitochondria was reported in the motor axons of mutant SOD1 transgenic mice.[4] Individuals with ALS possess mitochondria with impaired electron transport, increased free radical generation, and the inability to buffer cellular and cytosolic calcium shifts adequately.[5] Thus, mitochondrial dysfunction in ALS has recently gained increasing attention. Ghiasi et al.[6] observed that complex I deficiency, both reduction in intracellular ATP and increase in intracellular ADP content may be involved in the progression and pathogenesis of ALS. Fukunaga et al.[7] reported that familial ALS patients exhibit a missense mutation in SIGMAR1 (c. 304G > C), which encodes sigma-1 receptor (Sig-1R), expression of that mutant Sig-1RE102Q protein reduces mitochondrial ATP production, inhibits proteasome activity and causes mitochondrial injury, Macchi et al. discovered that rasagiline, a monoamine oxidase B inhibitor, slowed disease progression in the SOD1 mouse, and in a case series of patients with ALS.[8] These advances raised our interesting focus on a previous research about the relationship between ALS and mitochondrial dysfunction.
Compared with neuropathological, neurochemical and genetic detection methods, the lactate stress test (LST) is a reliable, relatively easy-to-perform in vivo tool to screen patients for mitochondrial dysfunction. Despite increasing interest in this diagnostic tool and its widespread application in screening for respiratory chain disorders, little is known about the efficacy of this test when screening for ALS. A few studies have shown LST abnormalities in ALS patients.[9,10] However, the effects remain unknown of mitochondrion impairment on the severity and progression of ALS. Therefore, we conducted a cross-sectional and longitude study using LST to examine mitochondrial dysfunction in patients with ALS. The aim of our study was to identify the potential association between lactate levels and the clinical characteristics of ALS.
METHODS
Patients
This cross-sectional study included 116 consecutive ALS patients recruited from outpatients attending the Motor Neuron Disorder Clinic in the Department of Neurology, Peking University Third Hospital, China from September 2008 to July 2009. All of the subjects provided informed consent to participate in this study. Inclusion required a diagnosis of ALS, according to El Escorial Revised Criteria (EEC-R). We excluded patients with heart failure, infections, chronic alcoholism, malignancies, and glycogenesis and those who were taking biguanides, valproic acid, corticosteroids, salicylate, or oral contraceptives as lactate levels can increase under these conditions.[11] Patients with diabetes, renal failure, or hepatopathy were included only if these abnormalities were optimally compensated when LST was performed. Blood samples were collected in the morning after participants had fasted and been satiated.
Outcome measurement
The sensitivity of LST is greater under a constant workload than under a workload relative to the maximal individual workload.[12] Thus, a constant workload was adopted in this study. We performed the following standard procedure for all LSTs. The ALS patients rested for at least 15 min. The first lactate measurement was obtained immediately before movement (the lactate level was defined as “Lactate before”). Subsequently, the patients continuously cycled on a paddle-rate-independent electronic bicycle ergometer for 15 min, with uniform motion and a rotation speed of 20–40 r/min. A venous blood sample was drawn for the lactate test (“Lactate 0”) immediately after exercise. Finally, after resting for 15 min, the lactate was measured again (“Lactate 15”). Serum lactate concentrations were determined using high-performance liquid chromatography with fluorescence detection.[9,10] Pyruvate was simultaneously determined at every time point.
The motor functional status of ALS patients was assessed according to the revised ALS functional rating scales (ALSFRS-r). Demographic characteristics, such as age, gender, course from onset to LST examination, onset region, forced vital capacity (FVC) (predict %), and various grades of disease, were collected at the time of patient enrollment. We adopted the slope of ALSFRS-r (rate of change) as a parameter for the worsening of motor deficits and disease progression. The patients were categorized as “advanced-phase ALS” (defined as definite and probable ALS) or “early-phase ALS” (defined as laboratory-supported probable and possible ALS). Three years after the LST examinations, the patients were followed up to assess their survival states.
Statistical analysis
To obtain an appropriate index for relationships with clinical variables, we calculated five deuterogenic values: (1) Elimination rate (ER) = (lactate 15-lactate 0)/15 min; (2) lactate 15-to-lactate before ratio; (3) lactate 0-to-lactate before ratio; (4) lactate 0-to-pyruvate before ratio; and (5) lactate before-to-pyruvate before ratio. In all of the statistical analyses, the indexes were treated as continuous variables. The normal distribution of the data was assessed using the Kolmogorov–Smirnov test. Each of the deuterogenic values was also assessed for distribution normality. Normally distributed data were analyzed using one-way analysis of variance (ANOVA), whereas Kruskal–Wallis H analysis was performed for nonnormally distributed data. Correlations between variables were calculated using Pearson's correlation coefficients. A P < 0.05 was considered statistically significant. The clinical characteristics and indexes were compared with ALS patients from different categories. We attempted to identify the potential correlations between the elimination rate and ALS clinical progression (ALSFRS-r slope) using means of multiple linear regression analyses. Kaplan–Meier process is applied for survival analysis.
RESULTS
Baseline demographic and clinical characteristics
The data were retrospectively collected from 116 patients (male: female = 82: 34) with a mean ± standard deviation age of 50.68 ± 11.05 years old, a mean ALSFRS-r score of 37.31 ± 8.63, and a mean FVC (predict %) of 86.06 ± 14.13%. The median course of symptom onset to enrollment was 1.75 years, with quartiles of 1.00, 1.75, and 4.00 years (minimum 0.25 years, maximum 30.00 years). Bulbar-onset ALS was present in 7.76% (9/116) of the patients, and limb-onset ALS was present in 92.24% (107/116). All of the patients were treated with Vitamin E. According to the EEC-R criteria, 39.66% (46/116) of the patients were diagnosed with definite ALS, 5.17% (6/116) are probable ALS, 34.48% (40/116) of the patients had probable laboratory-supported ALS, and 20.69% (24/116) of the patients are possible ALS. The ratio of advanced-phase (definite and probable) to early-phase (laboratory supported probable ALS and possible) ALS was 52:64. The ALSFRS-r slope was 13.77 ± 10.59 U/year.
Lactate levels and deuterogenic values
The lactate levels of “Lactate before,” “Lactate 0,” and “Lactate 15” were normally distributed (Kolmogorov–Smirnov test: P = 2.000 for all tests). Compared with lactate before (0.62 ± 0.27 mmol/L), both lactate 0 (0.92 ± 0.37 mmol/L) and lactate 15 (0.76 ± 0.31 mmol/L) increased significantly (F = 23.87, P = 0.000). The lactate levels at every time point were statistically significant (P < 0.05). The lactate 15-to-lactate before ratio (1.39 ± 0.76) was normally distributed (Kolmogorov–Smirnov test: P =2.000). The other deuterogenic values were nonnormally distributed. The median lactate 0-to-pyruvate before ratio was 4.19, with quartiles of 2.60, 4.19, and 7.43 (maximum 93.50, minimum 1.40, Kolmogorov–Smirnov test: P = 0.000). The median lactate before-to-pyruvate before ratio was 4.19, with quartiles of 2.60, 4.19, and 7.63 (maximum 65.50, minimum 0.68, Kolmogorov–Smirnov test: P = 0.000). The quartiles of the lactate 0-to-lactate before ratio were 1.29, 1.43, and 1.68 (Kolmogorov–Smirnov test: P =0.02). The elimination rate of lactate was also nonnormally distributed (quartiles − 20.00 × 10⁻³, −8.33 × 10⁻³, and 1.33 × 10⁻³ mmol∙L−1∙min−1, maximum 92.67 × 10⁻³ mmol∙L−1∙min−1, minimum − 117.33 × 10⁻³ mmol∙L−1∙min−1, Kolmogorov–Smirnov test: P = 0.37).
Correlations among deuterogenic values
We examined the correlations among the deuterogenic values. The matrix [Table 1] indicated that the value for lactate before was moderately correlated with the elimination rate (r = −0.407, P = 0.000). Lactate 0 was moderately correlated with the elimination rate (r = −0.634, P = 0.000). Lactate 15 was slightly correlated with the elimination rate (r = 0.397, P = 0.000). In addition, the elimination rate was slightly correlated with the lactate before-to-pyruvate before ratio (r = −0.232, P = 0.013) and the lactate 0-to-pyruvate before ratio (r = −0.289, P = 0.002). Moreover, a small association was detected between the elimination rate and the average lactate value (r = −0.261, P = 0.005). Relationships among other indexes were also detected [Table 1]. Considering the dynamic balance of lactate and its correlation with other ratios, we focused on the ER.
Table 1.
Correlations between deuterogenic values
| Pearson’s correlation | Lactate before | Lactate 0 | Lactate 15 | Lactate 15/pyruvate before | Lactate 15/lactate before | Lactate 0/lactate before | Lactate before/pyruvate before | ER |
|---|---|---|---|---|---|---|---|---|
| Lactate before | – | 0.813* | 0.513* | 0.351* | −0.232* | −0.186* | 0.396* | −0.388* |
| Lactate 0 | – | – | 0.452* | 0.390* | −0.122 | 0.211* | 0.332* | −0.632* |
| Lactate 15 | – | – | – | 0.127 | 0.000 | 0.051 | 0.132 | 0.405* |
| Lactate 15/pyruvate before | – | – | – | – | −0.167 | −0.062 | 0.972* | −0.289* |
| Lactate 15/lactate before | – | – | – | – | – | 0.215* | −0.217* | 0.126 |
| Lactate 0/lactate before | – | – | – | – | – | – | −0.181 | −0.172 |
| Lactate before/pyruvate before | – | – | – | – | – | – | – | −0.225* |
*P<0.05, statistical significance, two-tailed test. ER: Elimination rate.
Associations between course and other variables
The ALSFRS-r slope showed a simple negative linear trend with quarterly course indicators. Table 2 indicates that the patients with longer courses more likely exhibited slower slopes, a finding that was statistically significant. There was no such linear trend observed for other variables (including age, FVC, ALSFRS-r, lactate levels, and ER).
Table 2.
Association between disease course and other variables
| Disease course | Average lactate | ER | FRSr | FRSr slope | Lactate | Lactate 0 | Lactate 15 |
|---|---|---|---|---|---|---|---|
| <1.00 year | 0.74 (0.23) | −0.83 | 39.28 (8.86) | 24.30 (18.39) | 0.56 (0.24) | 0.83 (0.26) | 0.82 (0.35) |
| 1.00–1.75 years | 0.83 (0.32) | −17.31 | 36.34 (6.95) | 14.65 (6.99) | 0.71 (0.33) | 1.02 (0.48) | 0.77 (0.28) |
| 1.75–4.00 years | 0.75 (0.25) | −10.46 | 35.66 (9.98) | 6.28 (3.96) | 0.65 (0.26) | 0.88 (0.29) | 0.72 (0.30) |
| >4.00 years | 0.75 (0.29) | −11.71 | 38.48 (8.30) | 2.08 (1.82) | 0.56 (0.22) | 0.92 (0.37) | 0.75 (0.34) |
| F | 0.84 | 2.50 | 1.17 | 25.58 | 2.00 | 1.61 | 0.50 |
| P | 0.473 | 0.063 | 0.323 | 0.000* | 0.118 | 0.192 | 0.687 |
*P<0.05, statistical significance, two-tailed test. ER: Elimination rate; FRSr: Functional rating scale-revised.
Associations between revised ALS functional rating scale slope and other variables
We categorized the ALSFRS-r slope into three groups: The slow progression group (ALSFRS-r slope <10 U/year); the moderate progression group (ALSFRS-r slope 10–20 U/year); and the rapid progression group (ALSFRS-r slope >20 U/year). The ALS patients with slower progression had a higher elimination rate (median: −12.00 × 10⁻³ mmol∙L−1∙min−1, coefficient of variation: 143.08%), longer duration (median: 3 years, coefficient of variation: 193.33%), and adequate ALSFRS-r value (39.58 ± 9.44), while the patients with moderate progression had a median elimination rate (median − 11.33 × 10⁻³ mmol∙L−1∙min−1, coefficient of variation, 309.89%) and moderate duration (1.16 ± 0.45 years) and ALSFRS-r (34.83 ± 6.11). The rapid progression group had the slowest elimination rate (median − 4.67 × 10⁻³ mmol∙L−1∙min−1, coefficient of variation, 590.15%), the shortest duration (0.63 ± 0.28 years), and the worst ALSFRS-r (32.59 ± 4.93). All of the P < 0.05 (ER variable's P = 0.009, χ2 = 9.49; course variable's P = 0.00, χ2 = 48.64; ALSFRS-r variable's P = 0.001, χ2 = 13.78).
Relationships of diagnosis levels and other variables
Overall, we observed a strong direct association between elimination rate and ALS status. As indicated in Table 3, ER and ALSFRS-r were significantly different between the “advanced-phase” and “early-phase” ALS groups. Although there was no significant difference in ALSFRS-r slope between these two groups, the median of advanced-phase ALS was slightly greater than that of early-phase ALS.
Table 3.
Relationship of diagnosis levels and other variables
| Variables | Advanced-phase ALS (definite and probable) | Early-phase ALS (laboratory support and possible) | Statistical value | P |
|---|---|---|---|---|
| Course (years) | 1.00, 1.21, 2.88 | 1.00,2.00,4.80 | −0.871† | 0.384 |
| FRSr (U) | 34.88 (9.27) | 39.28 (7.59) | −2.75‡ | 0.007* |
| ER (mmol·L−1·min−1) | −17.33, −5.67, 4.00 | −25.17, −11.33, −3.50 | −1.971† | 0.049* |
| FVC (predicted %) | 88.50 (14.57) | 88.00 (13.90) | 0.502‡ | 0.619 |
| FRSr slope (U/year) | 4.53, 9.25, 17.99 | 2.06, 6.17, 15.75 | −1.397† | 0.163 |
| Average lactate (mmol/L) | 0.75 (0.25) | 0.78 (0.29) | −0.788‡ | 0.432 |
*P<0.05, statistical significance, two-tailed test. †Z test; ‡t-test. ER: Elimination rate; ALS: Amyotrophic lateral sclerosis; FVC: Forced vital capacity; FRSr: Functional rating scale-revised. Course, ER and FRSr slope are expressed as minimum, median and maximum values. FRSr, FVC (predicted %) and average lactate as mean (standard deviation).
Correlation of clinical variables and laboratory indexes
Lactate 15 and FVC (predicted %) were moderately correlated (r = 0.405, P = 0.000). ER was also moderately correlated with FVC (predict %) (r = −0.458, P = 0.006) and lightly correlated with ALSFRS-r slope (r = 0.33, P = 0.007). No significant correlations were observed among other lactate levels, deuterogenic values, ALSFRS-r score, ALSFRS-r slope, or course of disease. The correlations of the elimination rate with FVC (standard beta = −0.458, P = 0.006) and ALSFRS-r slope (standard beta = 0.33, P = 0.007) were confirmed using multiple linear regression analyses. However, there were no correlations between the disease course, from onset to enrolment, and ALSFRS-r and variables of lactate.
Survival analysis
After 3 years of follow-up, eight patients lost contact. The Kaplan–Meier survival curve is shown in Figure 1, total log-rank showed χ2 = 1.111, P = 0.292.
Figure 1.
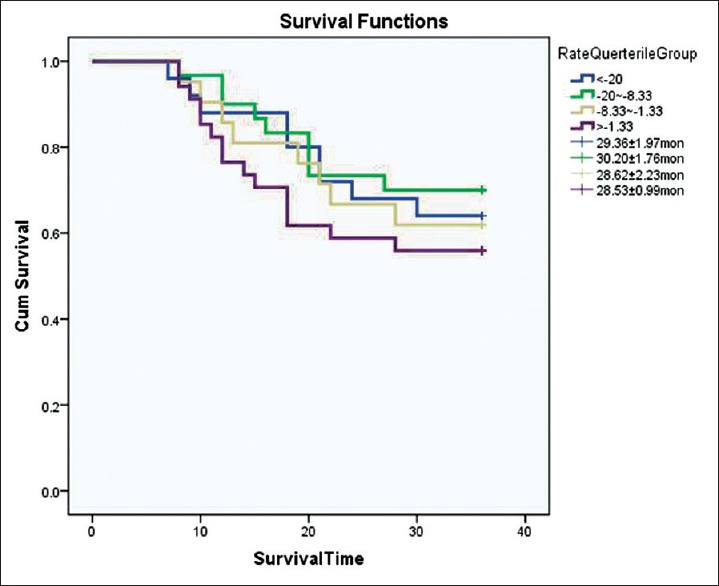
Kaplan–Meier survival curve for different eliminating rate in amyotrophic lateral sclerosis.
DISCUSSION
Finsterer[9] studied ALS in 15 patients and 66 healthy controls using LST, and he showed lactate level in ALS patients at rest before exercise was 1.42 ± 0.53 mmol/L, while the lactate level after 15 min of cycling was 2.69 ± 1.68 mmol/L, and at 15 min after cycling the lactate level was 2.18 ± 1.61 mmol/L. This author also observed a correlation between Norris score and the average value of lactate (r = −0.33, P < 0.05). Siciliano et al.[10] performed a similar test, showing improvements in lactate levels after exercise and a postponement of recuperation. Furthermore, the relationship between the levels of reactive oxygen species and lactate production indicated a close association between mitochondrial function and oxidative stress in ALS. However, whether lactate levels are correlated with clinical variables or with disease progression remains unknown. This observation suggested that mitochondrial dysfunction is likely an important contributing factor to ALS pathogenesis and progression.
In this study, we observed elevated lactate levels after exercise and postponement of recuperation in ALS patients, consistent with previous research. An increase in serum lactate primarily reflects either increased lactate production or decreased lactate clearance. At the same time, increased lactate production primarily reflects anaerobic glycogenesis, bypassing the citrate cycle and the respiratory chain. Enrolled patients with normal hepatic and renal function showed that decreasing ER could be attributed to increased lactate production. Since we primarily excluded defective respiratory chain enzymes cytopathies, the result suggested in a reactive change from aerobic to anaerobic phosphorylation of adenosine diphosphate and an equilibrium shift of the pyruvate/lactate reaction toward lactate.[13]
The slower disease progression group had an elevated ER while the group of patients with more aggressive ALS had a decreased ER. Multiple linear regression analysis showed that the accumulation of lactate was a negative linear variable dependent on ALSFRS-r slope and FVC (predicted %). The impaired ER levels could, therefore, be a consequence of the disease and not a risk factor for it. These data also support the hypothesis that mitochondrial dysfunction plays a role in ALS pathogenesis and progression. ALSFRS-r slope and FVC (predicted %) are validated predictors of ALS survival rates, the correlation suggesting that lactate elimination rate is a potential biomarker of ALS progression. Although the differences in survival rates between the different ER groups were not statistically significant, a trend of increased survival with increasing ER was observed.
In this study, we found that the advanced-phase ALS group (definite and probable) had a statistically significant slower ER, and the early-phase ALS (laboratory-supported probable and possible ALS) had a faster ER, which is consistent with our conceptualized hypothesis. In this study, we classified laboratory-supported probable ALS as having no muscle atrophy in the early phase of ALS, although the patients suffered from muscle damage during electrophysiology. We observed significantly slower ER in advanced-phase ALS reflecting severe muscle impairment. The slope of motor decline in the early-phase group indicated mild ALSFRS-r and a faster ER. Thus, we propose that ER is a subclinical indicator of disease progression.
As an easily accessible and affordable technology, LST has been used widely to measure ER. This indicator is useful for the identification of ALS patients who are likely to have relatively fast or slow progression. Meaningful significance would ensure optimal and appropriate planning of care (such as early access to gastrostomy, communication devices, or noninvasive ventilation). The finding of ER as a potential biomarker could be useful in identifying potentially beneficial drugs and in eliminating ineffective therapies. The expedited process could substantially reduce the length of clinical trials, the need for large placebo-controlled groups, and the reliance on animals. However, the validity and utility of ER as a biomarker must be confirmed by an adequately powered longitudinal study.
The disease duration, from the onset of symptoms to the time when the venous blood sample was drawn, did not affect the ER. The patients showed no significant differences in lactate levels or indexes among the four groups, according to the interquartiles. It is, therefore, possible that lactate elimination occurs before disease onset or at least early in the course of the disease. Therefore, we hypothesise that lactate accumulation does not reflect disease duration. A likely interpretation is that the duration is influenced by multiple factors, and mitochondrial dysfunction is a coordinator, but not an initiator, of ALS. We attributed this different observation to the detection bias between the Norris scale and ALSFRS-r for ALS motor function. In addition, the severity of motor deficits can be expressed by many factors, while the slope more sensitively reflects disease progression. FVC (predicted %) is another predictor of survival, but this relationship did not generate powerful evidence. In the future, we will examine more patients in an adequately designed longitudinal study.
Financial support and sponsorship
Nil.
Conflicts of interest
There are no conflicts of interest.
Footnotes
Edited by: Xiu-Yuan Hao
REFERENCES
- 1.Rothstein JD. Current hypotheses for the underlying biology of amyotrophic lateral sclerosis. Ann Neurol. 2009;65(Suppl 1):S3–9. doi: 10.1002/ana.21543. doi: 10.1002/ana.21543. [DOI] [PubMed] [Google Scholar]
- 2.Menzies FM, Cookson MR, Taylor RW, Turnbull DM, Chrzanowska-Lightowlers ZM, Dong L, et al. Mitochondrial dysfunction in a cell culture model of familial amyotrophic lateral sclerosis. Brain. 2002;125(Pt 7):1522–33. doi: 10.1093/brain/awf167. doi: 10.1093.brain.awf167. [DOI] [PubMed] [Google Scholar]
- 3.Shi P, Gal J, Kwinter DM, Liu X, Zhu H. Mitochondrial dysfunction in amyotrophic lateral sclerosis. Biochim Biophys Acta. 2010;1802:45–51. doi: 10.1016/j.bbadis.2009.08.012. doi: 10.1016/j.bbadis.2009.08.012. [DOI] [PMC free article] [PubMed] [Google Scholar]
- 4.Sotelo-Silveira JR, Lepanto P, Elizondo V, Horjales S, Palacios F, Martinez-Palma L, et al. Axonal mitochondrial clusters containing mutant SOD1 in transgenic models of ALS. Antioxid Redox Signal. 2009;11:1535–45. doi: 10.1089/ars.2009.2614. doi: 10.1089/ARS.2009.2614. [DOI] [PMC free article] [PubMed] [Google Scholar]
- 5.Swerdlow RH, Parks JK, Pattee G, Parker WD., Jr Role of mitochondria in amyotrophic lateral sclerosis. Amyotroph Lateral Scler Other Motor Neuron Disord. 2000;1:185–90. doi: 10.1080/14660820050515179. [DOI] [PubMed] [Google Scholar]
- 6.Ghiasi P, Hosseinkhani S, Noori A, Nafissi S, Khajeh K. Mitochondrial complex I deficiency and ATP/ADP ratio in lymphocytes of amyotrophic lateral sclerosis patients. Neurol Res. 2012;34:297–303. doi: 10.1179/1743132812Y.0000000012. doi: 10.1179/1743132812Y.0000000012. [DOI] [PubMed] [Google Scholar]
- 7.Fukunaga K, Shinoda Y, Tagashira H. The role of SIGMAR1 gene mutation and mitochondrial dysfunction in amyotrophic lateral sclerosis. J Pharmacol Sci. 2015;127:36–41. doi: 10.1016/j.jphs.2014.12.012. doi: 10.1016/j.jphs.2014.12.012. [DOI] [PubMed] [Google Scholar]
- 8.Macchi Z, Wang Y, Moore D, Katz J, Saperstein D, Walk D, et al. A multi-center screening trial of rasagiline in patients with amyotrophic lateral sclerosis: Possible mitochondrial biomarker target engagement. Amyotroph Lateral Scler Frontotemporal Degener. 2015;16:345–52. doi: 10.3109/21678421.2015.1026826. doi: 10.3109/21678421.2015.1026826. [DOI] [PMC free article] [PubMed] [Google Scholar]
- 9.Finsterer J. Lactate stress testing in sporadic amyotrophic lateral sclerosis. Int J Neurosci. 2005;115:583–91. doi: 10.1080/00207450590522847. doi: 10.1080/00207450590522847. [DOI] [PubMed] [Google Scholar]
- 10.Siciliano G, D’Avino C, Del Corona A, Barsacchi R, Kusmic C, Rocchi A, et al. Impaired oxidative metabolism and lipid peroxidation in exercising muscle from ALS patients. Amyotroph Lateral Scler Other Motor Neuron Disord. 2002;3:57–62. doi: 10.1080/146608202760196011. doi: 10.1080/146608202760196011. [DOI] [PubMed] [Google Scholar]
- 11.Nardin RA, Johns DR. Mitochondrial dysfunction and neuromuscular disease. Muscle Nerve. 2001;24:170–91. doi: 10.1002/1097-4598(200102)24:2<170::aid-mus30>3.0.co;2-0. doi: 10.1002/1097-4598(200102)24:2<170::AID-MUS30>30CO;2-0. [DOI] [PubMed] [Google Scholar]
- 12.Finsterer J. Reproducibility of the lactate stress test. Metab Brain Dis. 2003;18:155–60. doi: 10.1023/a:1023867104002. doi: 0885-7490/03/0600-0155/0. [DOI] [PubMed] [Google Scholar]
- 13.Nashef L, Lane RJ. Screening for mitochondrial cytopathies: The sub-anaerobic threshold exercise test (SATET) J Neurol Neurosurg Psychiatry. 1989;52:1090–4. doi: 10.1136/jnnp.52.9.1090. doi: 10.1136/jnnp.52.9.1090. [DOI] [PMC free article] [PubMed] [Google Scholar]