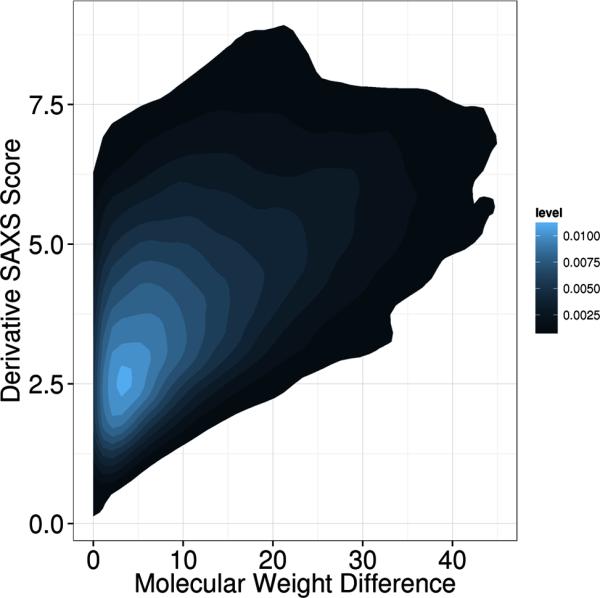
Figure7. The SAXS similarity scores χ in relation to molecular weight difference.

Molecular weights for all 455 proteins from the PISCES data set were calculated. The absolute value of the difference in weight between two proteins was computed for all pairs. The density plot depicts the difference in molecular weight on the x-axis and the derivative SAXS similarity score χ on the y-axis.
