

SUMMARY
Sleep dysfunction and stress susceptibility are co-morbid complex traits, which often precede and predispose patients to a variety of neuropsychiatric diseases. Here, we demonstrate multi-level organizations of genetic landscape, candidate genes, and molecular networks associated with 328 stress and sleep traits in a chronically stressed population of 338 (C57BL/6J×A/J) F2 mice. We constructed striatal gene co-expression networks, revealing functionally and cell-type specific gene co-regulations important for stress and sleep. Using a composite ranking system, we identified network modules most relevant for 15 independent phenotypic categories, highlighting a mitochondria/synaptic module that links sleep and stress. The key network regulators of this module are overrepresented with genes implicated in neuropsychiatric diseases. Our work suggests the interplay between sleep, stress, and neuropathology emerge from genetic influences on gene expression and their collective organization through complex molecular networks, providing a framework to interrogate the mechanisms underlying sleep, stress susceptibility, and related neuropsychiatric disorders.
INTRODUCTION
Both acute and chronic stress modulate many aspects of brain function, including cognition, emotion, behavior and sleep (Lupien et al., 2009). At the same time, stress-susceptible neurobehavioral functions also interact with one another, exerting a complex influence on an organism’s responses to stress (Martinez-Gonzalez et al., 2004; Minkel et al., 2012). In humans, stress susceptibility is characteristic of a range of neurological and psychiatric disorders (Lupien et al., 2009), many of which are also comorbid with sleep disturbances (Goldstein and Walker, 2014). In addition, sleep loss during stressful periods exacerbates the risk of neurobehavioral impairment, psychiatric distress and the development of depression later in life (Breslau et al., 1996; Chang et al., 1997). Despite the breadth of evidence documenting the interactions between stress and sleep, the genetic and molecular mechanisms underlying these interactions remain largely unclear. Both stress responses and sleep regulation are under strong genetic control (Feder et al., 2009; O’Hara et al., 2007), and a number of genes regulating sleep also contribute to stress adaptation and related psychiatric disorders (Chen et al., 2006; Turek, 2007; Yu et al., 2012). Although these findings point towards common molecular mechanisms underlying stress susceptibility and sleep, a comprehensive understanding of the molecular and genetic basis for these overlapping phenotypes remains lacking.
A systems approach is necessary to understand how multiple genetic factors interact in networks and contribute to the emergence of complex traits, including stress and sleep. Previously, such approaches have helped provide insights into both fundamental biological processes (Archer et al., 2014; Millstein et al., 2011; Zhu et al., 2012) and complex diseases (Chen et al., 2008; Emilsson et al., 2008; Wang et al., 2012; Zhang et al., 2013). A comprehensive analysis describing the interactions between stress and sleep has not previously been reported, and there are only a few examples demonstrating molecular mechanisms common to stress and sleep. Here, we address these issues by presenting a large dataset comprising 328 stress- and sleep- related phenotypes measured in a chronically stressed F2 mouse population (N = 338) derived from C57BL/6J (B6) and A/J. To interrogate the possible common genetic factors underlying these stress and sleep phenotypes, we collected genotypes at 781 informative SNP markers throughout the genome. In a randomly selected subpopulation of 100 F2 mice, we performed RNA-Seq gene expression profiling of the striatum, a brain region particularly important for stress adaptation (Ahmad et al., 2010; Rossi et al., 2009), sleep-wake regulation (Earley et al., 2013; Kim et al., 2010; Lazarus et al., 2012; Qiu et al., 2010; Stoffers et al., 2013), and neuropsychiatric diseases (Shepherd, 2013; Tritsch and Sabatini, 2012; van den Heuvel et al., 2010). Given its important roles in sleep, stress, and disease, the striatum is ideal for investigating common molecular networks underlying sleep and stress traits. With extensive genotypic, molecular, and phenotypic assays, we utilize an integrative, multi-scale systems approach to characterize the genetic landscape, candidate causal genes, and gene transcriptional networks shared by stress and sleep traits. We also report that genes implicated in neuropsychiatric disorders are overrepresented in key regulators of stress-sleep gene networks, providing a potential molecular basis for the comorbidity of stress, sleep, and neuropathologies. Our systems analysis provides a framework for identifying and prioritizing pathways and therapeutic mechanisms associated with abnormal stress responses and altered sleep, and offers biological insights into the roles of stress and sleep in neuropsychiatric pathophysiology.
RESULTS
A (B6×A/J) F2 Mouse Population Models Complex Interactions between Stress and Sleep
A genetically segregating population of 338 (B6×A/J) F2 male mice was subjected to a chronic, unpredictable stress schedule (Figure 1), during which we measured multiple stress-related behavioral and physiological phenotypes. Mice were then surgically implanted with electroencephalography (EEG) and electromyography (EMG) electrodes to record sleep/wake states. Upon euthanasia, serological parameters and tissue/organ weights were also obtained. We selected 328 phenotypic measurements with large variance in this population for analysis (Figure S1), and we grouped these phenotypes into 29 broad categories (full list in Table S1).
Figure 1. Experimental design and analytic approach.
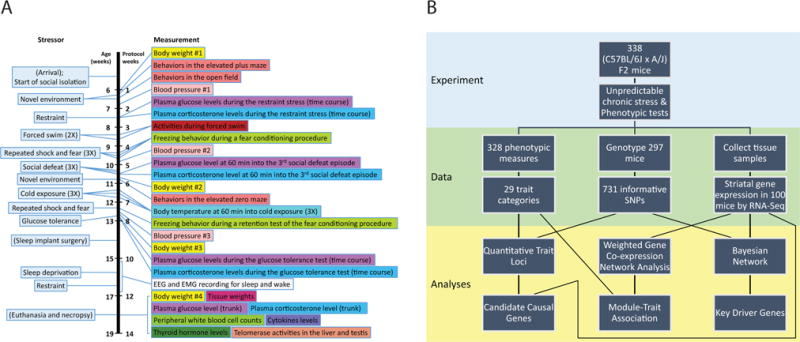
A population of (B6×A/J) F2 mice underwent a chronic unpredictable stress protocol, data collected during which enables modeling of genetic and molecular networks underlying responses to these stresses.
(A) The sequence of chronic unpredictable stress treatments and phenotypic data collection (see Extended Experimental Procedures for details).
(B) Schematic diagram of the molecular and physiological data collection and integrative analysis.
We identified correlations between phenotypes using Spearman’s rho and assessed false discovery rate (FDR) using the Benjamini-Hochberg procedure (Figure 2, Table S2). We observed associations between traits within the same phenotypic categories, as well as across different categories. At FDR < 0.10, we identified 3491 pairs of significantly correlated phenotypes. As expected, strong correlations between phenotypes within the same category are prevalent, confirming the overall quality of the phenotypic measurements and categorical groupings. In addition, many known interactions between distinct aspects of stress and sleep biology were observed. This includes well-known physiological relationships, such as body weight measurements and plasma glucose levels (Figure 2C and G), as well as previously reported associations between sleep and stress traits, such as conditioned fear and REM sleep (Figure 2B and F) (Menz et al., 2013; Polta et al., 2013). Other phenotypic relationships were also observed. For instance, corticosterone levels at 60 min into the 3rd (i.e., last) exposure of a 3-day social defeat procedure were specifically correlated with EEG theta I (4–8 Hz) and theta II (8–11 Hz) power densities in REM sleep measured across multiple conditions (Figure 2D and H). This comprehensive phenotypic dataset models interactions between stress and sleep, providing an opportunity to study genetic and molecular mechanisms underlying stress, sleep and their interactions. Phenotypic correlation data is available in its entirety to facilitate future study of additional phenotypic relationships (Table S2).
Figure 2. Phenotypic interactions observed in the chronically stressed (B6×A/J) F2 mice.

(A–D) Correlation coefficients between pairs of phenotypes. The phenotypes were ordered according to their phenotypic categories.
(E–H) Statistical significance of observed associations. The phenotypes were ordered exactly the same as in (A–D).
Abbreviations: BL, baseline; SDR, sleep deprivation recovery; Rst, after restraint stress; AUC, area under the curve.
Note: 93 sleep measurements that were not grouped into any of the sleep categories are not presented here, but are included in Table S2.
A Stress-modulated Dynamic Genetic Landscape Reveals Linked Genetic Control of Stress and Sleep Phenotypes
To reveal the genetic landscape of stress and sleep biology, we mapped quantitative trait loci (QTL) that regulate stress and sleep phenotypes. The dataset was permuted 1000 times to estimate the FDR. At a permissive FDR < 0.2 (LOD > 3.53), we uncovered 143 QTL for the set of 328 stress and sleep phenotypes (Figure 3A, Table S3). We confirmed a number of QTL that were previously identified using genetically diverse mouse populations derived from B6 and A/J. These include a Chromosome 1 (Chr.1) QTL (peaking at 70–80 cM) influencing open field activities (Gershenfeld and Paul, 1997), a Chr.1 QTL (peaking at ~75 cM) for body weight (Zhang and Gershenfeld, 2003), and a Chr.7 QTL (peaking at ~50 cM) co-localized with the albino (Tyr) locus influencing conditioned fear (Ponder et al., 2008).
Figure 3. Identification of QTL that influence stress and sleep phenotypes.
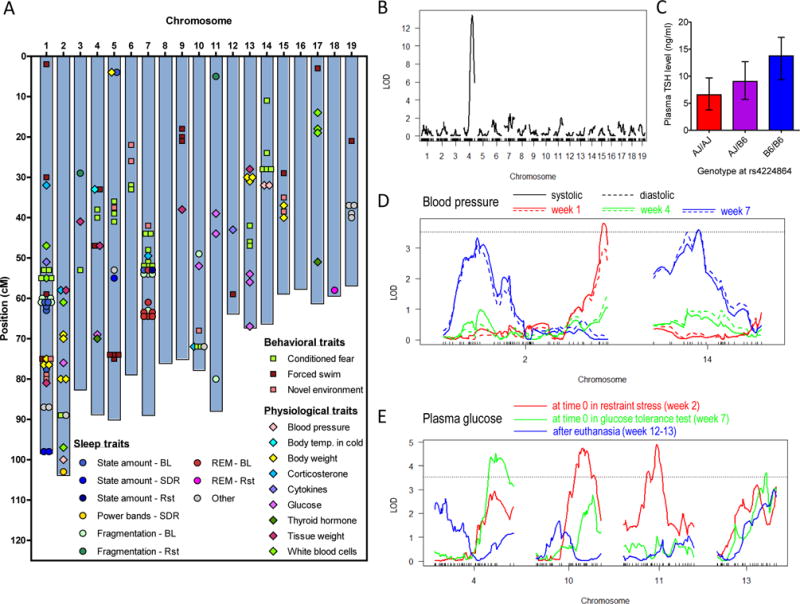
(A) Genetic landscape of stress and sleep. Genomic locations of the 142 identified QTL (FDR < 0.2) are shown (also see Table S3). Abbreviations: BL, baseline; SDR, sleep deprivation recovery; Rst, after restraint stress.
(B) A highly significant QTL for plasma TSH level on Chr.4. LOD, log of odds.
(C) Median ± inter quartile range of plasma TSH level as a function of genotype at rs4224864, the most strongly associated SNP in the Chr.4 QTL region.
(D) Distinct QTL were linked to blood pressure measured at different times of the chronic stress protocol.
(E) Baseline plasma glucose levels were linked to QTL with consistent effect throughout the chronic stress treatment as well as QTL specific to different stages of the protocol. Note that while a 6-h fasting procedure preceded the glucose tolerance test and the glucose measurement at time 0 (i.e., week 7), it did not appear to have a significant effect on the genetic control of glucose, as it did not result in presence or absence of a QTL specific to the baseline glucose measurement at week 7. The most distinct genetic regulations of baseline glucose levels were observed between week 2 (i.e., most naïve) and week 12–13 (i.e., most experienced).
Interestingly, we identified a number of QTL that were not previously detected when the same phenotypes were studied using unstressed B6×A/J populations. Notably, the most significant QTL (LOD = 13.4) identified in our chronically stressed mice is located at 69.58 cM on Chr.4, which strongly influenced the plasma thyroid-stimulating hormone (TSH) levels measured at euthanasia (Figure 3B). Median TSH levels in mice with the homozygous B6 genotype at the QTL were twice as high as in mice with the homozygous A/J genotype (Figure 3C). This QTL was not detected in a recent study of unstressed B6×A/J recombinant inbred mice (McLachlan et al., 2014). As prior exposures to stress are known to modulate the activity of the hypothalamic-pituitary-thyroid axis and the TSH profile (Armario et al., 1993), our results may suggest that TSH levels are regulated by an interaction between the Chr4 QTL and chronic stress exposure.
To demonstrate further how prior stress exposure may modulate the genetic control of physiological parameters, we investigated repeated measures of phenotypes across the chronic stress protocol. Blood pressure was measured at week 1, week 4 and week 7 (Figure 1A). Significant phenotypic correlations were observed between week 1 and week 4 measurements as well as between week 4 and week 7 measurements, but not between week 1 and week 7 measurements (Table S2). Interestingly, this observation is accompanied by the involvement of distinct QTL (Figure 3D). At week 1, blood pressure was influenced by a QTL located on the distal portion of Chr.2, while a significant QTL on Chr.14 and a suggestive QTL on the proximal portion of Chr.2 were identified at week 7. No significant QTL at FDR < 0.2 was found at week 4. We noticed a similar phenomenon for baseline plasma glucose levels in the absence of acute stress (Figure 3E). These data suggest that even basic physiological parameters are regulated by complex genetic architecture, and that such regulation is highly susceptible to prior stress experiences.
The genetic landscape of stress and sleep revealed a number of co-localized QTL influencing distinct phenotypic categories (Figure 3A). Amongst the 143 significant QTL, 83 were mapped to a locus less than 10 cM from a QTL for a phenotype of a different category. For example, a cluster on Chr.1 includes QTL that influence open field activities, body weight, a baseline NREM trait, and a forced swim test measure (Figure 3A, Table S3). Furthermore, QTL for conditioned fear on Chr.7 co-localize not only with the albino locus, but also with loci influencing open field activities, corticosterone levels during restraint stress, and sleep parameters both under baseline conditions and after restraint stress. In summary, our analysis characterizes a rich genetic landscape and identifies many co-localized QTL that may underlie the interactions between stress and sleep and their effects on other behavioral and physiological parameters.
Identification of Candidate Causal Genes Underlying Stress and Sleep QTL
Limited by the number of meiotic recombinations, a QTL identified using ~300 F2 mice typically spans a ~20-cM genomic region, harboring hundreds of genes (Li et al., 2005). To identify candidate genes underlying the sleep and stress QTL, we integrated the QTL data with RNA-seq expression data of 26,927 striatal genes and associated these molecular data to the 15 phenotype categories (Figure 4) that are known to be influenced by the striatum. We focused on phenotypic QTL that overlapped with loci regulating gene expression (i.e., eQTL; see Extended Experimental Procedures) and utilized conditional independence models to determine whether expression variation of the gene mediates the QTL effect and causes phenotypic variations (Millstein et al., 2009; Schadt et al., 2005). This causality test is quite robust and has successfully identified causal genes for complex sleep traits (Millstein et al., 2011) that were later pharmacologically validated (Brunner et al., 2011).
Figure 4. A network view of striatal genes causal to selected behavioral and sleep phenotypes.
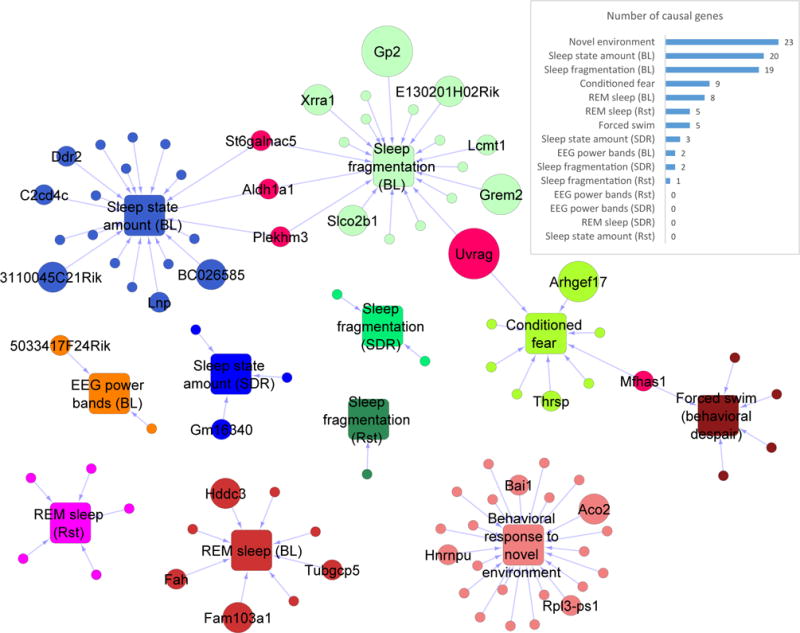
Circles represent genes and squares represent phenotypic categories. The circle is sized in proportion to the number of phenotypes for which the gene tests causal. Circles and squares are colored according to phenotype categories, with colors assigned to genes from the category of the phenotypes for which the genes test causal. The 5 pink circles represent genes causal to phenotypes of multiple distinct categories. Insert: the number of genes found causal to at least one phenotype in each category. Abbreviations: BL, baseline; SDR, sleep deprivation recovery; Rst, after restraint stress. See Table S4 for the full list.
In this analysis, we identified 92 causal genes at P < 0.05 (Table S4), several of which have already been well supported. For example, somatostatin signaling is known to modulate anxiety-like behaviors and adaptive responses to stress (Stengel et al., 2013), and we identified Sstr3 (somatostatin receptor 3) as a causal gene for the number of entries into the center of open field arena. Our analysis also reveals many other causal candidates, some of which are causal for several traits. For example, Arhgef17 is one of 28 genes that are relevant to multiple phenotypes (Figure 4), testing causal for 4 conditioned fear measures. Arhgef17 encodes a RhoGEF, which regulates Rho GTPase and downstream kinases, a signaling pathway known to affect conditioned fear memory (Lamprecht et al., 2002). Taken together, the causality test revealed a large number of high-profile candidate genes linking genetic variability to functional consequences in sleep and stress-related affective behaviors.
In addition, 5 genes are causal for phenotypes from multiple categories (Figure 4). For instance, Aldh1a1 was found causal for baseline sleep fragmentation and state amount measures. Aldh1a1 encodes an aldehyde dehydrogenase important for the synthesis of retinoic acid (Fan et al., 2003), a molecule involved in sleep/wake regulation (Kitaoka et al., 2011). Interestingly, the causality test identified only one gene, Uvrag (UV radiation resistance associated gene), that directly links sleep and stress-related behavioral phenotypes. Uvrag tested causal for 3 conditioned fear traits and 2 baseline sleep fragmentation phenotypes in our experiment. Though its role in the central nervous system remains unclear, it responds to various cellular stresses, maintains chromosomal stability and promotes autophagy (Liang et al., 2006; Zhao et al., 2012). While our causality analysis uncovered causal genes relevant to particular traits, it identified few pleotropic causal genes. This suggested that analysis on the level of gene networks rather than individual genes was needed to sufficiently capture the molecular relationship between concomitant stress and sleep phenotypes.
Network Organization of Striatal Gene Expression Exhibit Functional and Cell-type Specificity
We constructed coexpression networks for the striatum of the (B6×A/J) F2 mice and identified 62 independent transcriptional modules (Figure 5A), each named with an arbitrarily assigned color. Twenty-eight modules are enriched for genes in specific biological pathways and gene ontology (GO) functional groups (Table S5). Transcriptional coexpression of genes suggest similar regulatory control (Zhang and Horvath, 2005), and we identified many co-regulatory relationships between known genes of interest and other gene groups. For example, the Indianred4 module includes four genes commonly associated with the molecular circadian pathway, Csnk1e, Arntl, Cry1, and Hdac3. Interestingly, this module is functionally enriched for chaperone (p = 3.36×10⁻⁵, 3.89x) and stress response (p = 3.6×10⁻⁵, 7.32x) GO categories, and includes a number of heat shock proteins traditionally implicated in disease pathways. These relationships suggest that seemingly diverse molecular pathways may be under similar regulatory control in the striatum. Using cell-type specific gene signatures from the Allen Brain Atlas (Lein et al., 2007), we also identified several cell-type specific modules, including an oligodendrocyte-enriched Darkolivegreen module (p = 2.8×10−64, 54.3x) and a neuron-enriched Turquoise module (p = 8.1×10⁻⁴, 2.24x). Previous studies have described the functional and pathophysiological importance of cell-type specific modules in the human brain (Oldham et al., 2008; Zhang et al., 2013), so we considered these modules particularly interesting candidates for downstream analysis.
Figure 5. Identification of gene co-expression modules relevant to selected behavioral and sleep phenotypes.
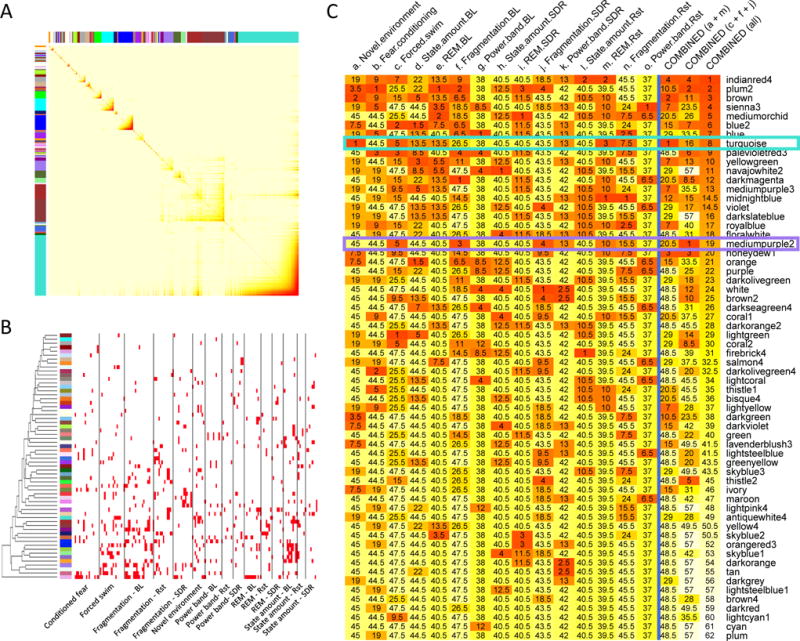
(A) The topological overlap matrix (TOM) plot corresponds to the striatal gene coexpression network. Darker color indicate stronger co-regulation between a pair of genes (in rows and columns). Gene modules are identified by hierarchical clustering of the matrix, as labeled by arbitrarily assigned color bars on the top and at the left.
(B) Identification of modules (rows) significantly associated with selected phenotypes (columns) organized in categories. Gene modules are indicated by their assigned color at the left. Red bars indicate significant associations (P < 0.05 and FDR < 0.05).
(C) Ranking of modules (rows) based on relevance to individual phenotypic categories and combined categories of interest (columns). Module rankings for a phenotypic category were determined by the number of significant module-trait associations within the phenotypic category. For a combination of multiple phenotypic categories, rankings for each category were summed to determine a composite ranking for each module. Darker color indicate higher ranking. The actual rankings are also labeled.
Abbreviations: BL, baseline sleep; SDR, sleep deprivation recovery; Rst, sleep after restraint stress.
Striatal Gene Co-expression Modules Link Distinct Aspects of Sleep and Stress Biology
Genetic variability and its effect on gene expression contribute to both module organization and phenotypic segregation in our chronically stressed mice. Our causality test results suggest that it is difficult to link complex phenotypes through single pleiotropic genes and that a network-based approach may help better understand common molecular bases linking complex phenotypes. By correlating modules with phenotypes, we identified specific traits most relevant to striatal coexpression modules. Previous efforts have focused on relating modules to a single class of traits (Zhang et al., 2013), but our extensive phenotyping assays enabled us to identify module-phenotype associations in 15 independent trait categories (Figure 5B). We ranked module relevance for each phenotype category and identified modules shared by multiple phenotypic classes (see Extended Experimental Procedures and Table S5).
Module ranking across phenotypic categories reveals numerous relationships between distinct aspects of stress responses and sleep. For example, the Turquoise module ranks 1st for novel environment behavioral responses and 3rd for REM traits after restraint stress, giving it the highest composite ranking for these traits (Figure 5C). Interestingly, it is highly enriched with causal genes for behavioral responses to novel environment (15 of the 23 causal genes; p = 2.9×10⁻⁷, 3.9x). This result complements the module ranking by providing strong gene-level evidence for its relationship to novel environment stress. The Turquoise module is also enriched with genes in the mitochondrial membrane (p = 1.23×10⁻¹², 1.89x) and synaptic (e.g., a variety of neurotransmitter receptors; p = 1.01×10⁻⁹, 1.85x) GO categories, which is consistent with its neuron-specific gene signature described above. A growing body of evidence suggests that mitochondria modulate synaptic plasticity, contribute to many central nervous system (CNS) diseases, and can serve as an important therapeutic target (Manji et al., 2012). Our results support the hypothesis that mitochondria and synaptic mechanisms are highly integrative, and suggests that this relationship fundamentally exists at the level of transcriptional co-expression, at least in the striatum. Because mitochondrial and synaptic impairment is characteristic of CNS diseases, it is particularly interesting that the Turquoise module is most relevant to both behavioral responses to novel environment and REM sleep after acute restraint stress. Specifically, increased module expression correlates with increased anxiety measures, as well as increased REM bouts and decreased median inter-REM interval in the first half of the dark period after restraint stress (Table S5). Transcriptional co-regulation of mitochondrial and synaptic genes may provide a mechanistic basis for the comorbidity of anxiety, stress-related REM sleep disruptions, and neuropathology.
Bayesian Network Reconstruction Identifies Key Driver Genes Linking Sleep and Stress
We used Bayesian network reconstruction to calculate causal probabilistic relationships between genes and identify the causal regulators (i.e., key drivers) of transcriptional networks linking stress and sleep traits. We utilized cis-eQTL (FDR < 0.1) as causal anchors in our directed probabilistic network and reconstructed a single consensus Bayesian network from 18,460 genes with the greatest variance across the mouse population (Extended Experimental Procedures). We intersected the full Bayesian network with the Turquoise module and identified the key driver genes that primarily control the expression of the module. Our agnostic approach identified many key drivers that have been supported by other experiments. For instance, we identified Slc17a7, Fmr1, and Grm5 as striatal key drivers, which have previously been implicated in regulating anxiety-related behavior (Moy et al., 2009; Tordera et al., 2007; Varty et al., 2005). We also identified Syngr1 as a key driver, which is differentially regulated in an animal models of depression (Kroes et al., 2006) and has been genetically linked to panic disorder in humans (Hamilton et al., 2003). Furthermore, another key driver of the module, Pde10a (phosphodiesterase 10A), was reported as a candidate genes for conduct disorder (Dick et al., 2011) and has been tested as an antipsychotic target in animal models (Smith et al., 2013). Our results offer tissue-specific resolution, suggesting that the transcriptional actions of these key drivers in the striatum may contribute to the emergence of these anxiety-related traits in animal models and relevant psychiatric disorders in humans.
Since the Turquoise module is enriched with causal genes for anxiety-like behaviors, we investigated the organization of these causal genes in the subnetwork, and found that two causal candidates in the Turquoise module, Cadm2 and Kcnj9, are also key drivers. Kcnj9 encodes GIRK3, a subunit of G-protein-dependent inwardly-rectifying K+ channels. GIRK channels have been implicated in a variety of diseases, including anxiety (Pravetoni and Wickman, 2008) and addiction (Morgan et al., 2003). GIRK3 in particular is thought to modulate the availability of all GIRK channels on the plasma membrane through lysosomal trafficking, and thus may be key to GIRK-related disease mechanisms (Lüscher and Slesinger, 2010). Interestingly, GIRK3 (Kcnj9) is immediately downstream of another key driver gene, Mical2 (a microtubule associated monooxygenase), in its transcriptional subnetwork (Figure 6). Molecularly, MICALs link cytoskeletal dynamics, synaptic structure, vesicle trafficking, and redox signaling (Zhou et al., 2011). They also bind CasL, alleles of which are associated with neurological disease (Li et al., 2008). By regulating the expression of Kcnj9, Mical2 drives a metabotropic glutamate receptor (Grm2), which has been implicated in anxiety (Galici et al., 2006). Mical2 is also upstream of a GABAB receptor (Gabbr2), whose physiological properties are intimately linked with those of GIRK receptors (Lüscher and Slesinger, 2010). Furthermore, Mical2 is immediately upstream of several mitochondrial genes, including Dlc1, which is responsible for Bcl-2 activated mitochondrial-mediated apoptosis, and Nuak1, which controls synaptic plasticity and axon branching dependent upon mitochondria mobilization (Courchet et al., 2013; Sun et al., 2013). Taken together, this subnetwork suggests that Mical2 may serve as a striatal regulator of synaptic and mitochondrial pathways and contribute to mechanisms fundamental to sleep, stress and neuropathology.
Figure 6. Striatal Bayesian networks downstream of Mical2.
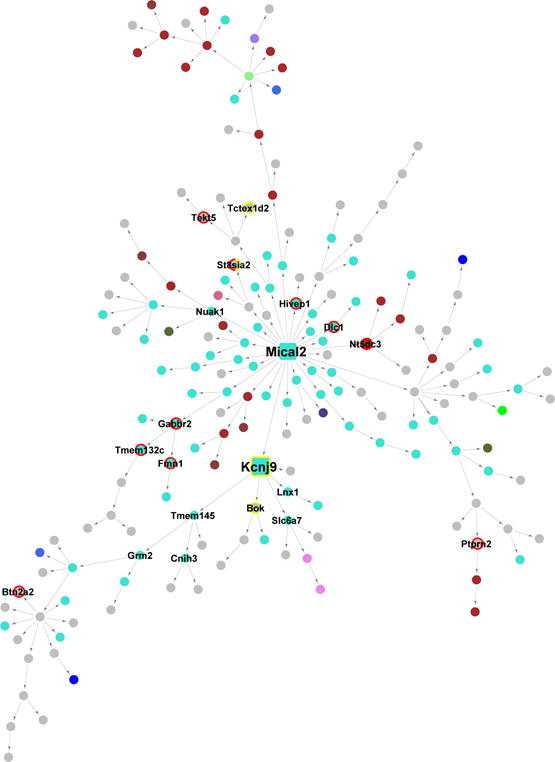
Each node represents a gene and each directed edge indicates a causal link between genes. Nodes are colored according to their module assignments, using the names of the respective modules. Key driver genes are represented by larger square nodes. Nodes with red rims denote homologs of human GWAS candidates for neuropsychiatric disorders, and nodes with yellow rims denote candidate genes identified in this study as causal to stress and sleep phenotypes. One node is labeled with a half red and half yellow rim, as the represented gene (St8sia2) is a both reported GWAS candidate for bipolar disorder and tested causal to a REM sleep phenotype in this study.
Key Driver Nodes of Stress and Sleep Subnetworks Are Implicated in Neuropsychiatric Diseases
Since the Turquoise module is strongly associated with anxiety-related traits in mice, we investigated whether its key drivers have been previously implicated in neuropsychiatric disease in humans. We queried the National Human Genome Research Institute Catalog of Published Genome-Wide Association Studies (GWAS) (Welter et al., 2014) for candidate genes associated with neuropsychiatric disorders (Table S5). Interestingly, mouse homologs of these GWAS genes are overrepresented in the Turquoise module (p = 2.98×10⁻⁵, 1.3x) and are more likely to overlap with the key drivers of the module than with downstream module genes (p = 0.02, 1.8x). Since GWAS data lacks mechanistic information, our results contextualize human gene-phenotype associations within a causal probabilistic model with tissue-specific resolution. Interestingly, key drivers of the Turquoise module are not exclusively related to neuropsychiatric diseases. Its key drivers are also overrepresented for genes involved in Parkinson’s disease (p = 0.01, 6.6x) and Huntington’s disease (p = 0.069, 4.8x) according to the KEGG (Kyoto Encyclopedia of Genes and Genomes) database. Taken together, these results suggest that genes associated with neurological and psychiatric diseases are important regulators of subnetworks linking stress and sleep traits.
The Mediumpurple2 Module Reveals Links between Stress, Sleep and Neurodegeneration
Links between neurodegeneration and key drivers of stress/sleep gene networks are not limited to the Turquoise module. The Mediumpurple2 module also links stress and sleep with neurodegeneration. It has the highest composite ranking for forced swim measures (5th), sleep fragmentation traits at baseline (3rd) and after sleep deprivation (4th) (Figure 5C). This module is enriched for the chromatin-modification GO category (p = 9.78×10⁻⁷, 5.7x), suggesting transcriptional control of chromatin-modifying genes may link depressive behaviors with sleep fragmentation. While the Mediumpurple2 module ranks highly for sleep fragmentation measures at baseline and after sleep deprivation, it ranks poorly for sleep fragmentation after restraint stress (15th). It is well known that different stressors correlate with different physiological sleep changes (Suchecki et al., 2012), and we present evidence that this phenomenon is also apparent on the gene network level. Examining top-ranking modules in each sleep fragmentation category further supports this observation. The White module is most highly ranked for sleep fragmentation after sleep deprivation, but does not correlate with a single sleep fragmentation measure after restraint stress. Likewise, the highest-ranking module for sleep fragmentation after restraint stress, Midnightblue, does not correlate with any sleep fragmentation phenotype after sleep deprivation. Our examination of module-trait relationships indicates that even transcriptional networks may be stressor-specific.
We also calculated key driver genes of the Mediumpurple2 subnetwork. Interestingly, key drivers of this module include Htt, whose polyQ expansion causes Huntington’s disease. Many other key drivers such as Bsn, Mll1, and Celsr3 has also been associated with ataxia, epilepsy, and neurodegeneration (Altrock et al., 2003; Lim et al., 2009; Tissir et al., 2005). The Htt and Bsn subnetworks converge to drive the expression of the gene encoding heavy chain of cytoplasmic dynein, Dync1h1 (Figure 7), whose mutations have been linked to Huntington’s disease-like striatal atrophy and metabolic defects (Braunstein et al., 2010; Eschbach et al., 2011). We found that 37% of the key drivers in this module are genes that cause motor abnormalities when disrupted, as catalogued by the Mouse Genome Database (Blake et al., 2014). This network enrichment (p = 8.4×10⁻⁴, 6.56x) suggests that genes classically associated with neurological disease drive subnetworks shared by stress and sleep traits. Patients of neurodegenerative diseases concomitantly suffer from psychiatric and sleep disorders (Morton, 2013; Sauerbier and Ray Chaudhuri, 2014), which often precede the disease onset (Postuma et al., 2012; Shirbin et al., 2013). While links between stress and neurodegeneration have been hypothesized (Kibel and Drenjancevic-Peric, 2008), studies on their connections at the genetic and molecular level are limited. Our results thus suggests that biological mechanisms linking stress, sleep and neurodegeneration may reside fundamentally in the network organization of striatal gene expression.
Figure 7. Striatal Bayesian networks downstream of Htt and Bsn.
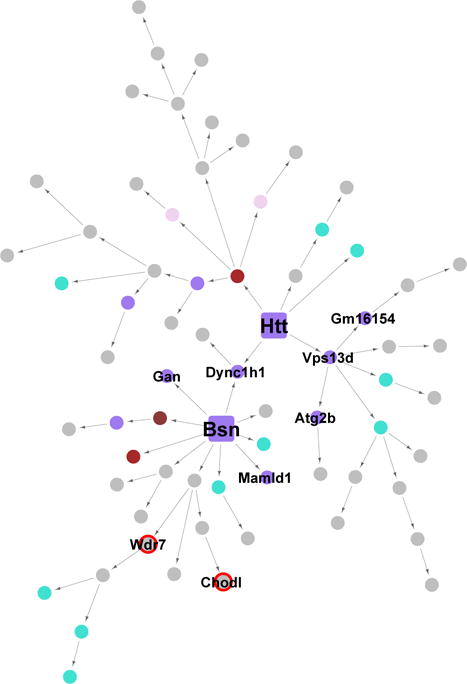
Each node represents a gene and each directed edge indicates a causal link between genes. Nodes are colored according to their module assignments, using the names of the respective modules. Key driver genes are represented by larger square nodes.
DISCUSSION
Sleep-wake and stress traits are controlled by complex genetic architectures (Feder et al., 2009; O’Hara et al., 2007). Here, we combined a multi-scale systems approach with extensive phenotyping to investigate how genetic variation and transcriptional networks contribute to the emergence of multiple sleep and stress phenotypes. We uncovered candidate genes underlying the associations between genetic and phenotypic variations using a causality test, but noted that this gene-level approach was limited. Consequently, we demonstrated that network-level analysis better captures the effect of numerous loci on the organization of transcriptional networks and the emergence of complex interacting phenotypes. Since stress maladaptation and sleep disturbance may precede and predispose patients to neuropsychiatric disease, understanding their molecular intersections is critical for developing a more sophisticated and nuanced conception of disease mechanism, progression, and therapeutic intervention (Goldstein and Walker, 2014). Our analysis indeed revealed that key drivers regulating sleep- and stress-related transcriptional networks are functionally important and significantly overlap with genetics associated with human neuropsychiatric diseases. This result not only contextualizes GWAS findings, but also suggests that the seemingly discrete GWAS genes can be functionally linked via gene regulatory networks important for stress and sleep. Furthermore, the broad overlaps between neuropsychiatric GWAS candidates and key drivers of stress/sleep gene networks support the concept that gene network structure can be used to predict functional consequences produced by molecular perturbations.
We have highlighted several module-trait relationships that link sleep, stress, and neuropsychiatric disease. In this paper, we highlight the coexpression of mitochondrial and synaptic genes and their relationship to anxiety-related behaviors and REM sleep traits after restraint stress. Since both sleep and stress disorders are common in many psychiatric diseases, these molecular networks can provide insights into the onset and maintenance of neuropsychopathology. We also provide a full catalogue of all module-traits relationships (Table S5) as a resource that can facilitate in silico hypothesis testing and in vivo validation of potential molecular mechanisms and therapeutic candidates relevant for chronic stress, sleep, and neuropathology.
Impaired mitochondrial and synaptic functions, similar to sleep dysfunction and stress susceptibility, are commonly linked with many neurological and psychiatric diseases. However, studies of the interaction between mitochondrial and synaptic pathways and its role in disease have produced conflicting and sometimes tenuous evidence, which speaks to the complexity of the biology and its consequent pathophysiology. Studying individual genes and pathways insufficiently explains this complex relationship, so a systems approach is ideal for identifying the basis of this interaction (Manji et al., 2012). In the present study, the Bayesian network reconstruction revealed many key driver genes that regulate both mitochondrial and synaptic pathways and may serve as potential therapeutic targets for human neuropsychiatric disorders. Mical2 is one particularly interesting example since it links multiple pathways related to CNS diseases. Although the molecular function of Mical2 in mammals has not been extensively characterized, several independent lines of evidence support the role of Mical2 in mediating anxiety behaviors and neuropathology. The expression of Mical2 is down-regulated in patients of major depressive disorder (Tochigi et al., 2008), in stress-susceptible rats after chronic restraint stress (Crews et al., 2012), and in offspring of prenatally stressed rats (Mychasiuk et al., 2011). Mical2 was also identified as a hub gene in a co-expression module implicated in human autism spectrum disorder (Parikshak et al., 2013), which has a significant anxiety/phobia component. Our analyses converge with these previous studies and provide strong evidence for the role of Mical2 in neuropsychiatric disease. Importantly, therapeutics targeting mitochondrial and synaptic pathways have been successful for treating CNS diseases and may represent an important direction for developing treatment for a range of neurological and psychiatric disorders (Manji et al., 2012). Therefore, the key drivers of the mitochondria/synaptic subnetwork represent strong therapeutic candidates and in fact include some genes with known therapeutic implications, such as Pde10a, a pharmacological target for psychotic disorders (Smith et al., 2013).
In the present study, we examined the striatum because it is critical for regulating motivation, stress susceptibility, and sleep, and is dysfunctional in many neuropsychiatric diseases. Our integrative analysis revealed that striatal gene networks are extensively shared by sleep and stress phenotypes and that these points of intersection are relevant to neuropsychiatric disease. However, many other brain regions are known to be involved in the regulation of stress and/or sleep. It is likely that coordinated organization and functionality of gene networks in multiple brain regions are required for appropriate stress adaptation and sleep regulation. Limited to only one brain region, our current analysis does not address tissue specificity or multi-tissue coordination of gene networks relevant to stress and sleep. Since we collected other brain regions and peripheral organs in our chronically stressed and extensively phenotyped (B6 × A/J) F2 mouse population, we are in a position to extend our systems approach to multiple tissues in future studies.
Finally, our data-driven systems approach has revealed a number of intriguing but unexpected results. For example, we found that key drivers of multiple networks linking sleep and stress are enriched with neurodegenerative genes, suggesting a molecular mechanism linking stress, sleep, and neurodegeneration. The frequency of this association in our networks suggests that neurodegenerative properties may be a general attribute of key driver nodes important for both stress and sleep, at least in the striatum, a brain region known to be prone to neurodegenerative diseases such as Huntington’s and Parkinson’s diseases. This hypothesis requires further investigation, but proposes that identifying common networks relevant to stress and sleep can reveal molecular mechanisms and therapeutic targets of neuropathology. Furthermore, although the main text of this paper focuses on 15 categories of phenotypes most relevant to the striatum, our data-driven approach can also be applied to the other 14 categories of phenotypes that are not classically associated with striatal function. As expected, the neuronal Turquoise module with mitochondrial and synaptic functionalities is almost exclusively associated with sleep and behavioral phenotypes and is not associated with phenotypes that do not directly involve the CNS, confirming the functional specificity of gene network organization. However, a number of associations between other striatal gene modules and non-CNS phenotypes were also observed. For instance, the modules enriched for cellular for stress response genes (Indianred4) and chromatin-modification genes (Mediumpurple2) ranked the highest for peripheral white blood cell measurements, whose association with the striatum is unknown. Some evidence suggests that the peripheral immune system plays an important role in stress resilience, cognition, and other central nervous system functions (Cohen et al., 2006; Kipnis et al., 2012; Schwartz and Kipnis, 2011), and our unbiased analyses support this link by showing that serological measurements of the peripheral immune system correlate with striatal transcriptional networks that are also associated with stress-related behavioral and sleep phenotypes. The precise relationship between the striatum and peripheral immune system is beyond the scope of this study, but this analysis can serve as complementary evidence for future investigations regarding the interactions between the functions of multiple organ systems involved in stress and sleep.
Overall, our analysis provides the foundation for a data-driven approach that links diverse phenotypes through common molecular networks, and our strategy considers the complex symptomatology of neuropsychiatric disease as a guide, rather than a hindrance, to our molecular analysis. We provide all the data and analysis results as a resource to the biomedical research community, and we expect it will guide future investigations into the biological mechanisms underlying stress, sleep, and related neuropathology.
EXPERIMENTAL PROCEDURES
Animals and Housing
All mice were housed and handled according to the Federal Animal Welfare guidelines and all studies were approved in advance by the Institutional Animal Care and Use Committee at Northwestern University. This study utilized 338 male (B6×A/J) F2 mice, bred at the Jackson Laboratory (Bar Harbor, ME). Animals arrived at Northwestern at 4–5 weeks of age and were individually housed in opaque cages without enrichment items for the duration of the study to create social isolation stress. Mice were maintained on a 12 hour light: 12 hour dark cycle at a room temperature of 23±2°C with food and water available ad libitum (except during test procedures).
Stress Procedures and Phenotypes
Mice were divided into twelve consecutively-run cohorts of 10–40 animals each, which were all subjected to the same chronic unpredictable stress protocol (Figure 1A) with accompanying phenotypic measurements (see Extended Experimental Procedures). The stressors included social isolation, novel exposed environments (elevated plus maze, open field, elevated zero maze), restraint, forced swimming, fear conditioning, social defeat, cold exposure, a metabolic stressor (6-hr fast and glucose tolerance test), and the sleep behavior response to sleep deprivation and restraint. Sleep/wake behavior was recorded from each mouse by surgically implanting EEG and EMG electrodes. Following all stress and sleep behavior tests, all animals were euthanized by decapitation, and blood and tissue samples collected for additional analyses. Phenotypes were functionally grouped into 29 categories; for sleep traits, factor analysis was used to confirm categories (Table S1).
Genotyping
Genotypes of all animals were determined from DNA extracted from tail-tip biopsies by using the Illumina medium density single nucleotide polymorphism (SNP) panel. A complete set of the genotypic data is provided in Table S1.
RNA-Seq
The striatum brain region was rapidly dissected from each mouse after euthanasia and frozen in liquid nitrogen. Gene expression from the striatum was evaluated using RNA sequencing. 100 bp single-end sequencing reads were aligned against the Ensembl NCBIM37 mouse reference genome for gene-level expression profiling.
Analysis Procedures
Details of analysis procedures are described in the Extended Experimental Procedures. Briefly, for the genome-wide QTL and eQTL scan, we used Haley–Knott (HK) regression in the r/qtl package. The sample order of the genotypic data was randomly permuted 1000 times to estimate false discovery rates (FDR) for phenotypic QTL. FDR for cis-eQTL and trans-eQTL were separately estimated based on 500 permutations.
In the causality test, we consider combinations of a trait (T), expression of a gene (G), and a locus (L) regulating both T and G. G tests causal to T if the following 4 conditions are met: 1) L is associated with T, 2) L is associated with G|T, 3) G is associated with T|L, and 4) L is independent of T|G.
To construct coexpression networks, we used a weighted gene coexpression network analysis (WGCNA) framework, in which gene expression correlations were weighted with a positive power in order to satisfy a “scale-free” power law connectivity distribution in the resulting network. Genes were then grouped into modules using hierarchical clustering based upon their topological overlap. Gene expression in a module was reduced to their first principal component and correlated with phenotypes to identify module-trait relationships.
Bayesian network reconstruction was used to decipher regulatory relationships among genes. To break Markov equivalent structures and infer causality, cis-eQTL data was used as causal anchors. We used a Monte Carlo Markov Chain (MCMC) simulation to reconstruct 1000 gene networks, evaluating the fit of each network with Bayesian Information Criterion (BIC). A single consensus network was constructed from these simulations and was used to identify key regulators of modules relevant to sleep and stress traits. We calculated the size of the h-layer neighborhood (HLN) downstream of each gene in the subnetwork resulting from the intersection between Bayesian network and the module. Genes were identified as causal network regulators (i.e., key drivers) if their HLN are greater than mean(μ) + σ(μ), where μ is the size of the respective HLN of each gene in the subnetwork.
Supplementary Material
Acknowledgments
This work is supported by the Defense Advanced Research Projects Agency, The U.S. Army Research Laboratory and the U.S. Army Research Office under government contract/grant numbers W911NF101006. The views, opinions, and/or findings contained in this work are those of the authors and should not be interpreted as representing the official views or policies, either expressed or implied, of the Defense Advanced Research Projects Agency or the Department of Defense. J.R.S is also supported by the National Institute of Mental Health of the National Institutes of Health under Award Number F30MH106293. The content of this work is solely the responsibility of the authors and does not necessarily represent the official views of the National Institutes of Health. The authors also thank Dr. Tingting Liu and Christopher J. Olker for the assistance in data and tissue collection.
Footnotes
AUTHOR CONTRIBUTIONS
P.J. and J.R.S. performed all data analyses and wrote the paper. F.W.T., A.K., and M.H.V. conceived the project and designed the studies. H.S.Y. also contributed to the study design. K.F., V.D.G, K.C.S., and M.H.V. performed the chronic stress treatment and collected phenotypic data. B.L. prepared the RNA-Seq data. K.H., B.Z., and A.K. supervised the genetic and gene network analyses. K.F., K.C.S., M.H.V., R.A., F.W.T., and A.K. also contributed significantly to the preparation of the paper.
ACCESSION NUMBERS
Raw and processed RNA-Seq gene expression data are available via the GEO database (accession number GSE60312).
References
- Ahmad A, Rasheed N, Banu N, Palit G. Alterations in monoamine levels and oxidative systems in frontal cortex, striatum, and hippocampus of the rat brain during chronic unpredictable stress. Stress. 2010;13:355–364. doi: 10.3109/10253891003667862. [DOI] [PubMed] [Google Scholar]
- Altrock WD, tom Dieck S, Sokolov M, Meyer AC, Sigler A, Brakebusch C, Fässler R, Richter K, Boeckers TM, Potschka H, et al. Functional inactivation of a fraction of excitatory synapses in mice deficient for the active zone protein bassoon. Neuron. 2003;37:787–800. doi: 10.1016/s0896-6273(03)00088-6. [DOI] [PubMed] [Google Scholar]
- Archer SN, Laing EE, Möller-Levet CS, van der Veen DR, Bucca G, Lazar AS, Santhi N, Slak A, Kabiljo R, von Schantz M, et al. Mistimed sleep disrupts circadian regulation of the human transcriptome. Proceedings of the National Academy of Sciences. 2014;111:E682–E691. doi: 10.1073/pnas.1316335111. [DOI] [PMC free article] [PubMed] [Google Scholar]
- Armario A, Martí O, Gavaldà A, Giralt M, Jolín T. Effects of chronic immobilization stress on GH and TSH secretion in the rat: Response to hypothalamic regulatory factors. Psychoneuroendocrinology. 1993;18:405–413. doi: 10.1016/0306-4530(93)90015-d. [DOI] [PubMed] [Google Scholar]
- Blake JA, Bult CJ, Eppig JT, Kadin JA, Richardson JE, Group, M.G.D. The Mouse Genome Database: integration of and access to knowledge about the laboratory mouse. Nucleic Acids Res. 2014;42:D810–817. doi: 10.1093/nar/gkt1225. [DOI] [PMC free article] [PubMed] [Google Scholar]
- Braunstein KE, Eschbach J, Rona-Voros K, Soylu R, Mikrouli E, Larmet Y, Rene F, Gonzalez De Aguilar JL, Loeffler JP, Muller HP, et al. A point mutation in the dynein heavy chain gene leads to striatal atrophy and compromises neurite outgrowth of striatal neurons. Hum Mol Genet. 2010;19:4385–4398. doi: 10.1093/hmg/ddq361. [DOI] [PMC free article] [PubMed] [Google Scholar]
- Breslau N, Roth T, Rosenthal L, Andreski P. Sleep disturbance and psychiatric disorders: A longitudinal epidemiological study of young Adults. Biological Psychiatry. 1996;39:411–418. doi: 10.1016/0006-3223(95)00188-3. [DOI] [PubMed] [Google Scholar]
- Brunner J, Gotter A, Millstein J, Garson S, Binns J, Fox S, Savitz A, Yang H, Fitzpatrick K, Zhou L, et al. Pharmacological validation of candidate causal sleep genes identified in an N2 cross. J Neurogenet. 2011;25:167–181. doi: 10.3109/01677063.2011.628426. [DOI] [PMC free article] [PubMed] [Google Scholar]
- Chang PP, Ford DE, Mead LA, Cooper-Patrick L, Klag MJ. Insomnia in Young Men and Subsequent Depression: The Johns Hopkins Precursors Study. American Journal of Epidemiology. 1997;146:105–114. doi: 10.1093/oxfordjournals.aje.a009241. [DOI] [PubMed] [Google Scholar]
- Chen Y, Zhu J, Lum PY, Yang X, Pinto S, MacNeil DJ, Zhang C, Lamb J, Edwards S, Sieberts SK, et al. Variations in DNA elucidate molecular networks that cause disease. Nature. 2008;452:429–435. doi: 10.1038/nature06757. [DOI] [PMC free article] [PubMed] [Google Scholar]
- Chen ZY, Jing D, Bath KG, Ieraci A, Khan T, Siao CJ, Herrera DG, Toth M, Yang C, McEwen BS, et al. Genetic Variant BDNF (Val66Met) Polymorphism Alters Anxiety-Related Behavior. Science. 2006;314:140–143. doi: 10.1126/science.1129663. [DOI] [PMC free article] [PubMed] [Google Scholar]
- Cohen H, Ziv Y, Cardon M, Kaplan Z, Matar MA, Gidron Y, Schwartz M, Kipnis J. Maladaptation to mental stress mitigated by the adaptive immune system via depletion of naturally occurring regulatory CD4+CD25+ cells. J Neurobiol. 2006;66:552–563. doi: 10.1002/neu.20249. [DOI] [PubMed] [Google Scholar]
- Courchet J, Lewis TL, Lee S, Courchet V, Liou DY, Aizawa S, Polleux F. Terminal axon branching is regulated by the LKB1-NUAK1 kinase pathway via presynaptic mitochondrial capture. Cell. 2013;153:1510–1525. doi: 10.1016/j.cell.2013.05.021. [DOI] [PMC free article] [PubMed] [Google Scholar]
- Crews D, Gillette R, Scarpino SV, Manikkam M, Savenkova MI, Skinner MK. Epigenetic transgenerational inheritance of altered stress responses. Proc Natl Acad Sci USA. 2012;109:9143–9148. doi: 10.1073/pnas.1118514109. [DOI] [PMC free article] [PubMed] [Google Scholar]
- Dick DM, Aliev F, Krueger RF, Edwards A, Agrawal A, Lynskey M, Lin P, Schuckit M, Hesselbrock V, Nurnberger J, Jr, et al. Genome-wide association study of conduct disorder symptomatology. Mol Psychiatry. 2011;16:800–808. doi: 10.1038/mp.2010.73. [DOI] [PMC free article] [PubMed] [Google Scholar]
- Earley CJ, Kuwabara H, Wong DF, Gamaldo C, Salas RE, Brašić JR, Ravert HT, Dannals RF, Allen RP. Increased synaptic dopamine in the putamen in restless legs syndrome. Sleep. 2013;36:51–57. doi: 10.5665/sleep.2300. [DOI] [PMC free article] [PubMed] [Google Scholar]
- Emilsson V, Thorleifsson G, Zhang B, Leonardson AS, Zink F, Zhu J, Carlson S, Helgason A, Walters GB, Gunnarsdottir S, et al. Genetics of gene expression and its effect on disease. Nature. 2008;452:423–428. doi: 10.1038/nature06758. [DOI] [PubMed] [Google Scholar]
- Eschbach J, Fergani A, Oudart H, Robin JP, Rene F, Gonzalez de Aguilar JL, Larmet Y, Zoll J, Hafezparast M, Schwalenstocker B, et al. Mutations in cytoplasmic dynein lead to a Huntington’s disease-like defect in energy metabolism of brown and white adipose tissues. Biochimica et biophysica acta. 2011;1812:59–69. doi: 10.1016/j.bbadis.2010.09.009. [DOI] [PubMed] [Google Scholar]
- Fan X, Molotkov A, Manabe SI, Donmoyer CM, Deltour L, Foglio MH, Cuenca AE, Blaner WS, Lipton SA, Duester G. Targeted Disruption of Aldh1a1 (Raldh1) Provides Evidence for a Complex Mechanism of Retinoic Acid Synthesis in the Developing Retina. Molecular and Cellular Biology. 2003;23:4637–4648. doi: 10.1128/MCB.23.13.4637-4648.2003. [DOI] [PMC free article] [PubMed] [Google Scholar]
- Feder A, Nestler EJ, Charney DS. Psychobiology and molecular genetics of resilience. Nat Rev Neurosci. 2009;10:446–457. doi: 10.1038/nrn2649. [DOI] [PMC free article] [PubMed] [Google Scholar]
- Galici R, Jones CK, Hemstapat K, Nong Y, Echemendia NG, Williams LC, de Paulis T, Conn PJ. Biphenyl-indanone A, a positive allosteric modulator of the metabotropic glutamate receptor subtype 2, has antipsychotic- and anxiolytic-like effects in mice. J Pharmacol Exp Ther. 2006;318:173–185. doi: 10.1124/jpet.106.102046. [DOI] [PubMed] [Google Scholar]
- Gershenfeld HK, Paul SM. Mapping Quantitative Trait Loci for Fear-like Behaviors in Mice. Genomics. 1997;46:1–8. doi: 10.1006/geno.1997.5002. [DOI] [PubMed] [Google Scholar]
- Goldstein AN, Walker MP. The Role of Sleep in Emotional Brain Function. Annual Review of Clinical Psychology. 2014;10:679–708. doi: 10.1146/annurev-clinpsy-032813-153716. [DOI] [PMC free article] [PubMed] [Google Scholar]
- Hamilton SP, Fyer AJ, Durner M, Heiman GA, Baisre de Leon A, Hodge SE, Knowles JA, Weissman MM. Further genetic evidence for a panic disorder syndrome mapping to chromosome 13q. Proc Natl Acad Sci USA. 2003;100:2550–2555. doi: 10.1073/pnas.0335669100. [DOI] [PMC free article] [PubMed] [Google Scholar]
- Kibel A, Drenjancevic-Peric I. Impact of glucocorticoids and chronic stress on progression of Parkinson’s disease. Med Hypotheses. 2008;71:952–956. doi: 10.1016/j.mehy.2008.06.036. [DOI] [PubMed] [Google Scholar]
- Kim YK, Yoon IY, Kim JM, Jeong SH, Kim KW, Shin YK, Kim BS, Kim SE. The implication of nigrostriatal dopaminergic degeneration in the pathogenesis of REM sleep behavior disorder. Eur J Neurol. 2010;17:487–492. doi: 10.1111/j.1468-1331.2009.02854.x. [DOI] [PubMed] [Google Scholar]
- Kipnis J, Gadani S, Derecki NC. Pro-cognitive properties of T cells. Nat Rev Immunol. 2012;12:663–669. doi: 10.1038/nri3280. [DOI] [PMC free article] [PubMed] [Google Scholar]
- Kitaoka K, Shimizu M, Shimizu N, Chikahisa S, Nakagomi M, Shudo K, Yoshizaki K, Séi H. Retinoic acid receptor antagonist LE540 attenuates wakefulness via the dopamine D1 receptor in mice. Brain Research. 2011;1423:10–16. doi: 10.1016/j.brainres.2011.09.023. [DOI] [PubMed] [Google Scholar]
- Kroes RA, Panksepp J, Burgdorf J, Otto NJ, Moskal JR. Modeling depression: social dominance-submission gene expression patterns in rat neocortex. Neuroscience. 2006;137:37–49. doi: 10.1016/j.neuroscience.2005.08.076. [DOI] [PubMed] [Google Scholar]
- Lamprecht R, Farb CR, LeDoux JE. Fear Memory Formation Involves p190 RhoGAP and ROCK Proteins through a GRB2-Mediated Complex. Neuron. 2002;36:727–738. doi: 10.1016/s0896-6273(02)01047-4. [DOI] [PubMed] [Google Scholar]
- Lazarus M, Huang ZL, Lu J, Urade Y, Chen JF. How do the basal ganglia regulate sleep-wake behavior? Trends Neurosci. 2012;35:723–732. doi: 10.1016/j.tins.2012.07.001. [DOI] [PubMed] [Google Scholar]
- Lein ES, Hawrylycz MJ, Ao N, Ayres M, Bensinger A, Bernard A, Boe AF, Boguski MS, Brockway KS, Byrnes EJ, et al. Genome-wide atlas of gene expression in the adult mouse brain. Nature. 2007;445:168–176. doi: 10.1038/nature05453. [DOI] [PubMed] [Google Scholar]
- Li R, Lyons MA, Wittenburg H, Paigen B, Churchill GA. Combining Data From Multiple Inbred Line Crosses Improves the Power and Resolution of Quantitative Trait Loci Mapping. Genetics. 2005;169:1699–1709. doi: 10.1534/genetics.104.033993. [DOI] [PMC free article] [PubMed] [Google Scholar]
- Li Y, Grupe A, Rowland C, Holmans P, Segurado R, Abraham R, Jones L, Catanese J, Ross D, Mayo K, et al. Evidence that common variation in NEDD9 is associated with susceptibility to late-onset Alzheimer’s and Parkinson’s disease. Hum Mol Genet. 2008;17:759–767. doi: 10.1093/hmg/ddm348. [DOI] [PubMed] [Google Scholar]
- Liang C, Feng P, Ku B, Dotan I, Canaani D, Oh BH, Jung JU. Autophagic and tumour suppressor activity of a novel Beclin1-binding protein UVRAG. Nat Cell Biol. 2006;8:688–698. doi: 10.1038/ncb1426. [DOI] [PubMed] [Google Scholar]
- Lim DA, Huang YC, Swigut T, Mirick AL, Garcia-Verdugo JM, Wysocka J, Ernst P, Alvarez-Buylla A. Chromatin remodelling factor Mll1 is essential for neurogenesis from postnatal neural stem cells. Nature. 2009;458:529–533. doi: 10.1038/nature07726. [DOI] [PMC free article] [PubMed] [Google Scholar]
- Lupien SJ, McEwen BS, Gunnar MR, Heim C. Effects of stress throughout the lifespan on the brain, behaviour and cognition. Nat Rev Neurosci. 2009;10:434–445. doi: 10.1038/nrn2639. [DOI] [PubMed] [Google Scholar]
- Lüscher C, Slesinger PA. Emerging roles for G protein-gated inwardly rectifying potassium (GIRK) channels in health and disease. Nat Rev Neurosci. 2010;11:301–315. doi: 10.1038/nrn2834. [DOI] [PMC free article] [PubMed] [Google Scholar]
- Manji H, Kato T, Di Prospero NA, Ness S, Beal MF, Krams M, Chen G. Impaired mitochondrial function in psychiatric disorders. Nat Rev Neurosci. 2012;13:293–307. doi: 10.1038/nrn3229. [DOI] [PubMed] [Google Scholar]
- Martinez-Gonzalez D, Obermeyer W, Fahy J, Riboh M, Kalin N, Benca R. REM sleep deprivation induces changes in coping responses that are not reversed by amphetamine. Sleep. 2004;27:609–617. [PubMed] [Google Scholar]
- McLachlan SM, Hamidi S, Aliesky H, Williams RW, Rapoport B. Sex, genetics and the control of thyroxine and thyrotropin in mice. 101089/thy20140003. 2014;24:1080–1087. doi: 10.1089/thy.2014.0003. [DOI] [PMC free article] [PubMed] [Google Scholar]
- Menz MM, Rihm JS, Salari N, Born J, Kalisch R, Pape HC, Marshall L, Büchel C. The role of sleep and sleep deprivation in consolidating fear memories. NeuroImage. 2013;75:87–96. doi: 10.1016/j.neuroimage.2013.03.001. [DOI] [PubMed] [Google Scholar]
- Millstein J, Winrow C, Kasarskis A, Owens J, Zhou L, Summa K, Fitzpatrick K, Zhang B, Vitaterna M, Schadt E, et al. Identification of causal genes, networks, and transcriptional regulators of REM sleep and wake. Sleep. 2011;34:1469–1477. doi: 10.5665/sleep.1378. [DOI] [PMC free article] [PubMed] [Google Scholar]
- Millstein J, Zhang B, Zhu J, Schadt E. Disentangling molecular relationships with a causal inference test. BMC Genetics. 2009;10:23. doi: 10.1186/1471-2156-10-23. [DOI] [PMC free article] [PubMed] [Google Scholar]
- Minkel J, Banks S, Htaik O, Moreta M, Jones C, McGlinchey E, Simpson N, Dinges D. Sleep deprivation and stressors: evidence for elevated negative affect in response to mild stressors when sleep deprived. Emotion. 2012;12:1015–1020. doi: 10.1037/a0026871. [DOI] [PMC free article] [PubMed] [Google Scholar]
- Morgan AD, Carroll ME, Loth AK, Stoffel M, Wickman K. Decreased cocaine self-administration in Kir3 potassium channel subunit knockout mice. Neuropsychopharmacology. 2003;28:932–938. doi: 10.1038/sj.npp.1300100. [DOI] [PubMed] [Google Scholar]
- Morton AJ. Circadian and sleep disorder in Huntington’s disease. Exp Neurol. 2013;243:34–44. doi: 10.1016/j.expneurol.2012.10.014. [DOI] [PubMed] [Google Scholar]
- Moy SS, Nadler JJ, Young NB, Nonneman RJ, Grossman AW, Murphy DL, D’Ercole AJ, Crawley JN, Magnuson TR, Lauder JM. Social approach in genetically engineered mouse lines relevant to autism. Genes Brain Behav. 2009;8:129–142. doi: 10.1111/j.1601-183X.2008.00452.x. [DOI] [PMC free article] [PubMed] [Google Scholar]
- Mychasiuk R, Gibb R, Kolb B. Prenatal stress produces sexually dimorphic and regionally specific changes in gene expression in hippocampus and frontal cortex of developing rat offspring. Dev Neurosci. 2011;33:531–538. doi: 10.1159/000335524. [DOI] [PubMed] [Google Scholar]
- O’Hara B, Ding J, Bernat R, Franken P. Genomic and proteomic approaches towards an understanding of sleep. CNS Neurol Disord Drug Targets. 2007;6:71–81. doi: 10.2174/187152707779940745. [DOI] [PubMed] [Google Scholar]
- Oldham MC, Konopka G, Iwamoto K, Langfelder P, Kato T, Horvath S, Geschwind DH. Functional organization of the transcriptome in human brain. Nat Neurosci. 2008;11:1271–1282. doi: 10.1038/nn.2207. [DOI] [PMC free article] [PubMed] [Google Scholar]
- Parikshak NN, Luo R, Zhang A, Won H, Lowe JK, Chandran V, Horvath S, Geschwind DH. Integrative functional genomic analyses implicate specific molecular pathways and circuits in autism. Cell. 2013;155:1008–1021. doi: 10.1016/j.cell.2013.10.031. [DOI] [PMC free article] [PubMed] [Google Scholar]
- Polta SA, Fenzl T, Jakubcakova V, Kimura M, Yassouridis A, Wotjak CT. Prognostic and symptomatic aspects of rapid eye movement sleep in a mouse model of posttraumatic stress disorder. Frontiers in Behavioral Neuroscience. 2013;7 doi: 10.3389/fnbeh.2013.00060. [DOI] [PMC free article] [PubMed] [Google Scholar]
- Ponder C, Huded C, Munoz M, Gulden F, Gilliam TC, Palmer A. Rapid Selection Response for Contextual Fear Conditioning in a Cross Between C57BL/6J and A/J: Behavioral, QTL and Gene Expression Analysis. Behavior Genetics. 2008;38:277–291. doi: 10.1007/s10519-008-9203-6. [DOI] [PMC free article] [PubMed] [Google Scholar]
- Postuma RB, Aarsland D, Barone P, Burn DJ, Hawkes CH, Oertel W, Ziemssen T. Identifying prodromal Parkinson’s disease: pre-motor disorders in Parkinson’s disease. Mov Disord. 2012;27:617–626. doi: 10.1002/mds.24996. [DOI] [PubMed] [Google Scholar]
- Pravetoni M, Wickman K. Behavioral characterization of mice lacking GIRK/Kir3 channel subunits. Genes Brain Behav. 2008;7:523–531. doi: 10.1111/j.1601-183X.2008.00388.x. [DOI] [PubMed] [Google Scholar]
- Qiu MH, Vetrivelan R, Fuller PM, Lu J. Basal ganglia control of sleep-wake behavior and cortical activation. Eur J Neurosci. 2010;31:499–507. doi: 10.1111/j.1460-9568.2009.07062.x. [DOI] [PMC free article] [PubMed] [Google Scholar]
- Rossi S, Chiara V, Musella A, Mataluni G, Sacchetti L, Bernardi G, Usiello A, Centonze D. Adaptations of Striatal Endocannabinoid System During Stress. Mol Neurobiol. 2009;39:178–184. doi: 10.1007/s12035-009-8061-4. [DOI] [PubMed] [Google Scholar]
- Sauerbier A, Ray Chaudhuri K. Non-motor symptoms: the core of multi-morbid Parkinson’s disease. Br J Hosp Med (Lond) 2014;75:18–24. doi: 10.12968/hmed.2014.75.1.18. [DOI] [PubMed] [Google Scholar]
- Schadt EE, Lamb J, Yang X, Zhu J, Edwards S, GuhaThakurta D, Sieberts SK, Monks S, Reitman M, Zhang C, et al. An integrative genomics approach to infer causal associations between gene expression and disease. Nat Genet. 2005;37:710–717. doi: 10.1038/ng1589. [DOI] [PMC free article] [PubMed] [Google Scholar]
- Schwartz M, Kipnis J. A conceptual revolution in the relationships between the brain and immunity. Brain Behav Immun. 2011;25:817–819. doi: 10.1016/j.bbi.2010.12.015. [DOI] [PMC free article] [PubMed] [Google Scholar]
- Shepherd GM. Corticostriatal connectivity and its role in disease. Nat Rev Neurosci. 2013;14:278–291. doi: 10.1038/nrn3469. [DOI] [PMC free article] [PubMed] [Google Scholar]
- Shirbin CA, Chua P, Churchyard A, Lowndes G, Hannan AJ, Pang TY, Chiu E, Stout JC. Cortisol and depression in pre-diagnosed and early stage Huntington’s disease. Psychoneuroendocrinology. 2013;38:2439–2447. doi: 10.1016/j.psyneuen.2012.10.020. [DOI] [PubMed] [Google Scholar]
- Smith SM, Uslaner JM, Cox CD, Huszar SL, Cannon CE, Vardigan JD, Eddins D, Toolan DM, Kandebo M, Yao L, et al. The novel phosphodiesterase 10A inhibitor THPP-1 has antipsychotic-like effects in rat and improves cognition in rat and rhesus monkey. Neuropharmacology. 2013;64:215–223. doi: 10.1016/j.neuropharm.2012.06.013. [DOI] [PubMed] [Google Scholar]
- Stengel A, Rivier J, Taché Y. Modulation of the adaptive response to stress by brain activation of selective somatostatin receptor subtypes. Peptides. 2013;42:70–77. doi: 10.1016/j.peptides.2012.12.022. [DOI] [PMC free article] [PubMed] [Google Scholar]
- Stoffers D, Altena E, van der Werf YD, Sanz-Arigita EJ, Voorn TA, Astill RG, Strijers RLM, Waterman D, Van Someren EJW. The caudate: a key node in the neuronal network imbalance of insomnia? Brain. 2013 doi: 10.1093/brain/awt329. [DOI] [PMC free article] [PubMed] [Google Scholar]
- Suchecki D, Tiba PA, Machado RB. REM Sleep Rebound as an Adaptive Response to Stressful Situations. Front Neurol. 2012;3:41. doi: 10.3389/fneur.2012.00041. [DOI] [PMC free article] [PubMed] [Google Scholar]
- Sun T, Qiao H, Pan PY, Chen Y, Sheng ZH. Motile axonal mitochondria contribute to the variability of presynaptic strength. Cell Reports. 2013;4:413–419. doi: 10.1016/j.celrep.2013.06.040. [DOI] [PMC free article] [PubMed] [Google Scholar]
- Tissir F, Bar I, Jossin Y, De Backer O, Goffinet AM. Protocadherin Celsr3 is crucial in axonal tract development. Nat Neurosci. 2005;8:451–457. doi: 10.1038/nn1428. [DOI] [PubMed] [Google Scholar]
- Tochigi M, Iwamoto K, Bundo M, Sasaki T, Kato N, Kato T. Gene expression profiling of major depression and suicide in the prefrontal cortex of postmortem brains. Neurosci Res. 2008;60:184–191. doi: 10.1016/j.neures.2007.10.010. [DOI] [PubMed] [Google Scholar]
- Tordera RM, Totterdell S, Wojcik SM, Brose N, Elizalde N, Lasheras B, Del Rio J. Enhanced anxiety, depressive-like behaviour and impaired recognition memory in mice with reduced expression of the vesicular glutamate transporter 1 (VGLUT1) Eur J Neurosci. 2007;25:281–290. doi: 10.1111/j.1460-9568.2006.05259.x. [DOI] [PubMed] [Google Scholar]
- Tritsch NX, Sabatini BL. Dopaminergic modulation of synaptic transmission in cortex and striatum. Neuron. 2012;76:33–50. doi: 10.1016/j.neuron.2012.09.023. [DOI] [PMC free article] [PubMed] [Google Scholar]
- Turek FW. From circadian rhythms to clock genes in depression. International Clinical Psychopharmacology. 2007;22:S1–S8. doi: 10.1097/1001.yic.0000277956.0000293777.0000277956a. [DOI] [PubMed] [Google Scholar]
- van den Heuvel OA, van der Werf YD, Verhoef KM, de Wit S, Berendse HW, Wolters E, Veltman DJ, Groenewegen HJ. Frontal-striatal abnormalities underlying behaviours in the compulsive-impulsive spectrum. Journal of the neurological sciences. 2010;289:55–59. doi: 10.1016/j.jns.2009.08.043. [DOI] [PubMed] [Google Scholar]
- Varty GB, Grilli M, Forlani A, Fredduzzi S, Grzelak ME, Guthrie DH, Hodgson RA, Lu SX, Nicolussi E, Pond AJ, et al. The antinociceptive and anxiolytic-like effects of the metabotropic glutamate receptor 5 (mGluR5) antagonists, MPEP and MTEP, and the mGluR1 antagonist, LY456236, in rodents: a comparison of efficacy and side-effect profiles. Psychopharmacology (Berl) 2005;179:207–217. doi: 10.1007/s00213-005-2143-4. [DOI] [PubMed] [Google Scholar]
- Wang IM, Zhang B, Yang X, Zhu J, Stepaniants S, Zhang C, Meng Q, Peters M, He Y, Ni C, et al. Systems analysis of eleven rodent disease models reveals an inflammatome signature and key drivers. Mol Syst Biol. 2012;8:594. doi: 10.1038/msb.2012.24. [DOI] [PMC free article] [PubMed] [Google Scholar]
- Welter D, MacArthur J, Morales J, Burdett T, Hall P, Junkins H, Klemm A, Flicek P, Manolio T, Hindorff L, et al. The NHGRI GWAS Catalog, a curated resource of SNP-trait associations. Nucleic Acids Research. 2014;42:D1001–D1006. doi: 10.1093/nar/gkt1229. [DOI] [PMC free article] [PubMed] [Google Scholar]
- Yu H, Wang DD, Wang Y, Liu T, Lee FS, Chen ZY. Variant Brain-Derived Neurotrophic Factor Val66Met Polymorphism Alters Vulnerability to Stress and Response to Antidepressants. The Journal of Neuroscience. 2012;32:4092–4101. doi: 10.1523/JNEUROSCI.5048-11.2012. [DOI] [PMC free article] [PubMed] [Google Scholar]
- Zhang B, Gaiteri C, Bodea L-G, Wang Z, McElwee J, Podtelezhnikov Alexei A, Zhang C, Xie T, Tran L, Dobrin R, et al. Integrated Systems Approach Identifies Genetic Nodes and Networks in Late-Onset Alzheimer s Disease. Cell. 2013;153:707–720. doi: 10.1016/j.cell.2013.03.030. [DOI] [PMC free article] [PubMed] [Google Scholar]
- Zhang B, Horvath S. A general framework for weighted gene co-expression network analysis. Stat Appl Genet Mol Biol. 2005;4 doi: 10.2202/1544-6115.1128. Article17. [DOI] [PubMed] [Google Scholar]
- Zhang S, Gershenfeld HK. Genetic Contributions to Body Weight in Mice: Relationship of Exploratory Behavior to Weight. Obesity Research. 2003;11:828–838. doi: 10.1038/oby.2003.114. [DOI] [PubMed] [Google Scholar]
- Zhao Z, Oh S, Li D, Ni D, Pirooz Sara D, Lee JH, Yang S, Lee JY, Ghozalli I, Costanzo V, et al. A Dual Role for UVRAG in Maintaining Chromosomal Stability Independent of Autophagy. Developmental Cell. 2012;22:1001–1016. doi: 10.1016/j.devcel.2011.12.027. [DOI] [PMC free article] [PubMed] [Google Scholar]
- Zhou Y, Gunput RAF, Adolfs Y, Pasterkamp RJ. MICALs in control of the cytoskeleton, exocytosis, and cell death. Cell Mol Life Sci. 2011;68:4033–4044. doi: 10.1007/s00018-011-0787-2. [DOI] [PMC free article] [PubMed] [Google Scholar]
- Zhu J, Sova P, Xu Q, Dombek KM, Xu EY, Vu H, Tu Z, Brem RB, Bumgarner RE, Schadt EE. Stitching together Multiple Data Dimensions Reveals Interacting Metabolomic and Transcriptomic Networks That Modulate Cell Regulation. PLoS Biol. 2012;10:e1001301. doi: 10.1371/journal.pbio.1001301. [DOI] [PMC free article] [PubMed] [Google Scholar]
Associated Data
This section collects any data citations, data availability statements, or supplementary materials included in this article.