Abstract
In bacterial transcription initiation, RNA polymerase (RNAP) selects a transcription start site (TSS) at variable distances downstream of core promoter elements. Using next-generation sequencing and unnatural-amino-acid-mediated protein-DNA crosslinking, we have determined, for a library of 410 promoter sequences, the TSS, the RNAP leading-edge position, and the RNAP trailing-edge position. We find that a promoter element upstream of the TSS, the “discriminator,” participates in TSS selection, and that, as the TSS changes, the RNAP leading-edge position changes, but the RNAP trailing-edge position does not change. Changes in the RNAP leading-edge position but not the RNAP trailing-edge position are a defining hallmark of the “DNA scrunching” that occurs concurrent with RNA synthesis in initial transcription. We propose that TSS selection involves DNA scrunching prior to RNA synthesis.
During bacterial transcription initiation, RNA polymerase (RNAP) holoenzyme binds to promoter DNA through sequence-specific interactions with core promoter elements, unwinds a turn of promoter DNA to form an RNAP-promoter open complex (RPo) with an unwound “transcription bubble,” selects a transcription start site (TSS), and aligns the TSS template-strand nucleotide with the RNAP active center (1). There is variability in the position of the TSS relative to core promoter elements (2–6). The mechanistic basis for this variability has remained unclear. In addition, although DNA-sequence determinants for TSS selection within the TSS region have been defined (2), it has remained unclear whether there also are DNA-sequence determinants for TSS selection outside the TSS region.
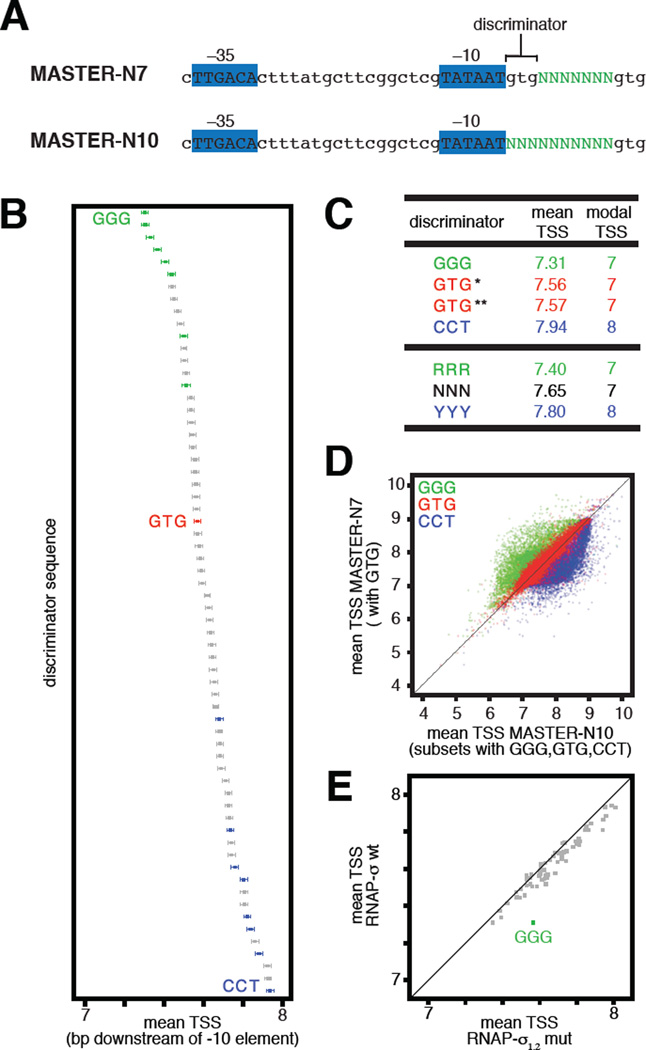
To investigate whether there are sequence determinants for TSS selection outside the TSS region, we applied a next-generation-sequencing approach that enables comprehensive analysis of sequence determinants during transcription: “massively systematic transcript end readout” (MASTER; 2). MASTER entails generating transcripts from a library of bar-coded randomized sequences and sequencing transcript ends (Fig. S1; 2). In previous work, we defined TSS-region sequence determinants for TSS selection using a library containing all 47 (~16,000) sequences at positions 4–10 bp downstream of the -10 element of a consensus bacterial promoter (MASTER-N7; Figs. 1A, S1; 2). Here, to define effects on TSS selection of sequences outside the TSS region, we analyzed a template library containing all 410 (~1,000,000) sequences at positions 1–10 bp downstream of the -10 element, extending the randomized sequence to include the “discriminator” (7–10), located between the TSS region and the -10 element (MASTER-N10; Figs. 1A, S1). Results of MASTER-N10 analysis reveal that the discriminator affects TSS selection (Figs. 1B–D, S2–S4, Table S1). Changes in the discriminator change TSS selection by up to ~3 bp (Figs. 1D, S4) and change the mean TSS, averaged over the ~16,000 templates analyzed for each of the 64 discriminator sequences, by ~1 bp (Fig. 1B). Discriminators having a purine at each position (RRR), particularly GGG, favor TSS selection at upstream-shifted positions, whereas discriminators having a pyrimidine at each position (YYY), particularly CCT, favor TSS selection at downstream-shifted positions (modal TSS for RRR, 7 bp downstream of -10 element; modal TSS for YYY, 8 bp downstream of -10 element; Figs. 1B–C, S2B). Results from MASTER-N10 where the discriminator is GTG match results from MASTER-N7 where the discriminator is GTG, demonstrating the reproducibility of the approach (Figs. 1C–D, S2B). We conclude that the discriminator is a determinant of TSS selection.
Fig. 1. Sequences upstream of TSS region affect TSS selection.
(A) Promoter sequences analyzed in MASTER-N7 (2) and MASTER-N10. Promoter -35, -10, and discriminator elements are indicated. Green, randomized nucleotides.
(B) Effect of discriminator on position of TSS (numbered in bp downstream of -10 element). Data show means and 99.9% confidence intervals for each of the 64 discriminator sequences (~16,000 templates analyzed for each discriminator). Green, GGG and other RRR discriminators; blue, CCT and other YYY discriminators; red, GTG discriminator.
(C) Mean and modal TSS. *, GTG data from MASTER-N7; **, GTG data from MASTER-N10.
(D) Upstream and downstream shifts in TSS selection with the ~16,000 GGG and ~16,000 CCT discriminators (green and blue, respectively) relative to the ~16,000 GTG discriminators (red).
(E) Effect of σ1.2-discriminator interactions on TSS selection (downstream shift in mean TSS for ~16,000 GGG-discriminator templates on replacement of σ by σ1.2 mutant).
A conserved region of transcription initiation factor σ, “σ region 1.2” (σ1.2), makes sequence-specific protein-DNA interactions with the nontemplate-strand of the discriminator in the transcription bubble in RPO (7–8). These interactions confer specificity for GGG (7–9). To determine whether sequence-specific σ1.2-discriminator interactions affect TSS selection, we used MASTER-N10 to compare wild-type σ to a σ derivative having alanine substitutions that disrupt sequence-specific discriminator-σ1.2 interactions: σ1.2-mut (7,11). The results show that disrupting σ1.2-discriminator interactions markedly alters TSS selection for templates containing a GGG discriminator, resulting in a downstream shift in mean TSS (Fig. 1E). We conclude that σ1.2-discriminator interactions are a determinant of TSS selection.
The results in Figs. 1 and S2-S4 show that TSS selection can occur at any of five positions downstream of the -10 element--i.e., positions 6–10, with position 7 generally being preferred--and that discriminator sequence affects TSS selection. These results imply that RPo can accommodate ~17 Å (5 bp × 3.4 Å/bp) variation in the position of the TSS, and that discriminator sequence affects the ability to accommodate this variation. It has been hypothesized that TSS selection at positions downstream of the modal TSS (generally position 7; Figs. 1C, S2A) involves transcription-bubble expansion (“scrunching”; Fig. S5), and TSS selection at positions upstream of the modal TSS involves transcription-bubble contraction (“anti-scrunching”; Fig. S5; 2, 12). According to this hypothesis, RPo generally contains a 13 bp transcription bubble that places position 7 in the RNAP active-center initiating NTP site (“i site”) and position 8 in the RNAP active-center NTP addition site (“i+1 site”; Fig. S5, TSS = 7). In order for TSS selection to occur at positions 8, 9, or 10, it is hypothesized that the downstream DNA duplex is unwound by 1, 2, or 3 bp; the unwound DNA is pulled into and past the RNAP active center, and the unwound DNA is accommodated as bulges within the transcription bubble, yielding a scrunched complex (Fig. S5, TSS = 8, 9, or 10). In order for TSS selection to occur at position 6, it is hypothesized that the opposite occurs: downstream DNA is rewound by one bp, downstream DNA is extruded from the RNAP active center, and the extrusion of DNA is accommodated by stretching DNA within the transcription bubble, yielding an anti-scrunched complex (Fig. S5, TSS = 6). Two lines of evidence support this hypothesis: single-molecule FRET results suggest transcription-bubble size in RPo can vary (12); and negative supercoiling, which provides a driving force for transcription-bubble expansion, favors TSS selection at downstream positions (2). However, direct evidence for this hypothesis has not been reported.
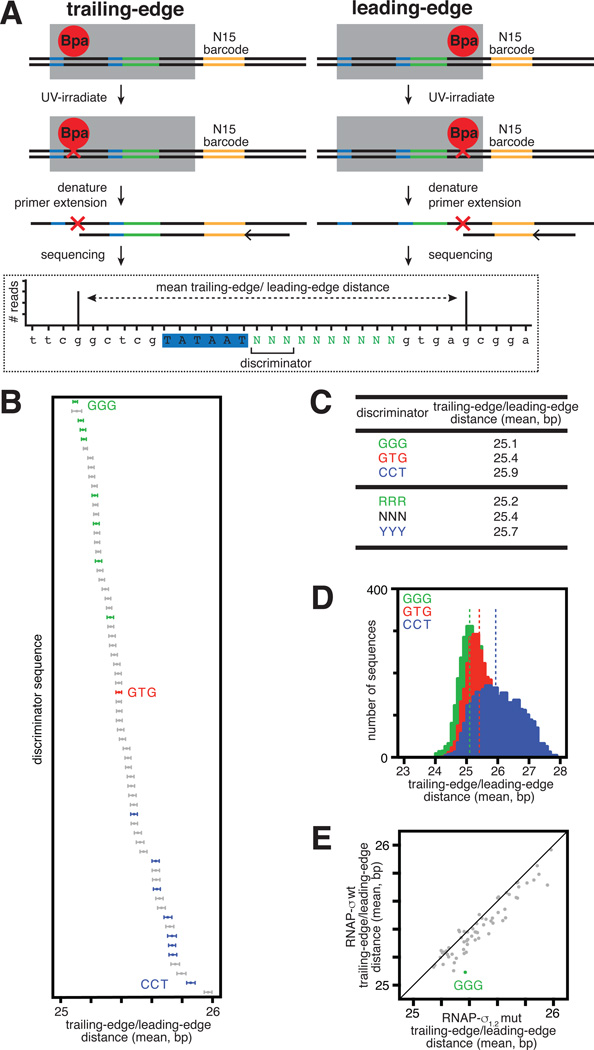
Transcription-bubble expansion (scrunching) occurs in initial transcription, where it is coupled to RNA synthesis (13–15; Fig. S5). A hallmark of scrunching during initial transcription is that the RNAP trailing edge remains stationary relative to DNA while the RNAP leading edge moves relative to DNA (13–15; Fig. S5). Here, we investigated whether this hallmark of scrunching is a feature of TSS selection. We used unnatural-amino-acid-mediated protein-DNA photocrosslinking to define the RNAP trailing-edge position and RNAP leading-edge position in RPo on a MASTER-N10 library (MASTER-N10-XL, Figs. 2A, S6). To perform MASTER-N10-XL, we incorporated the photoactivatible unnatural amino acid p-benzoyl-L-phenylalanine (Bpa; Fig. S6; 15–16) at specific sites at the RNAP trailing edge and RNAP leading edge, we formed RPO between the Bpa-containing RNAP derivatives and the MASTER-N10 library, and we UV-irradiated complexes to induce crosslinking between Bpa and adjacent DNA nucleotides (Figs. 2A, S6). We then mapped positions of crosslinks on each of the 410 sequences by primer extension and high-throughput sequencing (Fig. 2A). The method defines the mean RNAP trailing-edge position, the mean RNAP leading-edge position, and the mean distance between them (RNAP trailing-edge/leading-edge distance; Fig. 2, Table S2).
Fig. 2. Sequences upstream of TSS region affect RNAP trailing-edge/leading-edge distance.
(A) MASTER-N10-XL.
(B) Effect of discriminator on RNAP trailing-edge/leading-edge distance in RPo (symbols as in Fig. 1).
(C) RNAP trailing-edge/leading-edge distances.
(D) Decreases and increases in RNAP trailing-edge/leading-edge distance with the ~16,000 GGG- and ~16,000 CCT-discriminator templates (green and blue, respectively) relative to the ~16,000 GTG-discriminator templates (red). Dashed lines indicate mean trailing-edge/leading-edge distances.
(E) Effect of σ1.2-discriminator interactions on RNAP trailing-edge/leading-edge distance (increase in RNAP trailing-edge/leading-edge distance for ~16,000 GGG-discriminator templates on replacement of σ by σ1.2 mutant).
The results show that changes in the discriminator change the RNAP trailing-edge/leading-edge distance in the same manner that changes in the discriminator change TSS selection (Figs. 1–2, S7). Changes in the discriminator change the RNAP trailing-edge/leading-edge distance by up to ~3 bp (Fig. S8) and change the RNAP trailing-edge/leading-edge distance, averaged over the ~16,000 templates analyzed for each of the 64 discriminator sequences, by ~1 bp (Figs. 2B, S7). The RNAP trailing-edge/leading-edge distance is shortest for RRR, especially GGG, discriminators and longest for YYY, especially CCT, discriminators (Fig. 2B–D). Disruption of σ1.2-discriminator interactions results in a marked increase in RNAP trailing-edge/leading-edge distance for templates containing a GGG discriminator (Fig. 2E).
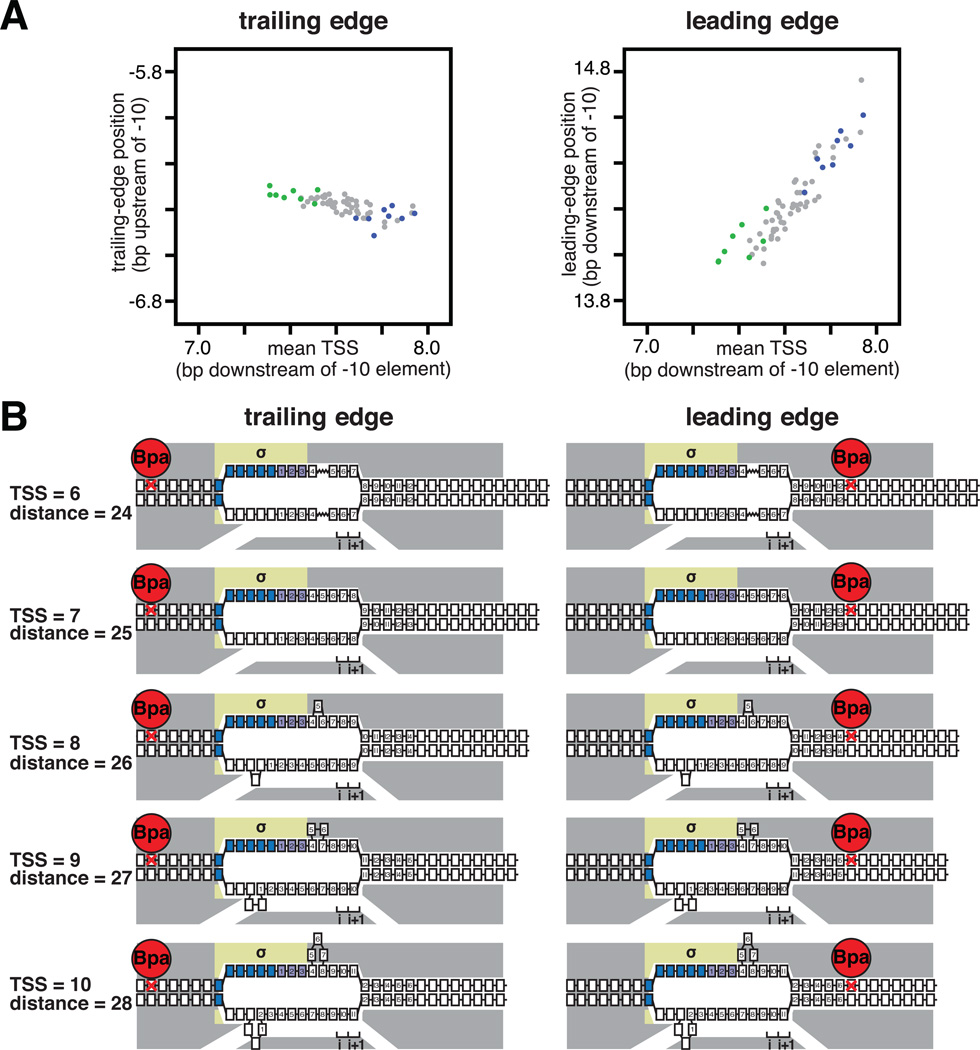
We next compared effects of discriminator sequence on TSS selection (Fig. 1) to effects of discriminator sequence on RNAP trailing-edge position and RNAP leading-edge position (Figs. 2–3, S9). The results show that, as the position of the TSS changes by 1 bp, the RNAP leading-edge position changes by 1 bp (Figs. 3A, S9, right), but the RNAP trailing-edge position does not change (Figs. 3A, S9, left). Thus, TSS selection exhibits a defining hallmark of scrunching: namely, the RNAP leading edge moves, while the RNAP trailing edge does not move (Fig. 3B). The results provide support for the hypothesis that flexibility in TSS selection is mediated by scrunching/anti-scrunching, and that the discriminator affects TSS selection by modulating the extent of scrunching/anti-scrunching.
Fig. 3. As TSS changes, RNAP leading-edge position changes, but RNAP trailing-edge position does not change.
(A) RNAP trailing-edge position (left; slope ~0) and RNAP leading-edge position (right; slope ~1) as a function of mean TSS for each of the 64 discriminator sequences (~16,000 templates analyzed for each discriminator).
(B) Interpretation: changes in TSS selection result from changes in DNA scrunching. Gray, RNAP; yellow, σ; blue, -10 element nucleotides; purple, discriminator nucleotides; i and i+1, NTP binding sites; red, Bpa and nucleotide crosslinked to Bpa; boxes, DNA nucleotides (nontemplate-strand nucleotides above template-strand nucleotides; nucleotides downstream of -10 element numbered). Scrunching is indicated by bulged-out nucleotides. Anti-scrunching is indicated by a “stretched” nucleotide-nucleotide linkage.
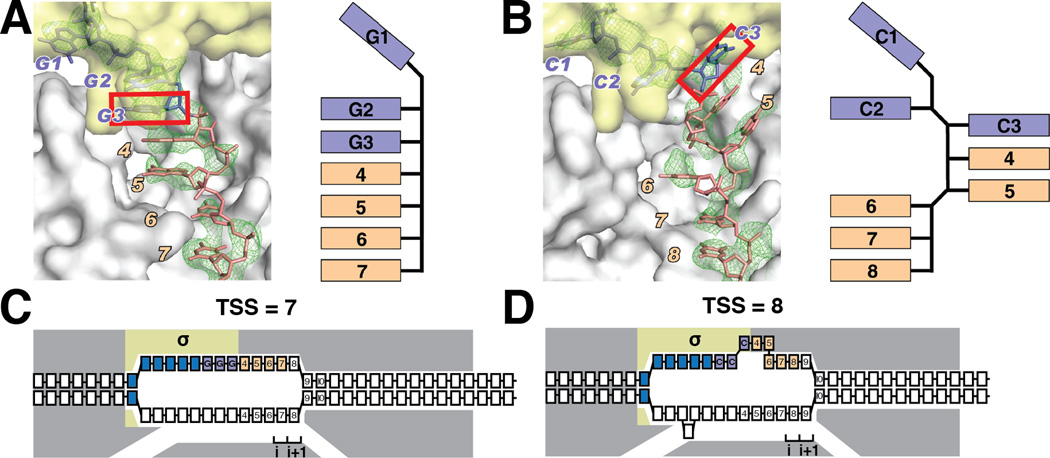
To define the path of the DNA nontemplate-strand in RPO having an RRR discriminator and a nontemplate-strand length corresponding to its modal TSS at position 7, and to define the path of the DNA nontemplate-strand in RPO having a YYY discriminator and a nontemplate-strand length corresponding to its modal TSS at position 8, we determined crystal structures of representative initiation complexes of each: RPO-GGG-7 and RPO-CCC-8 (Figs. 4, S10–11; Table S3). For RPo-GGG-7, the first nucleotide of the discriminator is unstacked and inserted into a pocket in σ1.2, and the next six nucleotides of the nontemplate-strand form a continuous stack (Fig. 4A, S10) (8). In contrast, for RPo-CCC-8, the third nucleotide of the discriminator occupies a different position, being unstacked, rotated by ~180°, and inserted into a pocket in σ region 2 (σ2; Figs. 4B, S10–S11). As a result of the difference in the position of the third nucleotide of the discriminator, the distance between the third nucleotide of the discriminator and the downstream duplex is ~4–5 Å greater in RPo-CCC-8 than in RPo-GGG-7, and the DNA segment between the third nucleotide of the discriminator and the downstream duplex accommodates an additional nucleotide (Figs. 4B, S10). Two factors account for the difference in the position of the third nucleotide of the discriminator in the RPO-CCC-8: (i) weak stacking between YY, as compared to RR, at the second and third nucleotides of the discriminator (Figs. 4B, S10); and (ii) the ability of Y at the third nucleotide of the discriminator to fit in a pocket in σ2 that has size and hydrogen-bonding character specific for Y (Figs. 4B, S11).
Fig. 4. Crystal structures define paths of DNA nontemplate-strands with representative RRR and YYY discriminators.
(A) Crystal structure of an initiation complex with RRR discriminator and nontemplate-strand length corresponding to TSS at position 7 (RPo-GGG-7). Left, simulated annealing |Fo-Fc| omit map contoured at 2.3σ and atomic model for interactions of RNAP with DNA nontemplate-strand. Right, schematic path of DNA. Gray, RNAP; yellow, σ; purple, discriminator nucleotides; pink, nontemplate-strand nucleotides downstream of discriminator; green, simulated annealing |Fo-Fc| omit map contoured at 2.3σ. Red box, third nucleotide of discriminator.
(B) Crystal structure of an initiation complex with YYY discriminator and nontemplate-strand length corresponding to TSS at position 8 (RPo-CCC-8; symbols as in A).
(C–D) Interpretation: The different position of the third nucleotide of the discriminator in the structure with a YYY discriminator increases the distance between the third nucleotide of the discriminator and downstream duplex DNA, accommodating an additional nucleotide in the connector.
Our results indicate that flexibility in TSS selection occurs through changes in scrunching/anti-scrunching in RPo. We propose that RPo uses thermally driven DNA fluctuations to access an ensemble of transcription-bubble sizes (Figs. 3, S5). Transcription-bubble expansion (scrunching) places downstream DNA in contact with the RNAP active center, facilitating downstream TSS selection, and transcription-bubble contraction (anti-scrunching), places upstream DNA in contact with the RNAP active center, facilitating upstream TSS selection. According to this model, the discriminator alters TSSs selection by altering the energy landscape describing the ensemble of transcription-bubble sizes in RPo (Fig. 4). The scrunching that occurs in TSS selection is mechanistically analogous to the scrunching that occurs during initial transcription (13–15; Fig. S5). However, scrunching in TSS selection occurs before NTP binding and nucleotide incorporation and, in the absence of an additional energy source, is driven by energy available from the thermal bath and therefore limited to ~1–3 bp--rather than occurring after NTP binding and nucleotide incorporation, being driven by a combination of thermal energy, NTP binding, and nucleotide incorporation, and being able to span tens of bp. We suggest that, in the presence of an additional energy source, scrunching in TSS selection could access a larger range of TSS positions, and, in particular, we speculate that this occurs with TFIIH-dependent ATP hydrolysis as the additional energy source in the long-range “TSS scanning” observed with eukaryotic RNAPII in some species (17).
Supplementary Material
Acknowledgments
Work was supported by NIH grants GM37048 (RLG), GM041376 (RHE), GM088343 (BEN) and GM115910 (BEN). PDB accession codes are 5E17 and 5E18.
Footnotes
List of Supplementary Materials
Materials and Methods
Figs. S1–S11
Tables S1–S4
References (18–23)
References
- 1.Ruff EF, Record MT, Artsimovitch I. Initial events in bacterial transcription initiation. Biomolecules. 2015;5:1035–1062. doi: 10.3390/biom5021035. [DOI] [PMC free article] [PubMed] [Google Scholar]
- 2.Vvedenskaya IO, et al. Massively systematic transcript readout (MASTER) Mol. Cell. 2015;60:953–965. doi: 10.1016/j.molcel.2015.10.029. [DOI] [PMC free article] [PubMed] [Google Scholar]
- 3.Jeong W, Kang C. Start site selection at lacUV5 promoter affected by the sequence context around the initiation sites. Nucleic Acids Res. 1994;22:4667–4672. doi: 10.1093/nar/22.22.4667. [DOI] [PMC free article] [PubMed] [Google Scholar]
- 4.Liu J, Turnbough CL. Effects of transcriptional start site sequence and position on nucleotide-sensitive selection of alternative start sites at the pyrC promoter in Escherichia coli. J Bacteriol. 1994;176:2938–2945. doi: 10.1128/jb.176.10.2938-2945.1994. [DOI] [PMC free article] [PubMed] [Google Scholar]
- 5.Walker KA, Osuna R. Factors affecting start site selection at the Escherichia coli fis promoter. J. Bacteriol. 2002;184:4783–4791. doi: 10.1128/JB.184.17.4783-4791.2002. [DOI] [PMC free article] [PubMed] [Google Scholar]
- 6.Lewis DE, Adhya S. Axiom of determining transcription start points by RNA polymerase in Escherichia coli. Mol. Micro. 2004;54:692–701. doi: 10.1111/j.1365-2958.2004.04318.x. [DOI] [PubMed] [Google Scholar]
- 7.Haugen SP, et al. rRNA promoter regulation by nonoptimal binding of sigma region 1.2. Cell. 2006;125:1069–1082. doi: 10.1016/j.cell.2006.04.034. [DOI] [PubMed] [Google Scholar]
- 8.Zhang Y, et al. Structural basis of transcription initiation. Science. 2012;338:1076–1080. doi: 10.1126/science.1227786. [DOI] [PMC free article] [PubMed] [Google Scholar]
- 9.Feklistov A, et al. A basal promoter element recognized by free RNA polymerase sigma subunit determines promoter recognition by RNA polymerase holoenzyme. Mol. Cell. 2006;23:97–107. doi: 10.1016/j.molcel.2006.06.010. [DOI] [PubMed] [Google Scholar]
- 10.Travers AA. Promoter sequence for stringent control of bacterial ribonucleic acid synthesis. J Bacteriol. 1980;141:973–976. doi: 10.1128/jb.141.2.973-976.1980. [DOI] [PMC free article] [PubMed] [Google Scholar]
- 11.Haugen SP, Ross W, Manrique M, Gourse RL. Fine structure of the promoter-sigma region 1.2 interaction. Proc. Natl. Acad. Sci. USA. 2008;105:3292–3297. doi: 10.1073/pnas.0709513105. [DOI] [PMC free article] [PubMed] [Google Scholar]
- 12.Robb NC, et al. The transcription bubble of the RNA polymerase-promoter open complex exhibits conformational heterogeneity and millisecond-scale dynamics. J Mol. Biol. 2013;425:875–885. doi: 10.1016/j.jmb.2012.12.015. [DOI] [PMC free article] [PubMed] [Google Scholar]
- 13.Revyakin A, Liu C, Ebright RH, Strick TR. Abortive initiation and productive initiation by RNA polymerase involve DNA scrunching. Science. 2006;314:1139–1143. doi: 10.1126/science.1131398. [DOI] [PMC free article] [PubMed] [Google Scholar]
- 14.Kapanidis AN, et al. Initial transcription by RNA polymerase proceeds through a DNA-scrunching mechanism. Science. 2006;314:1144–1147. doi: 10.1126/science.1131399. [DOI] [PMC free article] [PubMed] [Google Scholar]
- 15.Winkelman JT, et al. Crosslink mapping at amino acid-base resolution reveals the path of scrunched DNA in initial transcribing complexes. Mol. Cell. 2015;59:768–780. doi: 10.1016/j.molcel.2015.06.037. [DOI] [PMC free article] [PubMed] [Google Scholar]
- 16.Chin JW, Martin AB, King DS, Wang L, Schultz PG. Addition of a photocrosslinking amino acid to the genetic code of Escherichia coli. Proc. Natl. Acad. Sci. USA. 2002;99:11020–11024. doi: 10.1073/pnas.172226299. [DOI] [PMC free article] [PubMed] [Google Scholar]
- 17.Fazal FM, Meng CA, Murakami K, Kornberg RD, Block SM. Real-time observation of the initiation of RNA polymerase II transcription. Nature. 2015;525:274–277. doi: 10.1038/nature14882. [DOI] [PMC free article] [PubMed] [Google Scholar]
Associated Data
This section collects any data citations, data availability statements, or supplementary materials included in this article.


