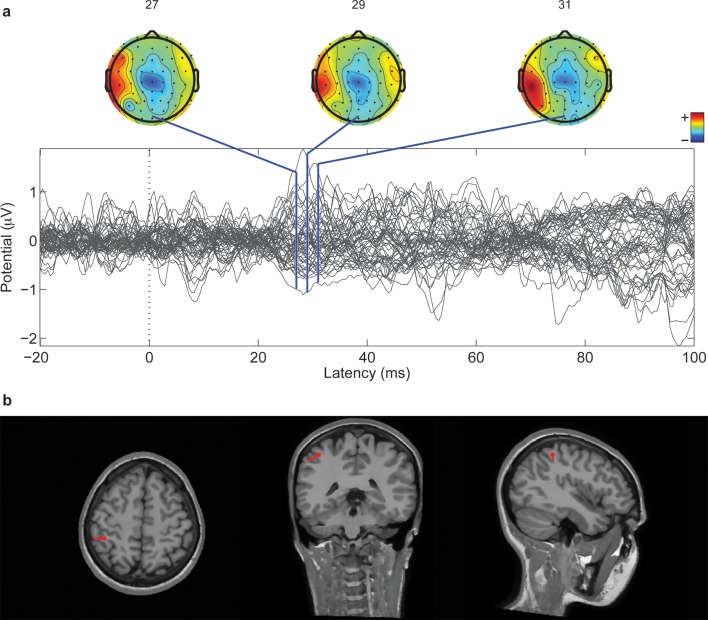
Figure 5. Cortical localization of a 1 Hz electrical microstimulation sensory evoked potential.
(a) Butterfly plot of SEPs for all 64 channels of one subject (M4). All traces are aligned to the electrical stimulus delivery. On top, the topographic representation of amplitude distribution at different time lags (ms). (b) Position of the associated equivalent dipole, which corresponds to P27 peak, superimposed on the individual horizontal, coronal and sagittal structural MRI planes of the subject.

