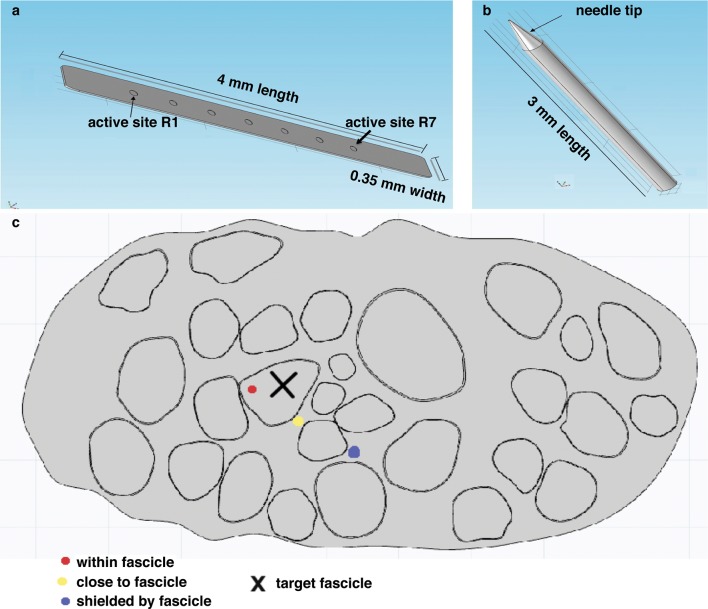
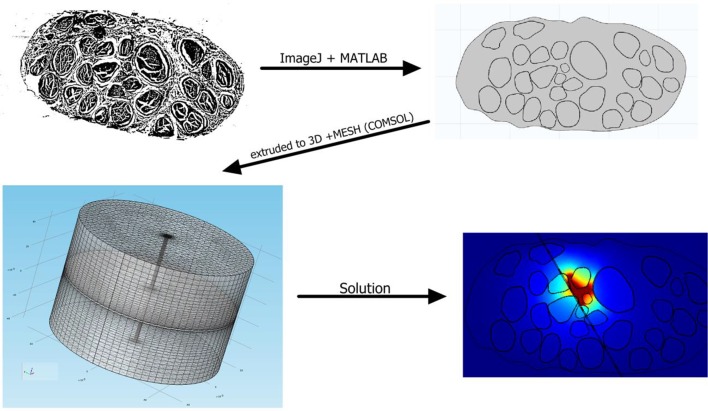
Figure 6. Representation of the physical design of electrodes for the hybrid model.
(a) Implementation for the TIME electrode. (b) Implementation for the microneedle. (c) Different locations for stimulating active site and tip, that were used in the model to compare the TIME interface versus the microstimulation needle. Red dot represents the evaluated intrafascicular positioning of the TIME active site and the end of microstimulation needle tip. Yellow dot represents close-to-fascicle location, where the end of microstimulation needle tip and the active site of TIME interface were placed. Blue dot represents an example position with a shielding fascicle. The X marker represents the targeted fascicle, where the fiber activation was calculated for different locations of microneedle and TIME for 9 different populations that emulated biologically inherent uncertainty in the placement and extension of fibers innervating a specific hand district. This procedure was performed analogously for medium and small fascicles and confirmed the results.


