. 2016 Feb 22;5:e11469. doi: 10.7554/eLife.11469

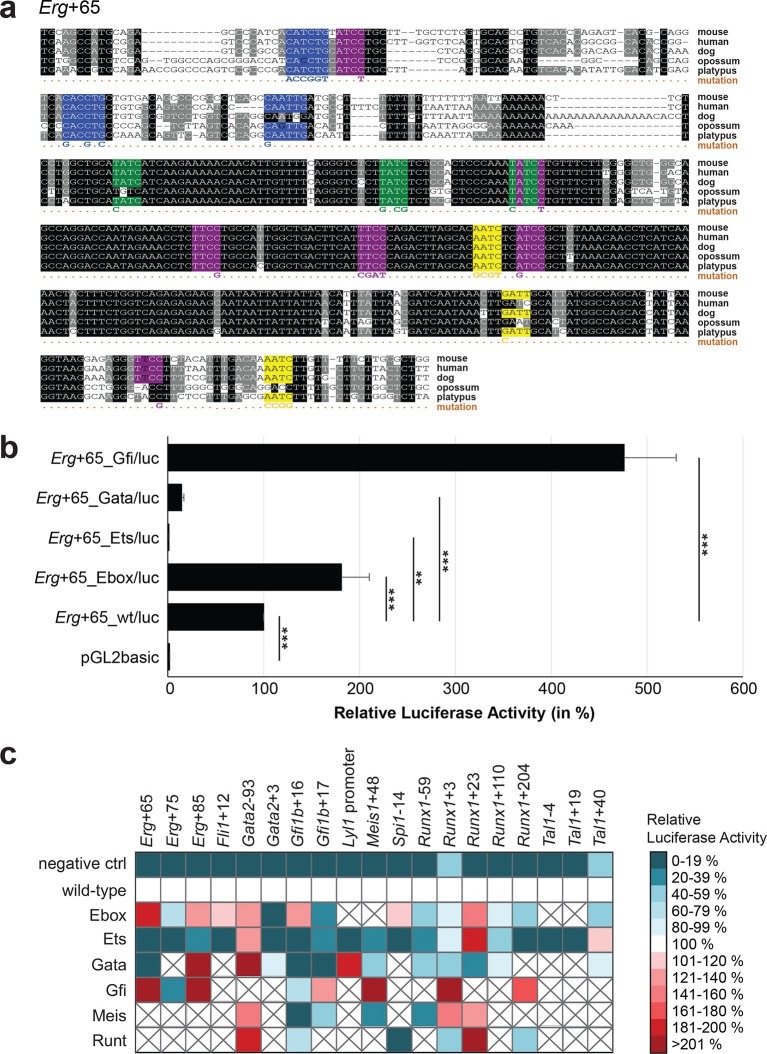
Figure 3. TFBS mutagenesis reveals enhancer-dependent effects of TF binding on gene expression.

(a) Multiple species alignment of mouse (mm9), human (hg19), dog (canFam2), opossum (monDom5) and platypus (ornAna1) sequences for the Erg+65 region. Nucleotides highlighted in black are conserved between all species analysed, nucleotides highlighted in grey are conserved between four of five species. Transcription factor binding sites (TFBS) are highlighted in: blue = Ebox, purple = Ets, green = Gata, yellow = Gfi, red = Meis. The nucleotides that were changed to mutate the TFBSs are indicated below the alignment. All binding sites of one motif family (e.g. all Ebox motifs) were mutated simultaneously. (b) Luciferase assay for the Erg+65 wild-type and mutant enhancer in stably transfected 416b cells. Each bar represents the averages of at least three independent experiments with three to four replicates within each experiment. The results are shown relative to the wild-type enhancer activity, which is set to 100%. Error bars represent the standard error of the mean (SEM). Stars indicate significance: **=p-value <0.01, ***=p-value <0.001. p-values were calculated using t-tests, followed by the Fisher’s method. (c) Summary of luciferase assay results for all 19 high-confidence haematopoietic active regulatory regions. Relative luciferase activity is illustrated in shades of blue (down-regulation) and red (up-regulation). Crossed-out grey boxes indicate that there is no motif for the TF and/or the TF does not bind to the region. Detailed results and corresponding alignments with highlighted TFBSs and their mutations can be found in Figure 3—figure supplements 118.

DOI: http://dx.doi.org/10.7554/eLife.11469.023

Figure 3—source data 1. List of TF binding sites and the TFs that bind to them.
DOI: 10.7554/eLife.11469.024
Figure 3—source data 2. List of co-ordinates and primer sequences for the regulatory regions analysed in this study.
DOI: 10.7554/eLife.11469.025

Figure 3.

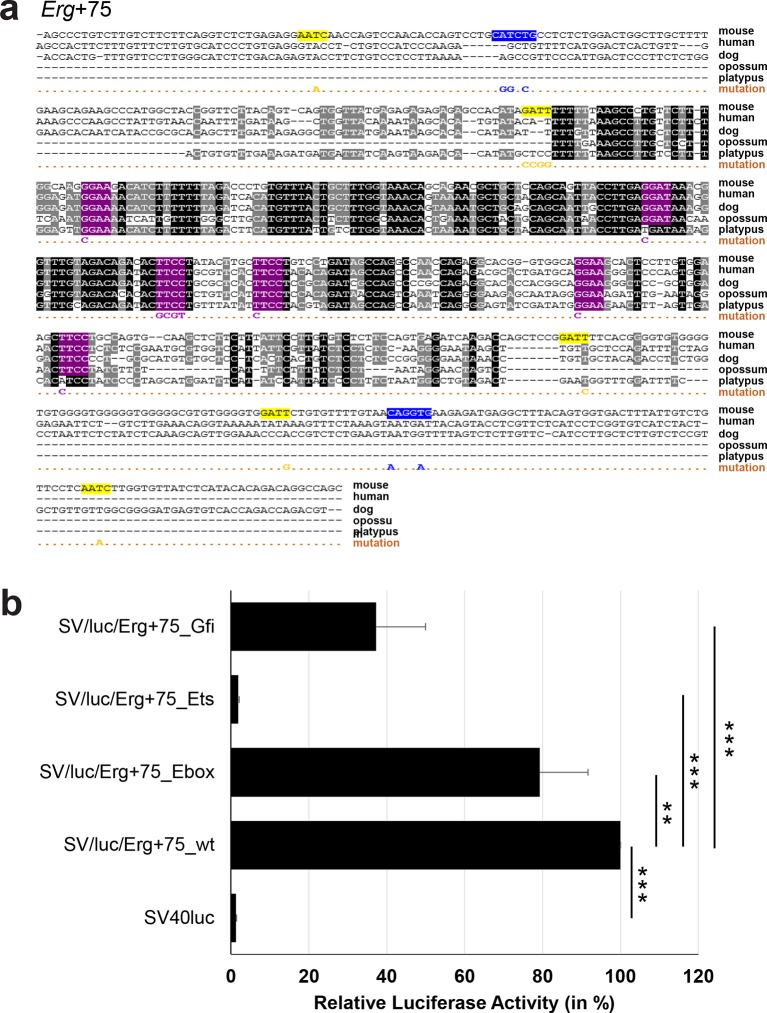
Figure 3—figure supplement 1. Multiple species alignment and luciferase assay results for Erg+75.

Figure 3—figure supplement 1.

(a) Multiple species alignment (MSA) with the following species: mouse (mm9), human (hg19), dog (canFam2), opossum (monDom5) and platypus (ornAna1). Nucleotides highlighted in black are conserved between all species analysed, nucleotides highlighted in grey are conserved between four of five species. Transcription factor binding sites (TFBS) are highlighted in: blue = Ebox, purple = Ets, yellow = Gfi. The nucleotides that were changed to mutate the TFBSs are indicated below the MSA. All conserved binding sites of one motif family (e.g. all Ebox motifs) were mutated simultaneously. Where TF binding was observed in ChIP-Seq experiments in 416b cells, but the TFBS was not conserved, the motifs present in the mouse sequence only were mutated. (b) For the luciferase reporter assays in stably transfected 416b cells, the averages of at least three independent experiments with three to four replicates within each experiment are shown. Error bars represent the standard error of the mean (SEM). Stars indicate significance: **=p-value <0.01, ***=p-value <0.001. p-values were generated using t-tests, followed by the Fisher’s method and if necessary Stouffer’s z trend.
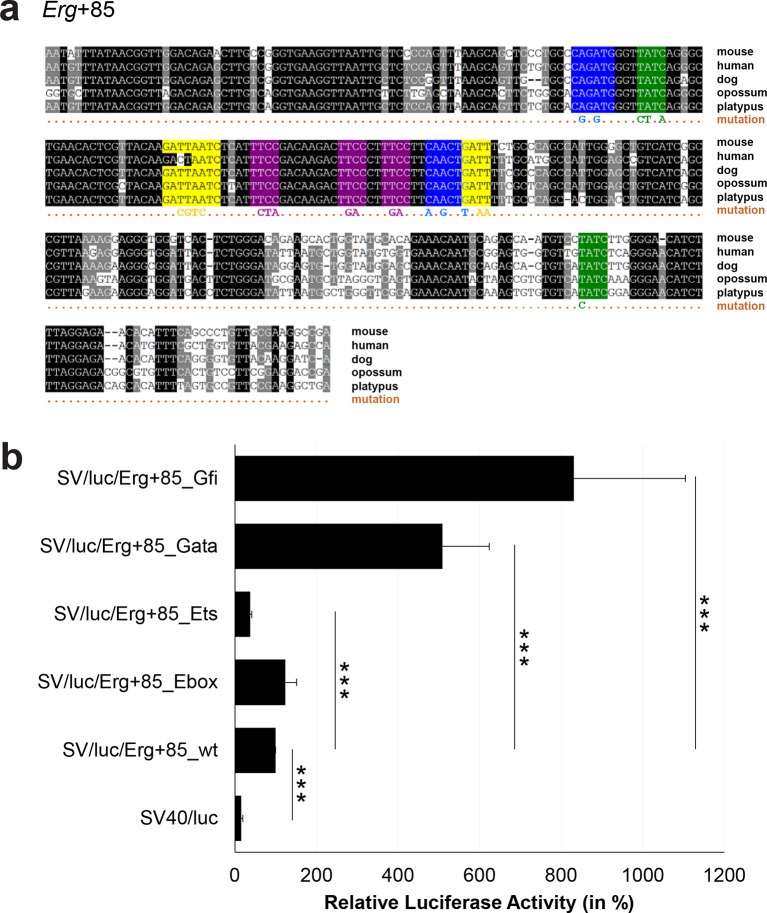
Figure 3—figure supplement 2. Multiple species alignment and luciferase assay results for Erg+85.

Figure 3—figure supplement 2.

(a) Multiple species alignment (MSA) with the following species: mouse (mm9), human (hg19), dog (canFam2), opossum (monDom5) and platypus (ornAna1). Nucleotides highlighted in black are conserved between all species analysed, nucleotides highlighted in grey are conserved between four of five species. Transcription factor binding sites (TFBS) are highlighted in: blue = Ebox, purple = Ets, green = Gata, yellow = Gfi. The nucleotides that were changed to mutate the TFBSs are indicated below the MSA. All conserved binding sites of one motif family (e.g. all Ebox motifs) were mutated simultaneously. (b) For the luciferase reporter assays in stably transfected 416b cells, the averages of at least three independent experiments with three to four replicates within each experiment are shown. Error bars represent the standard error of the mean (SEM). Stars indicate significance: ***=p-value <0.001. p-values were generated using t-tests, followed by the Fisher’s method and if necessary Stouffer’s z trend.
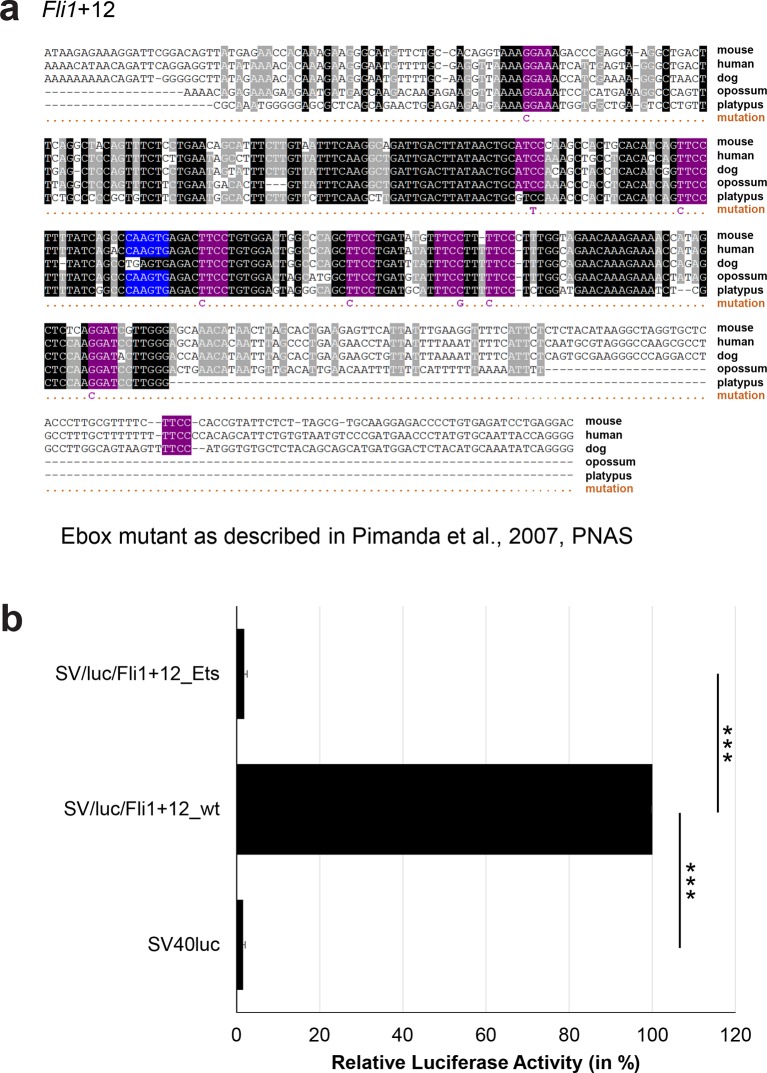
Figure 3—figure supplement 3. Multiple species alignment and luciferase assay results for Fli1+12.

Figure 3—figure supplement 3.

(a) Multiple species alignment (MSA) with the following species: mouse (mm9), human (hg19), dog (canFam2), opossum (monDom5) and platypus (ornAna1). Nucleotides highlighted in black are conserved between all species analysed, nucleotides highlighted in grey are conserved between four of five species. Transcription factor binding sites (TFBS) are highlighted in: blue = Ebox, purple = Ets. The nucleotides that were changed to mutate the TFBSs are indicated below the MSA. All conserved binding sites of one motif family (e.g. all Etsmotifs) were mutated simultaneously. (b) For the luciferase reporter assays in stably transfected 416b cells, the averages of at least three independent experiments with three to four replicates within each experiment are shown. Error bars represent the standard error of the mean (SEM). Stars indicate significance: ***=p-value <0.001. p-values were generated using t-tests, followed by the Fisher’s method and if necessary Stouffer’s z trend.
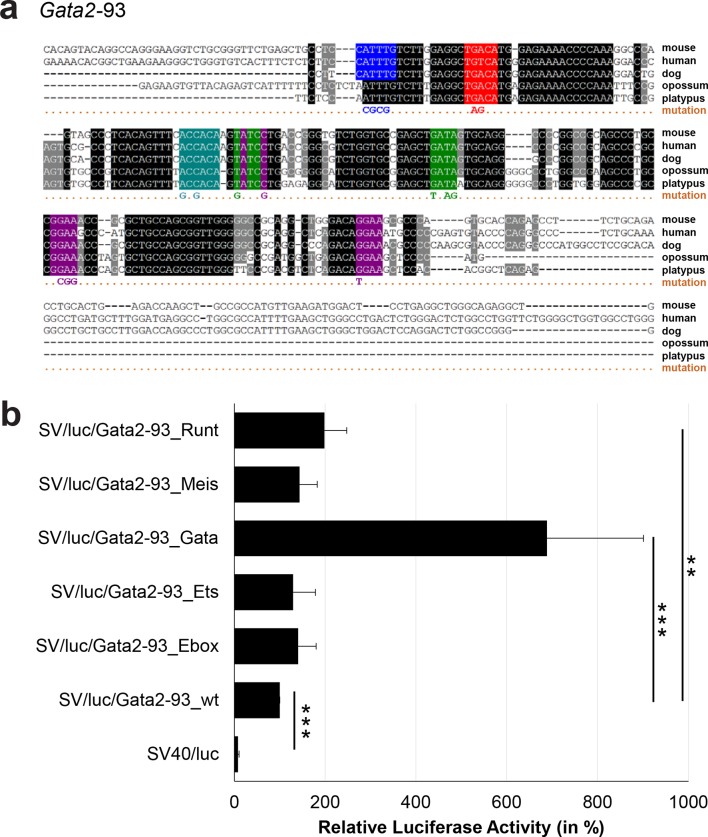
Figure 3—figure supplement 4. Multiple species alignment and luciferase assay results for Gata2-93.

Figure 3—figure supplement 4.

(a) Multiple species alignment (MSA) with the following species: mouse (mm9), human (hg19), dog (canFam2), opossum (monDom5) and platypus (ornAna1). Nucleotides highlighted in black are conserved between all species analysed, nucleotides highlighted in grey are conserved between four of five species. Transcription factor binding sites (TFBS) are highlighted in: blue = Ebox, purple = Ets, green = Gata, red = Meis, turquoise = Runt. The nucleotides that were changed to mutate the TFBSs are indicated below the MSA. All conserved binding sites of one motif family (e.g. all Ets motifs) were mutated simultaneously. (b) For the luciferase reporter assays in stably transfected 416b cells, the averages of at least three independent experiments with three to four replicates within each experiment are shown. Error bars represent the standard error of the mean (SEM). Stars indicate significance: **=p-value <0.01, ***=p-value <0.001. p-values were generated using t-tests, followed by the Fisher’s method and if necessary Stouffer’s z trend.
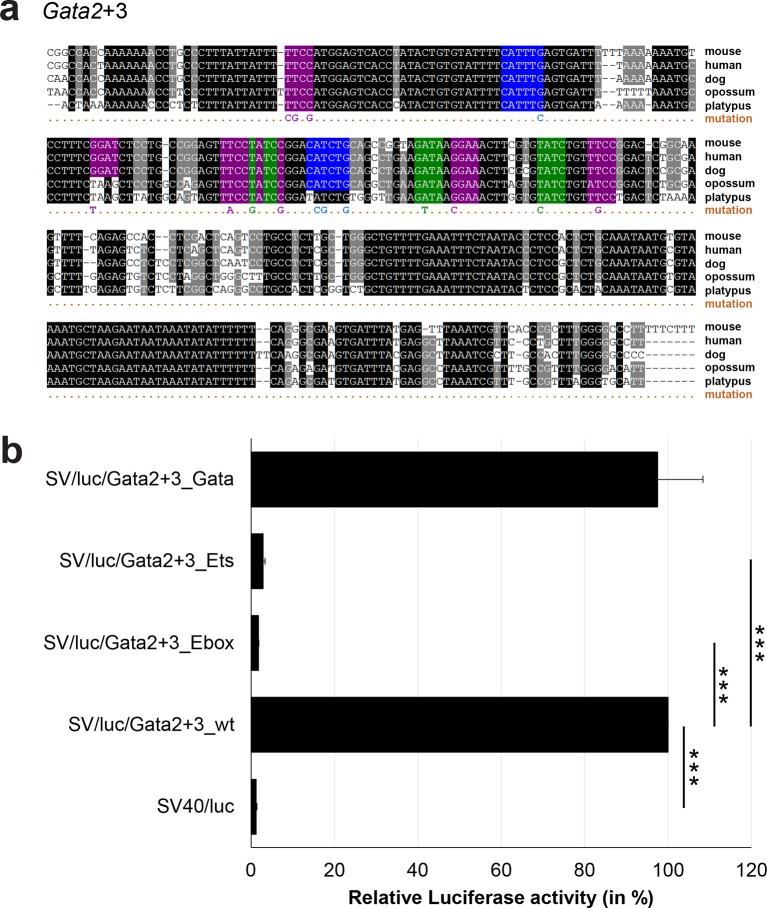
Figure 3—figure supplement 5. Multiple species alignment and luciferase assay results for Gata2+3.

Figure 3—figure supplement 5.

(a) Multiple species alignment (MSA) with the following species: mouse (mm9), human (hg19), dog (canFam2), opossum (monDom5) and platypus (ornAna1). Nucleotides highlighted in black are conserved between all species analysed, nucleotides highlighted in grey are conserved between four of five species. Transcription factor binding sites (TFBS) are highlighted in: blue = Ebox, purple = Ets, green = Gata. The nucleotides that were changed to mutate the TFBSs are indicated below the MSA. All conserved binding sites of one motif family (e.g. all Ebox motifs) were mutated simultaneously. (b) For the luciferase reporter assays in stably transfected 416b cells, the averages of at least three independent experiments with three to four replicates within each experiment are shown. Error bars represent the standard error of the mean (SEM). Stars indicate significance: ***=p-value <0.001. p-values were generated using t-tests, followed by the Fisher’s method and if necessary Stouffer’s z trend.
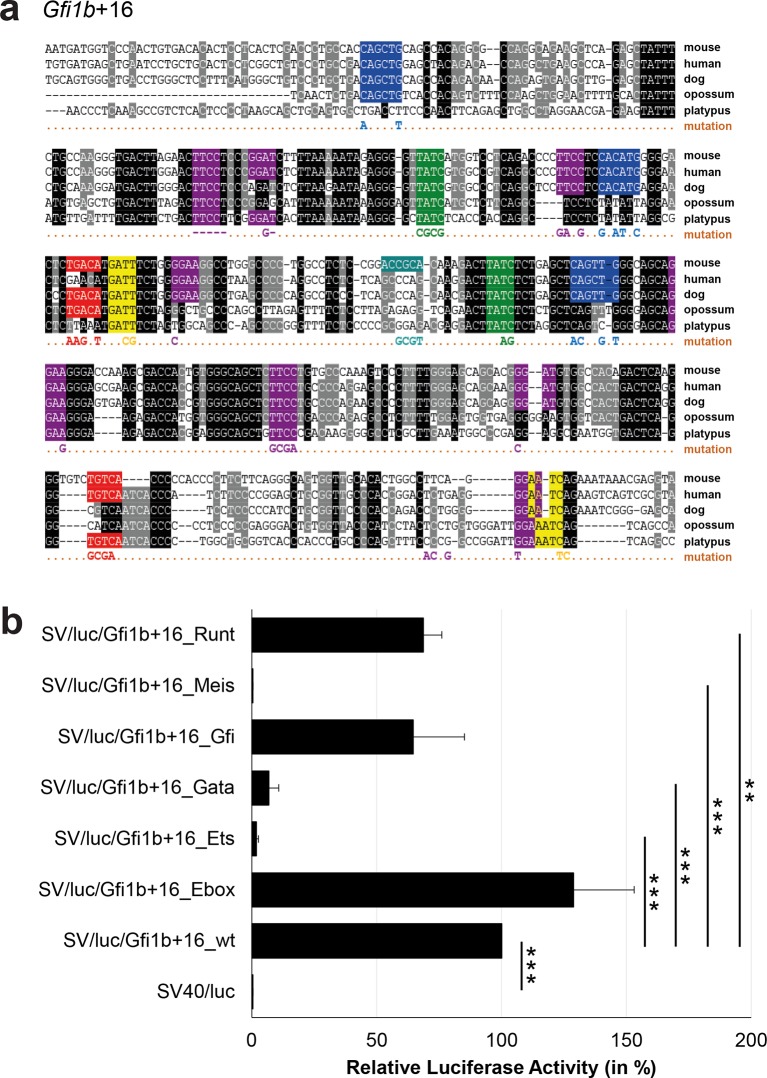
Figure 3—figure supplement 6. Multiple species alignment and luciferase assay results for Gfi1b+16.

Figure 3—figure supplement 6.

(a) Multiple species alignment (MSA) with the following species: mouse (mm9), human (hg19), dog (canFam2), opossum (monDom5) and platypus (ornAna1). Nucleotides highlighted in black are conserved between all species analysed, nucleotides highlighted in grey are conserved between four of five species. Transcription factor binding sites (TFBS) are highlighted in: blue = Ebox, purple = Ets, green = Gata, yellow = Gfi, red = Meis, turquoise = Runt. The nucleotides that were changed to mutate the TFBSs are indicated below the MSA. All conserved binding sites of one motif family (e.g. all Ebox motifs) were mutated simultaneously. Where TF binding was observed in ChIP-Seq experiments in 416b cells, but the TFBS was not conserved, the motifs present in the mouse sequence only were mutated. (b) For the luciferase reporter assays in stably transfected 416b cells, the averages of at least three independent experiments with three to four replicates within each experiment are shown. Error bars represent the standard error of the mean (SEM). Stars indicate significance: **=p-value <0.01, ***=p-value <0.001. p-values were generated using t-tests, followed by the Fisher’s method and if necessary Stouffer’s z trend.
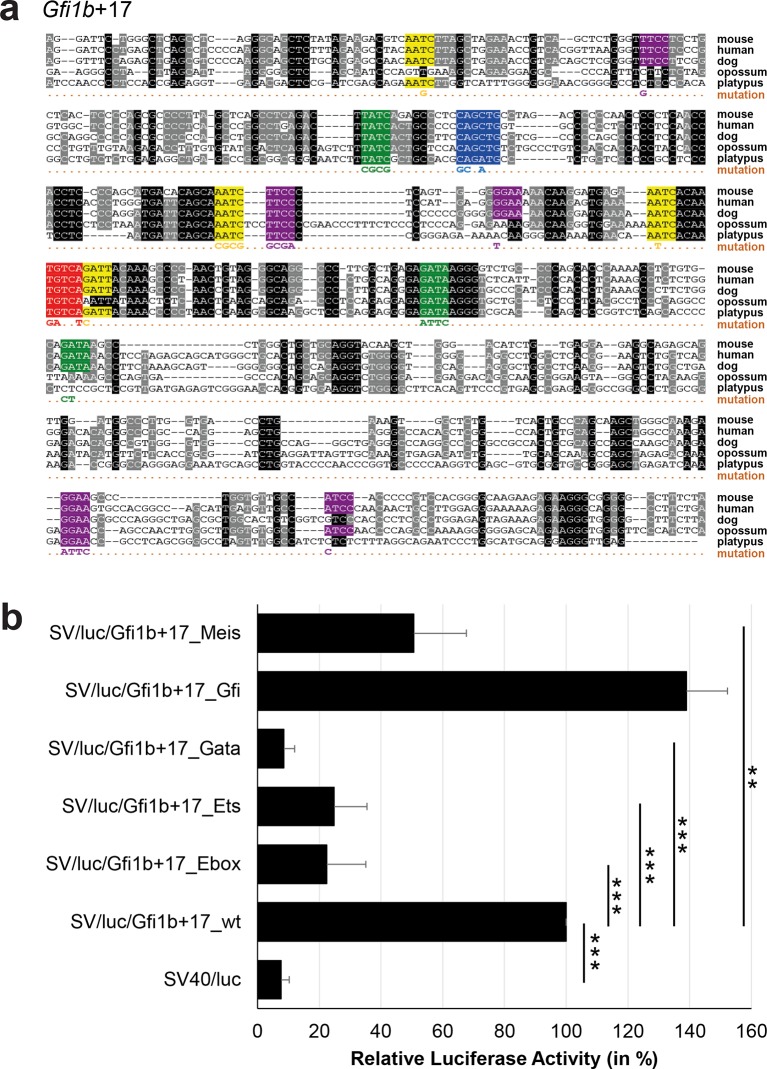
Figure 3—figure supplement 7. Multiple species alignment and luciferase assay results for Gfi1b+17.

Figure 3—figure supplement 7.

(a) Multiple species alignment (MSA) with the following species: mouse (mm9), human (hg19), dog (canFam2), opossum (monDom5) and platypus (ornAna1). Nucleotides highlighted in black are conserved between all species analysed, nucleotides highlighted in grey are conserved between four of five species. Transcription factor binding sites (TFBS) are highlighted in: blue = Ebox, purple = Ets, green = Gata, yellow = Gfi, red = Meis. The nucleotides that were changed to mutate the TFBSs are indicated below the MSA. All conserved binding sites of one motif family (e.g. all Ets motifs) were mutated simultaneously. (b) For the luciferase reporter assays in stably transfected 416b cells, the averages of at least three independent experiments with three to four replicates within each experiment are shown. Error bars represent the standard error of the mean (SEM). Stars indicate significance: **=p-value <0.01, ***=p-value <0.001. p-values were generated using t-tests, followed by the Fisher’s method and if necessary Stouffer’s z trend.
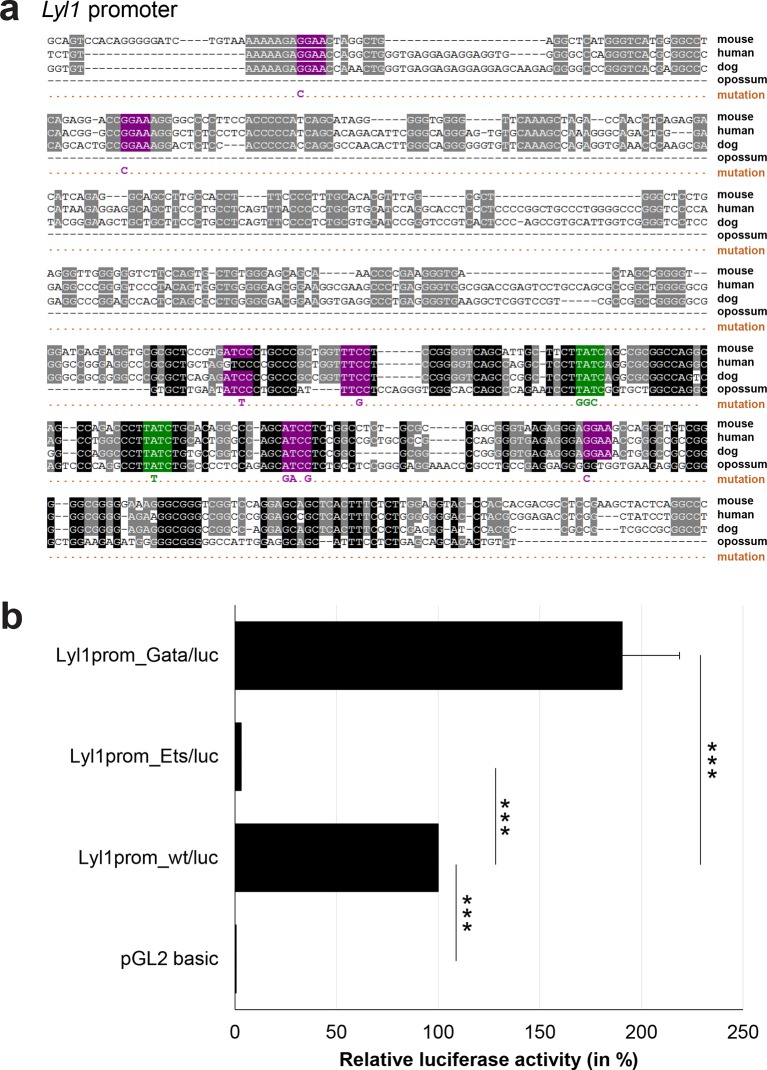
Figure 3—figure supplement 8. Multiple species alignment and luciferase assay results for Lyl1 promoter.

Figure 3—figure supplement 8.

(a) Multiple species alignment (MSA) with the following species: mouse (mm9), human (hg19), dog (canFam2) and opossum (monDom5). Nucleotides highlighted in black are conserved between all species analysed, nucleotides highlighted in grey are conserved between three of four species. Transcription factor binding sites (TFBS) are highlighted in: purple = Ets, green = Gata. The nucleotides that were changed to mutate the TFBSs are indicated below the MSA. All conserved binding sites of one motif family (e.g. all Ets motifs) were mutated simultaneously. (b) For the luciferase reporter assays in stably transfected 416b cells, the averages of at least three independent experiments with three to four replicates within each experiment are shown. Error bars represent the standard error of the mean (SEM). Stars indicate significance: ***=p-value <0.001. p-values were generated using t-tests, followed by the Fisher’s method and if necessary Stouffer’s z trend.
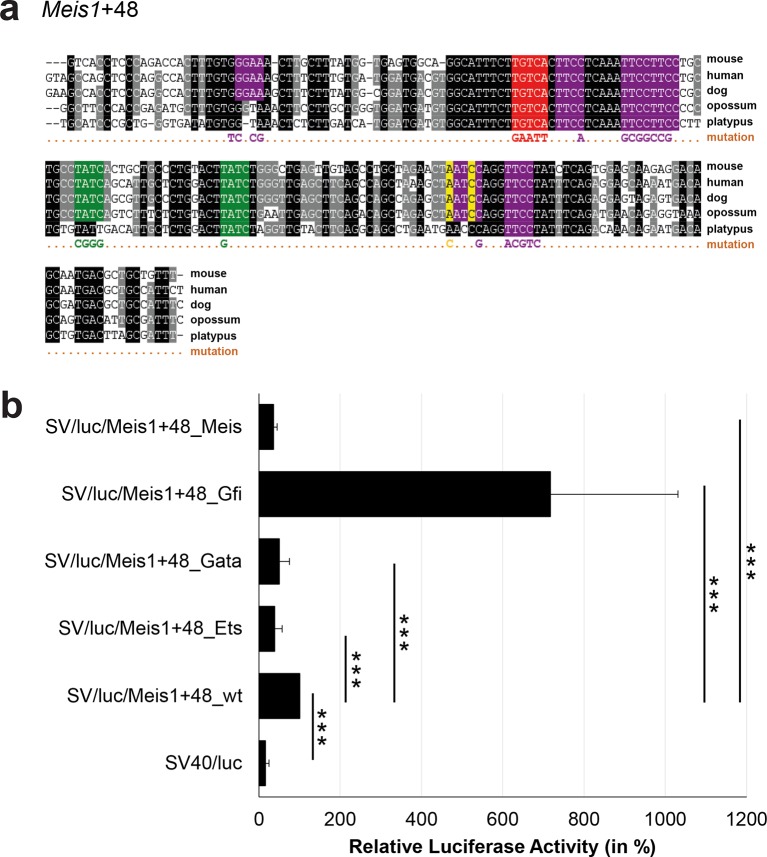
Figure 3—figure supplement 9. Multiple species alignment and luciferase assay results for Meis1+48.

Figure 3—figure supplement 9.

(a) Multiple species alignment (MSA) with the following species: mouse (mm9), human (hg19), dog (canFam2), opossum (monDom5) and platypus (ornAna1). Nucleotides highlighted in black are conserved between all species analysed, nucleotides highlighted in grey are conserved between four of five species. Transcription factor binding sites (TFBS) are highlighted in: purple = Ets, green = Gata, yellow = Gfi, red = Meis. The nucleotides that were changed to mutate the TFBSs are indicated below the MSA. All conserved binding sites of one motif family (e.g. all Ets motifs) were mutated simultaneously. (b) For the luciferase reporter assays in stably transfected 416b cells, the averages of at least three independent experiments with three to four replicates within each experiment are shown. Error bars represent the standard error of the mean (SEM). Stars indicate significance: ***=p-value <0.001. p-values were generated using t-tests, followed by the Fisher’s method and if necessary Stouffer’s z trend.
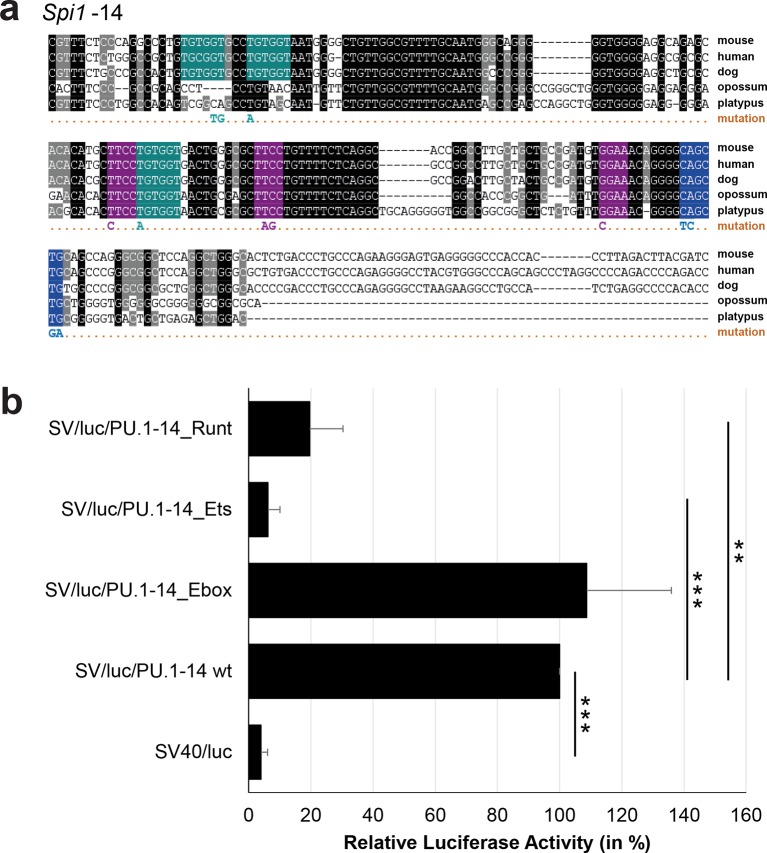
Figure 3—figure supplement 10. Multiple species alignment and luciferase assay results for Spi1-14.

Figure 3—figure supplement 10.

(a) Multiple species alignment (MSA) with the following species: mouse (mm9), human (hg19), dog (canFam2), opossum (monDom5) and platypus (ornAna1). Nucleotides highlighted in black are conserved between all species analysed, nucleotides highlighted in grey are conserved between four of five species. Transcription factor binding sites (TFBS) are highlighted in: blue = Ebox, purple = Ets, turquoise = Runt. The nucleotides that were changed to mutate the TFBSs are indicated below the MSA. All conserved binding sites of one motif family (e.g. all Ets motifs) were mutated simultaneously. (b) For the luciferase reporter assays in stably transfected 416b cells, the averages of at least three independent experiments with three to four replicates within each experiment are shown. Error bars represent the standard error of the mean (SEM). Stars indicate significance: **=p-value <0.01, ***=p-value <0.001. p-values were generated using t-tests, followed by the Fisher’s method and if necessary Stouffer’s z trend.
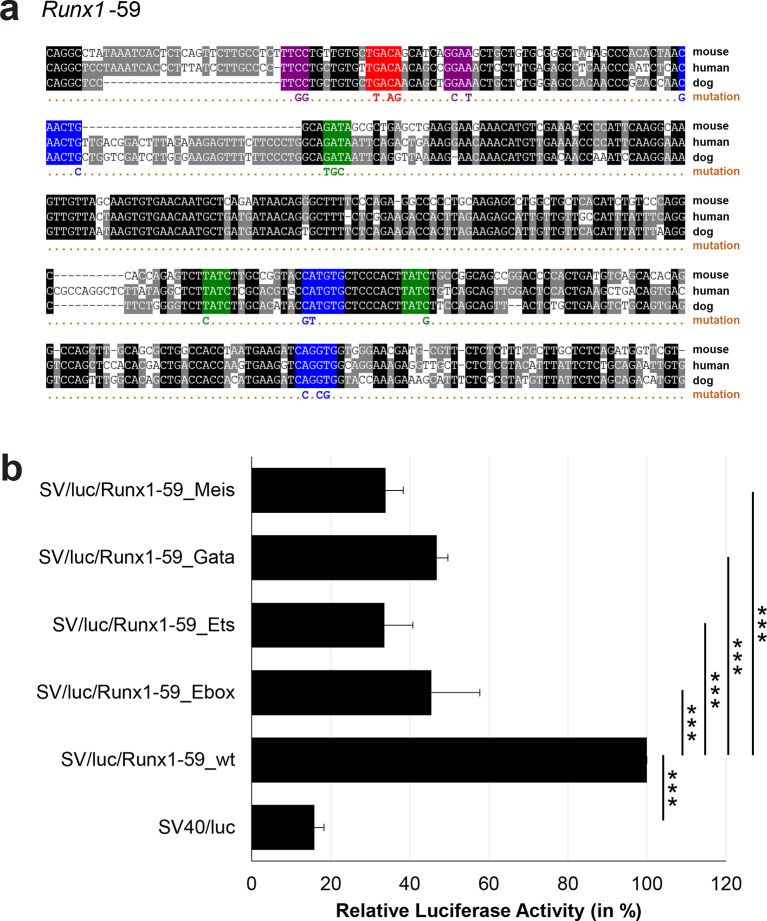
Figure 3—figure supplement 11. Multiple species alignment and luciferase assay results for Runx1-59.

Figure 3—figure supplement 11.

(a) Multiple species alignment (MSA) with the following species: mouse (mm9), human (hg19) and dog (canFam2). Nucleotides highlighted in black are conserved between all species analysed, nucleotides highlighted in grey are conserved between two of three species. Transcription factor binding sites (TFBS) are highlighted in: blue = Ebox, purple = Ets, green = Gata, red = Meis. The nucleotides that were changed to mutate the TFBSs are indicated below the MSA. All conserved binding sites of one motif family (e.g. all Ebox motifs) were mutated simultaneously. (b) For the luciferase reporter assays in stably transfected 416b cells, the averages of at least three independent experiments with three to four replicates within each experiment are shown. Error bars represent the standard error of the mean (SEM). Stars indicate significance: ***=p-value <0.001. p-values were generated using t-tests, followed by the Fisher’s method and if necessary Stouffer’s z trend.
Figure 3—figure supplement 12. Multiple species alignment and luciferase assay results for Runx1+3.
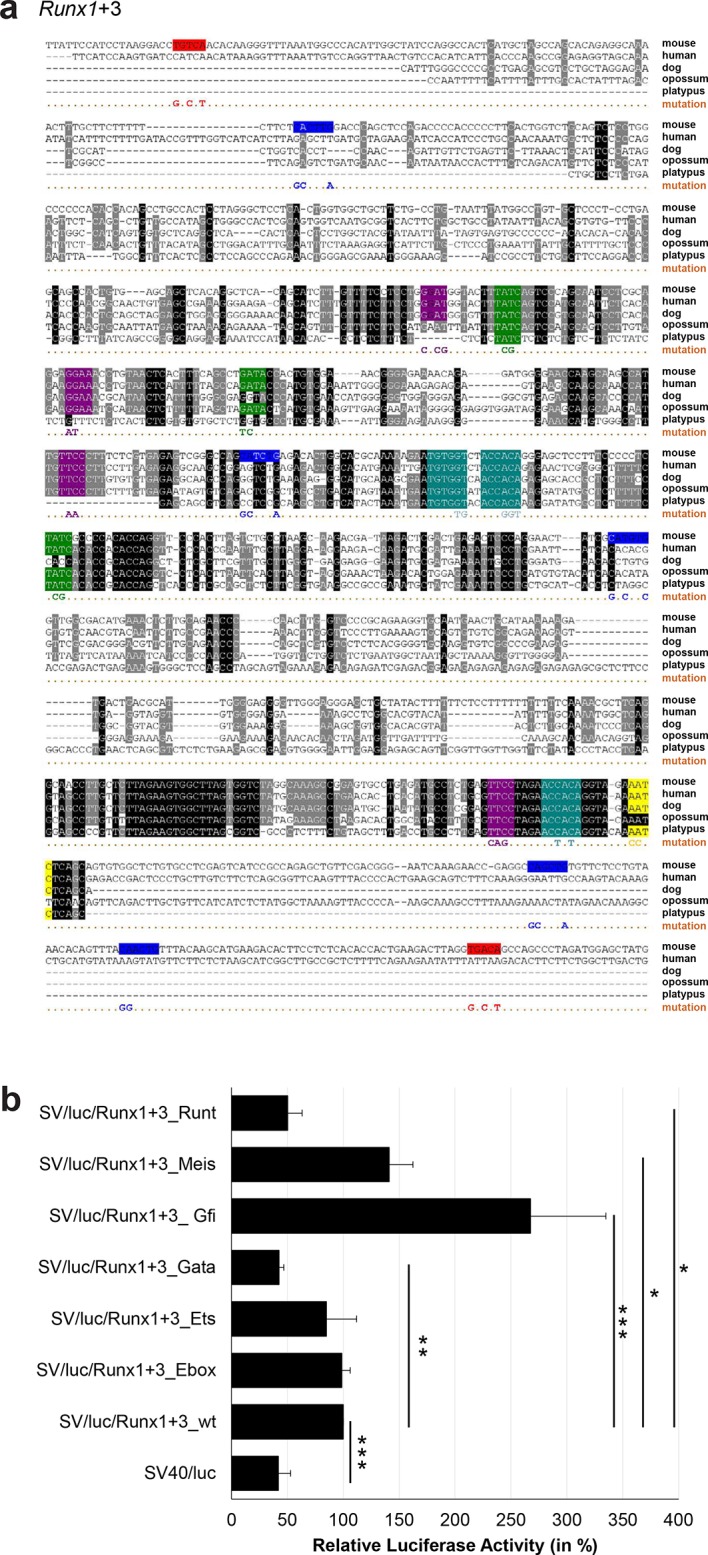
Figure 3—figure supplement 12.

(a) Multiple species alignment (MSA) with the following species: mouse (mm9), human (hg19), dog (canFam2), opossum (monDom5) and platypus (ornAna1). Nucleotides highlighted in black are conserved between all species analysed, nucleotides highlighted in grey are conserved between four of five species. Transcription factor binding sites (TFBS) are highlighted in: blue = Ebox, purple = Ets, green = Gata, yellow = Gfi, red = Meis, turquoise = Runt. The nucleotides that were changed to mutate the TFBSs are indicated below the MSA. All conserved binding sites of one motif family (e.g. all Ets motifs) were mutated simultaneously. Where TF binding was observed in ChIP-Seq experiments in 416b cells, but the TFBS was not conserved, the motifs present in the mouse sequence only were mutated. (b) For the luciferase reporter assays in stably transfected 416b cells, the averages of at least three independent experiments with three to four replicates within each experiment are shown. Error bars represent the standard error of the mean (SEM). Stars indicate significance: *=p-value <0.05, **=p-value <0.01, ***=p-value <0.001. p-values were generated using t-tests, followed by the Fisher’s method and if necessary Stouffer’s z trend.
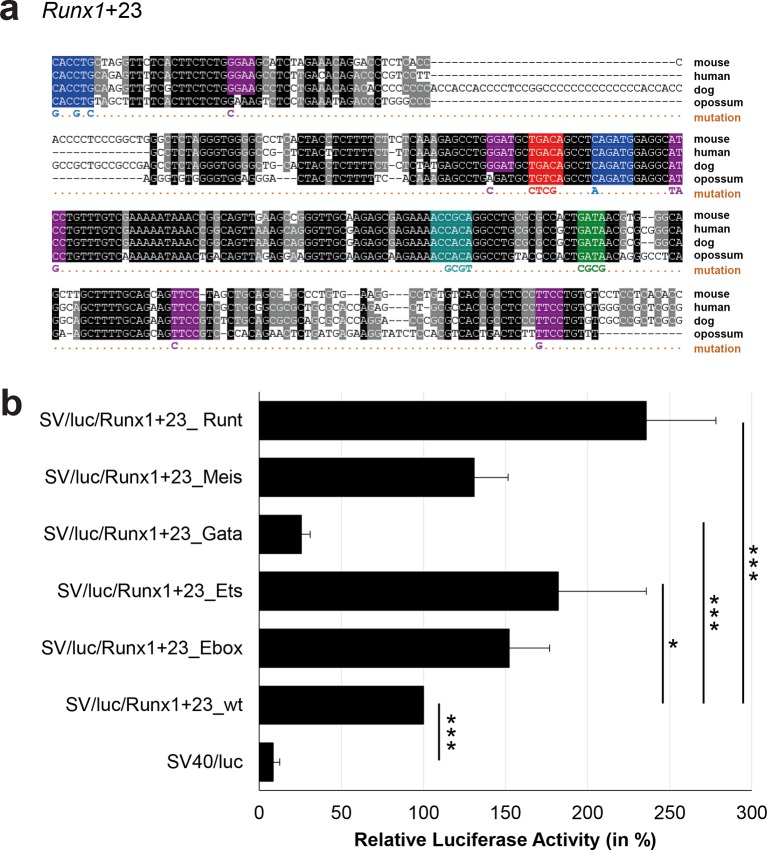
Figure 3—figure supplement 13. Multiple species alignment and luciferase assay results for Runx1+23.

Figure 3—figure supplement 13.

(a) Multiple species alignment (MSA) with the following species: mouse (mm9), human (hg19), dog (canFam2) and opossum (monDom5). Nucleotides highlighted in black are conserved between all species analysed, nucleotides highlighted in grey are conserved between three to four species. Transcription factor binding sites (TFBS) are highlighted in: blue = Ebox, purple = Ets, green = Gata, red = Meis, turquoise = Runt. The nucleotides that were changed to mutate the TFBSs are indicated below the MSA. All conserved binding sites of one motif family (e.g. all Ebox motifs) were mutated simultaneously. (b) For the luciferase reporter assays in stably transfected 416b cells, the averages of at least three independent experiments with three to four replicates within each experiment are shown. Error bars represent the standard error of the mean (SEM). Stars indicate significance: *=p-value <0.05, ***=p-value <0.001. p-values were generated using t-tests, followed by the Fisher’s method and if necessary Stouffer’s z trend.
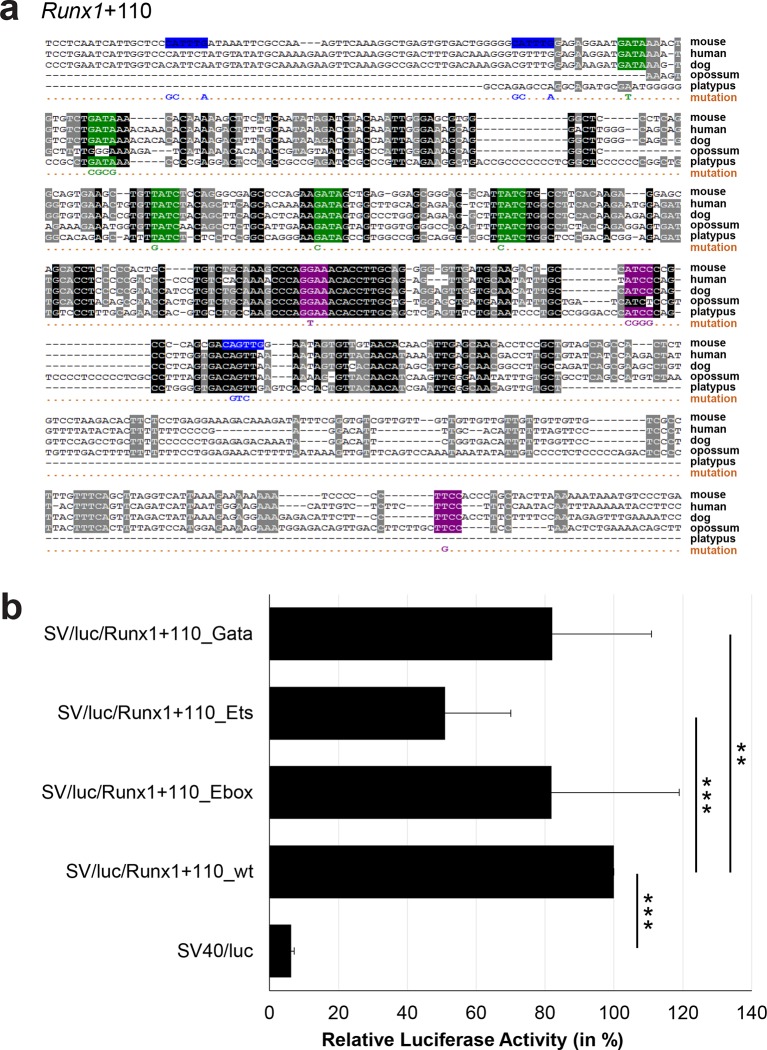
Figure 3—figure supplement 14. Multiple species alignment and luciferase assay results for Runx1+110.

Figure 3—figure supplement 14.

(a) Multiple species alignment (MSA) with the following species: mouse (mm9), human (hg19), dog (canFam2), opossum (monDom5) and platypus (ornAna1). Nucleotides highlighted in black are conserved between all species analysed, nucleotides highlighted in grey are conserved between four of five species. Transcription factor binding sites (TFBS) are highlighted in: blue = Ebox, purple = Ets, green = Gata. The nucleotides that were changed to mutate the TFBSs are indicated below the MSA. All conserved binding sites of one motif family (e.g. all Ets motifs) were mutated simultaneously. Where TF binding was observed in ChIP-Seq experiments in 416b cells, but the TFBS was not conserved, the motifs present in the mouse sequence only were mutated. (b) For the luciferase reporter assays in stably transfected 416b cells, the averages of at least three independent experiments with three to four replicates within each experiment are shown. Error bars represent the standard error of the mean (SEM). Stars indicate significance: **=p-value <0.01, ***=p-value <0.001. p-values were generated using t-tests, followed by the Fisher’s method and if necessary Stouffer’s z trend.
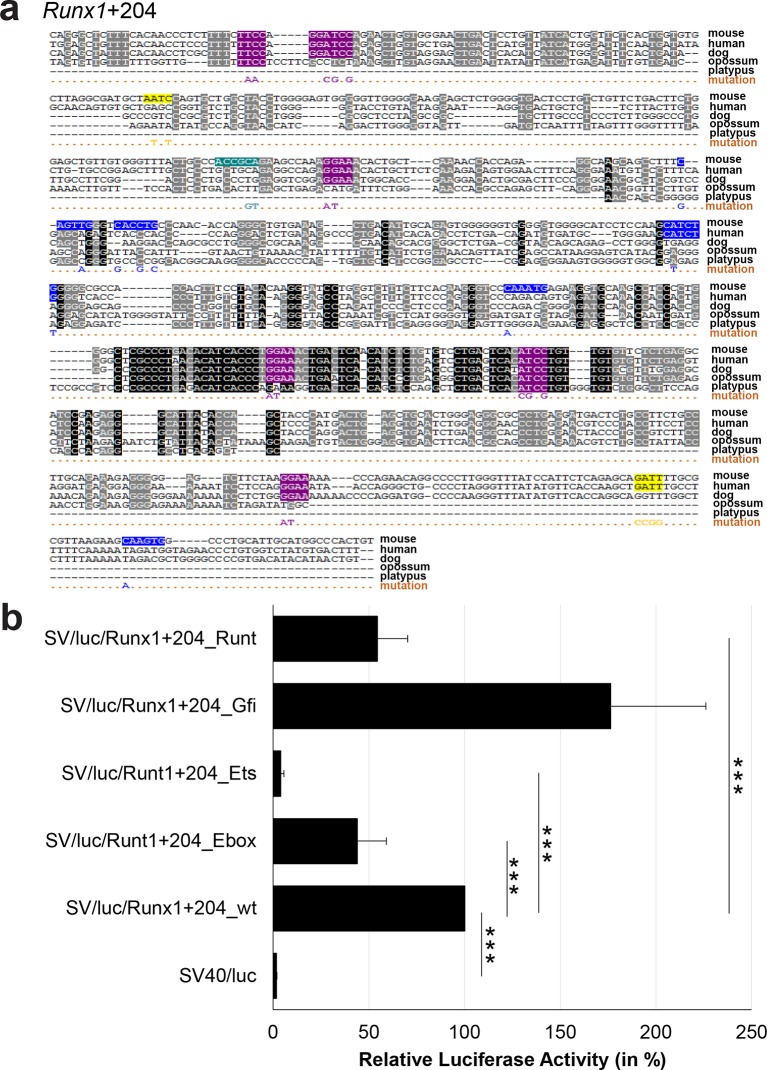
Figure 3—figure supplement 15. Multiple species alignment and luciferase assay results for Runx1+204.

Figure 3—figure supplement 15.

(a) Multiple species alignment (MSA) with the following species: mouse (mm9), human (hg19), dog (canFam2), opossum (monDom5) and platypus (ornAna1). Nucleotides highlighted in black are conserved between all species analysed, nucleotides highlighted in grey are conserved between four of five species. Transcription factor binding sites (TFBS) are highlighted in: blue = Ebox, purple = Ets, yellow = Gfi, turquoise = Runt. The nucleotides that were changed to mutate the TFBSs are indicated below the MSA. All conserved binding sites of one motif family (e.g. all Ets motifs) were mutated simultaneously. Where TF binding was observed in ChIP-Seq experiments in 416b cells, but the TFBS was not conserved, the motifs present in the mouse sequence only were mutated. (b) For the luciferase reporter assays in stably transfected 416b cells, the averages of at least three independent experiments with three to four replicates within each experiment are shown. Error bars represent the standard error of the mean (SEM). Stars indicate significance: ***=p-value <0.001. p-values were generated using t-tests, followed by the Fisher’s method and if necessary Stouffer’s z trend.
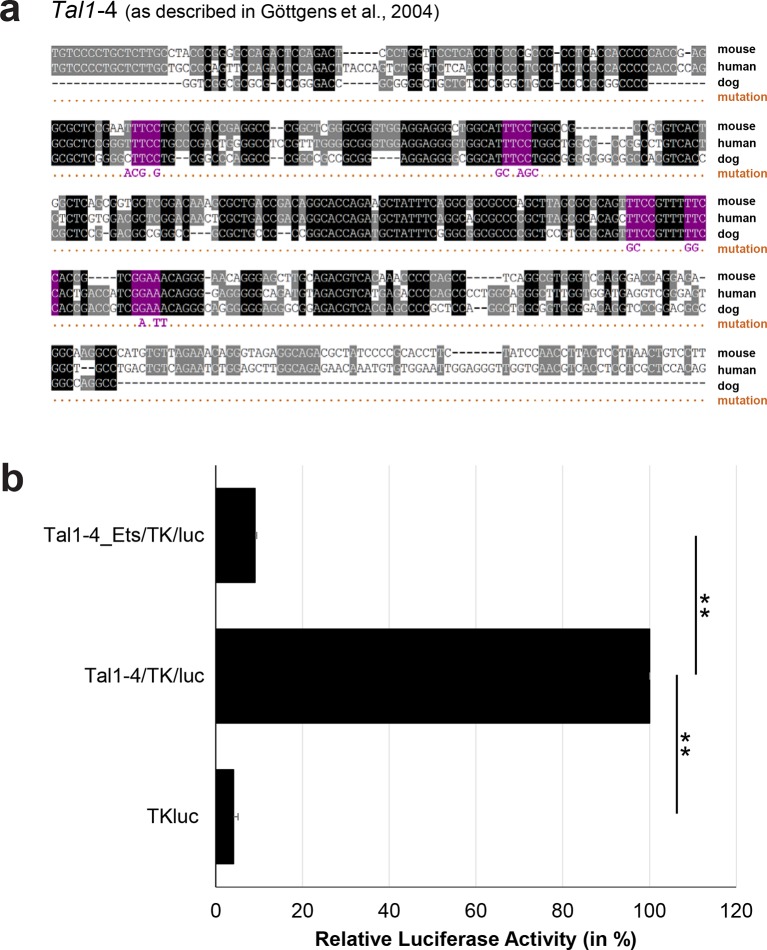
Figure 3—figure supplement 16. Multiple species alignment and luciferase assay results for Tal1-4.

Figure 3—figure supplement 16.

(a) Multiple species alignment (MSA) with the following species: mouse (mm9), human (hg19) and dog (canFam2). Nucleotides highlighted in black are conserved between all species analysed, nucleotides highlighted in grey are conserved between two of three species. Transcription factor binding sites (TFBS) are highlighted in: purple = Ets. The nucleotides that were changed to mutate the TFBSs are indicated below the MSA. All conserved binding sites of the Ets motif family were mutated simultaneously. (b) For the luciferase reporter assays in stably transfected 416b cells, the averages of at least three independent experiments with three to four replicates within each experiment are shown. Error bars represent the standard error of the mean (SEM). Stars indicate significance: **=p-value <0.01. p-values were generated using t-tests, followed by the Fisher’s method and if necessary Stouffer’s z trend.
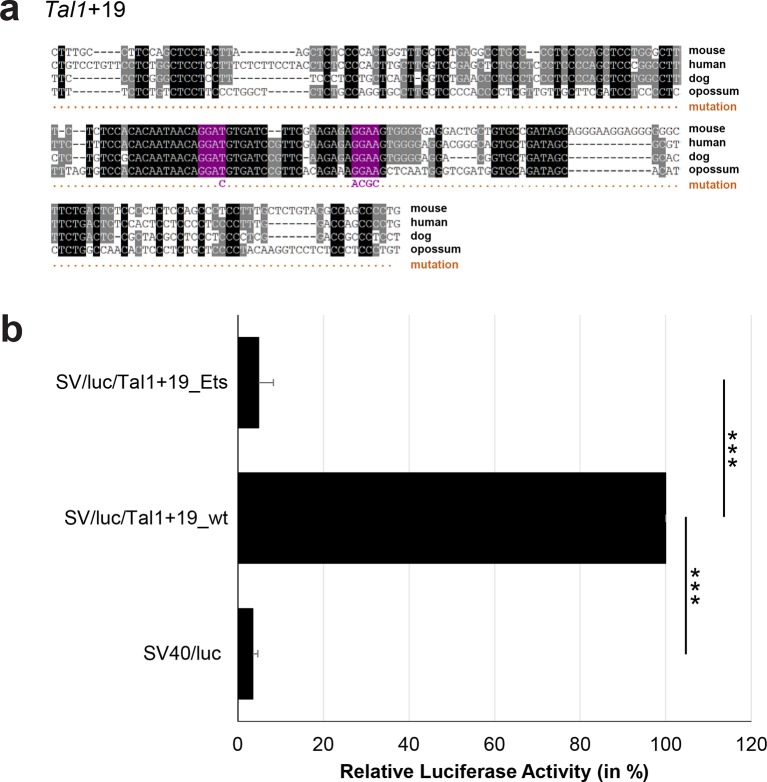
Figure 3—figure supplement 17. Multiple species alignment and luciferase assay results for Tal1+19.

Figure 3—figure supplement 17.

(a) Multiple species alignment (MSA) with the following species: mouse (mm9), human (hg19), dog (canFam2) and opossum (monDom5). Nucleotides highlighted in black are conserved between all species analysed, nucleotides highlighted in grey are conserved between three of four species. Transcription factor binding sites (TFBS) are highlighted in: purple = Ets. The nucleotides that were changed to mutate the TFBSs are indicated below the MSA. All conserved binding sites of the Ets motif family were mutated simultaneously. (b) For the luciferase reporter assays in stably transfected 416b cells, the averages of at least three independent experiments with three to four replicates within each experiment are shown. Error bars represent the standard error of the mean (SEM). Stars indicate significance: ***=p-value <0.001. p-values were generated using t-tests, followed by the Fisher’s method and if necessary Stouffer’s z trend.
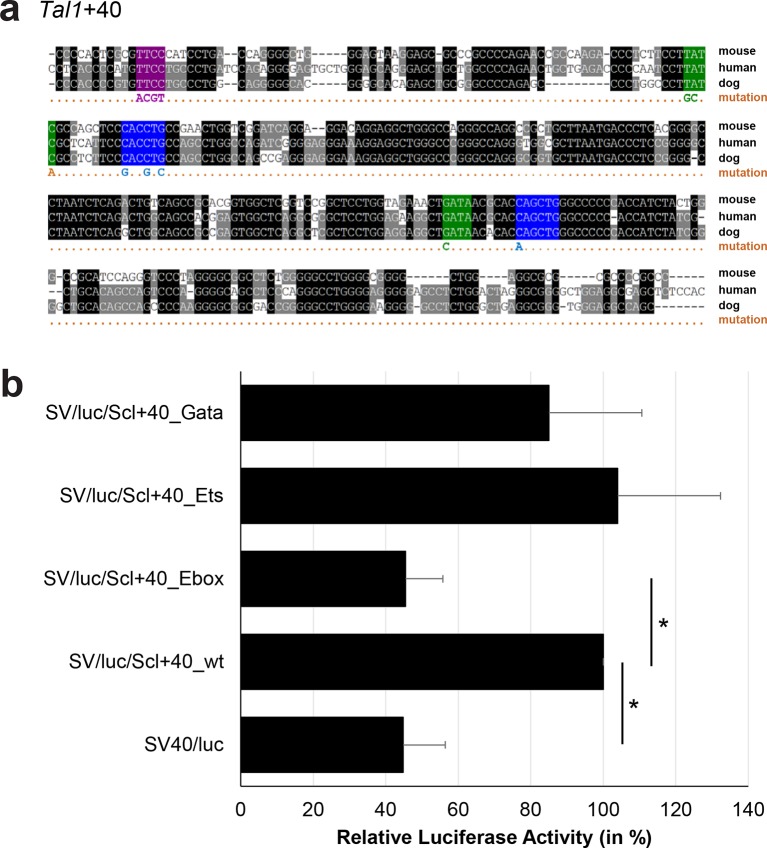
Figure 3—figure supplement 18. Multiple species alignment and luciferase assay results for Tal1+40.

Figure 3—figure supplement 18.

(a) Multiple species alignment (MSA) with the following species: mouse (mm9), human (hg19) and dog (canFam2). Nucleotides highlighted in black are conserved between all species analysed, nucleotides highlighted in grey are conserved between two of three species. Transcription factor binding sites (TFBS) are highlighted in: blue = Ebox, purple = Ets, green = Gata. The nucleotides that were changed to mutate the TFBSs are indicated below the MSA. All conserved binding sites of one motif family (e.g. all Ebox motifs) were mutated simultaneously. (b) For the luciferase reporter assays in stably transfected 416b cells, the averages of at least three independent experiments with three to four replicates within each experiment are shown. Error bars represent the standard error of the mean (SEM). Stars indicate significance: *=p-value <0.05. p-values were generated using t-tests, followed by the Fisher’s method and if necessary Stouffer’s z trend.