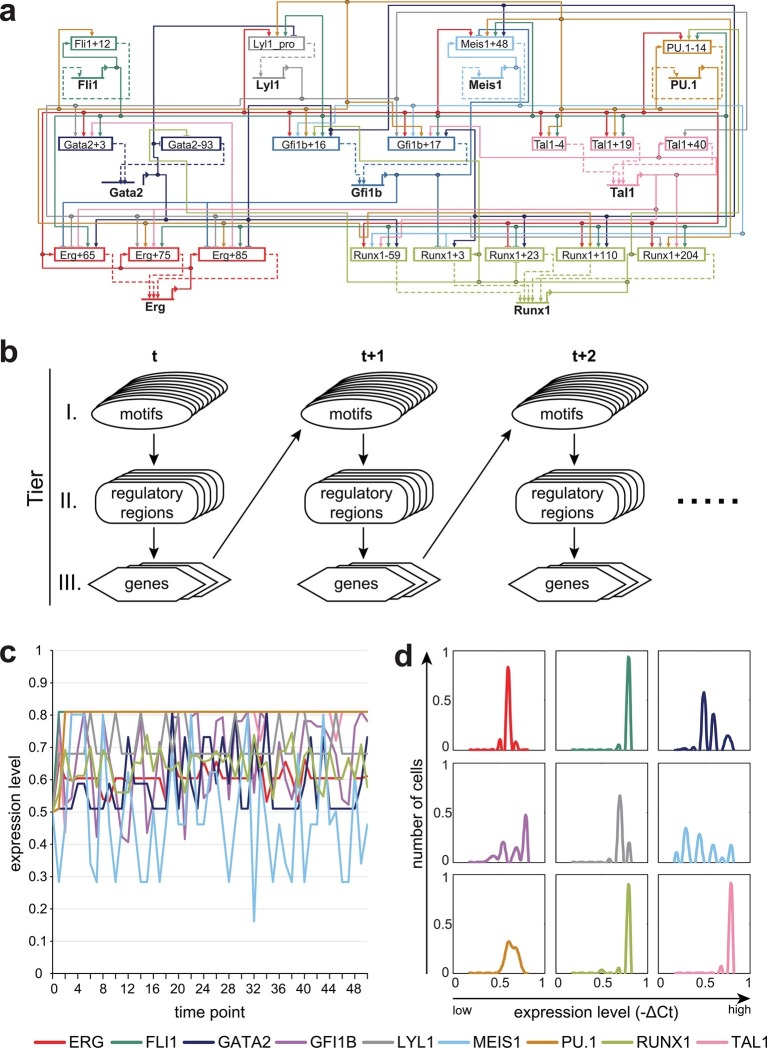
Figure 4. A three-tier dynamic Bayesian network (DBN) incorporating transcriptional regulatory information can recapitulate the HSPC expression state.
(a) Representation of the complete network diagram generated using the Biotapestry software (Longabaugh et al., 2005). (b) Schematic diagram describing the DBN which contains three tiers: I. TF binding motifs within regulatory regions, II. cis-regulatory regions influencing the expression levels of the various TFs, and III. genes encoding the TFs. The output of tier III, namely the expression levels of the TF, feed back into the TF binding at the various motifs of tier I. The model therefore is comprised of successive time slices (t). (c) Simulation of a single cell over time. The expression levels of all 9 TFs are the same at the beginning (0.5). The simulation rapidly stabilizes with characteristic TF expression levels. (d) Simulation of a cell population by running the model 1000 times. The scale of the x-axis is linear. Each simulation was run as described in (c).


