Abstract
Experimental results have been reported on an oversize rectangular waveguide assembly operating nominally at 94 GHz. It was formed using commercially available WR28 waveguide as well as a pair of specially designed tapers with a hyperbolic-cosine shape from WR28 to WR10 waveguide [R. R. Mett et al., Rev. Sci. Instrum. 82, 074704 (2011)]. The oversize section reduces broadband insertion loss for an Electron Paramagnetic Resonance (EPR) probe placed in a 3.36 T magnet. Hyperbolic-cosine tapers minimize reflection of the main mode and the excitation of unwanted propagating waveguide modes. Oversize waveguide is distinguished from corrugated waveguide, overmoded waveguide, or quasi-optic techniques by minimal coupling to higher-order modes. Only the TE10 mode of the parent WR10 waveguide is propagated. In the present work, a new oversize assembly with a gradual 90° twist was implemented. Microwave power measurements show that the twisted oversize waveguide assembly reduces the power loss in the observe and pump arms of a W-band bridge by an average of 2.35 dB and 2.41 dB, respectively, over a measured 1.25 GHz bandwidth relative to a straight length of WR10 waveguide. Network analyzer measurements confirm a decrease in insertion loss of 2.37 dB over a 4 GHz bandwidth and show minimal amplitude distortion of approximately 0.15 dB. Continuous wave EPR experiments confirm these results. The measured phase variations of the twisted oversize waveguide assembly, relative to an ideal distortionless transmission line, are reduced by a factor of two compared to a straight length of WR10 waveguide. Oversize waveguide with proper transitions is demonstrated as an effective way to increase incident power and the return signal for broadband EPR experiments. Detailed performance characteristics, including continuous wave experiment using 1 μM 2,2,6,6-tetramethylpiperidine-1-oxyl in aqueous solution, provided here serve as a benchmark for other broadband low-loss probes in millimeter-wave EPR bridges.
I. INTRODUCTION
The design, construction, and performance of a straight oversize waveguide assembly were reported in Ref. 1. The straight oversize assembly was reported to reduce broadband one-way insertion loss by 2.36 dB over a 4 GHz bandwidth centered at 94 GHz. This oversize section is straight (untwisted) and has a total length of 903 mm. Since Ref. 1, another assembly with a gradual 90° twist over the entire length of the oversize waveguide was constructed with hyperbolic-cosine tapers. The 90° twist is needed to orient the microwave magnetic field in the sample resonator perpendicular to the static magnetic field. We now report three types of measurements comparing the new twisted oversize assembly with a standard WR10 assembly: (1) power measurements of the pump and observe arms of a custom designed W-band electron paramagnetic resonance (EPR) system; (2) EPR power saturation measurements; and (3) frequency and time-domain vector network analyzer measurements of amplitude and phase responses.
For clarity, we define three waveguide assemblies that form the transmission line between the microwave bridge and the sample resonator. First is the “WR10 assembly,” which consists of a straight 902 mm length of WR10 waveguide with a separate, commercially available, 38 mm long 90° twist, as described in Ref. 1. The assembly without the twist will be referred as the “WR10 straight section.” The total length of the WR10 assembly is 940 mm. Second is the “straight oversize assembly,” which consists of a 711 mm length of WR28 rectangular waveguide, with the electric field oriented parallel to the broad dimension, two hyperbolic-cosine (HC) shaped tapers that transition oversize (OS) waveguide to WR10 rectangular waveguide, each 96 mm long, and a separate, commercially available, 38 mm long 90° twist in WR10 waveguide, as described in Ref. 1. The assembly without the WR10 twist will be referred to as the “straight oversize section.” The total length of the assembly is 941 mm. Third is the “twisted oversize (TOS) assembly,” which consists of 749 mm length of WR28 rectangular waveguide with a gradual 90° twist that occurs over the entire length, again with the electric field oriented parallel to the broad dimension and two hyperbolic-cosine shaped tapers, each 96 mm long. The total assembly length is 941 mm. The third assembly is the focus of this work.
A motivating factor for use of an oversize waveguide with proper tapers is to increase incident power at the sample and reduce the return EPR signal loss. High bandwidth experiments, such as frequency swept,2 frequency modulation,3 and hard pulse EPR techniques,4 are technologies enabled by the low-loss high-bandwidth transmission lines at W-band. The practicality of this work depends on the overall bandwidth of the system and resonator. For instance, the 3 dB bandwidth of the loop-gap resonator (LGR), 1 GHz at W-band, and the high resonator efficiency can enable large bandwidth pulse experiments by lowering the required incident power for a hard pulse.5 In order to minimize distortion of the incident waveform and the return EPR signal, frequency dependent amplitude and phase variations must be minimized in the transmission line. Here we compare amplitude and phase measurements of the twisted oversize assembly and the WR10 assembly. Measured performance characteristics serve as a benchmark for other high frequency broadband low-loss probes in magnetic resonance bridges.
II. METHODS
Our custom W-band bridge employs two separate incident arms to enable saturation recovery experiments, named the observe arm and the pump arm.6 In order to characterize the W-band system using the different waveguide assemblies, EPR power saturation measurements were performed using degassed 2,2,6,6-tetramethyl-1-piperidinyloxyl (TEMPO) dissolved in deionized water. Using power saturation as a metric, both the incident power on the sample and the return EPR signal can be measured.
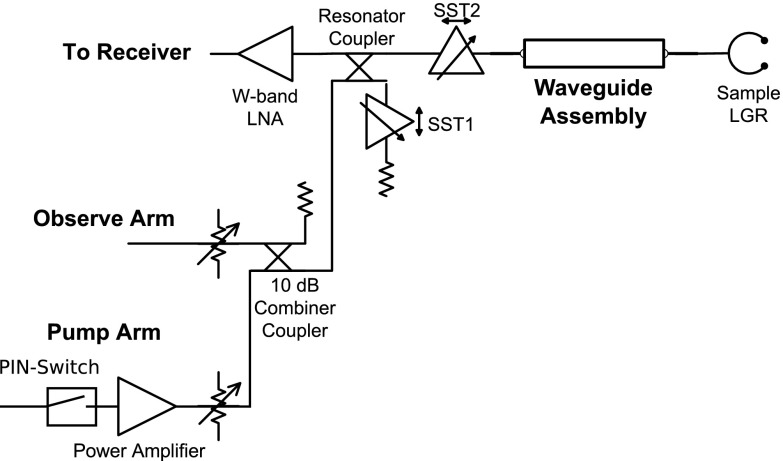
The two incident arm W-band bridge configuration is shown in Fig. 1. The pump arm has a power amplifier and a PIN-switch in order to create timed pulses. A directional coupler, denoted “resonator coupler,” is used instead of a circulator due to the relatively poor bandwidth and isolation performance of ferrite circulators at W-band. The resonator coupler can be a 3, 6, or 10 dB directional coupler and can be used in either forward or reverse configuration to allow for a trade-off between incident power and EPR signal. In this work, the resonator coupler was 3 dB, which sacrifices a factor of 2 in incidental power and 21/2 in EPR signal voltage. Two slide-screw tuners are employed, one to minimize the resonator coupler leakage effect (SST1) and the other to compensate for sample resonator coupling variations during the experiment (SST2). The resonator employs a long-slot iris and is critically coupled with a stub tuner close to the resonator.7 Finally, the EPR signal is amplified by a low-noise amplifier (LNA) at W-band, down converted, and processed in the receiver.
FIG. 1.
W-band EPR bridge with the observe and pump arm powers incident on a loop-gap resonator using various waveguide assemblies.
Microwave power measurements were performed using a Hewlett Packard E4418B EMP series power meter with an Agilent W8486A power sensor at the sample resonator port of the waveguide assemblies. The measured EPR spectrum is of TEMPO at 25 °C with a resonator frequency of 94.35 GHz and 3 G(p−p) field modulation at 433 Hz. A five-loop–four-gap LGR was used.5 Signal intensities at constant microwave field and constant microwave power were recorded and compared. These two experiments have EPR signal metrics for samples that can be saturated (Ss), constant microwave field, and samples that are unsaturable (Su), constant microwave power.8 Network analyzer measurements of insertion loss, return loss, time delay, and phase shift were performed using an Agilent Technologies N5242A PNA-X network analyzer with an Agilent N5262A millimeter head controller, two OML V10VNA2 T/R 75 to 110 GHz millimeter wave extenders, and an OML V10-CAL calibration kit.
Phase shift and time delay measurements from the vector network analyzer were used to compare the one-way through the phase shift of each waveguide assembly relative to the phase shift of a distortionless transmission line. The defined characteristics of a distortionless transmission line are the transmission response of constant amplitude versus frequency and linearly frequency-dependent phase shift response of −2πfτd, where f is the cyclic frequency in Hz and τd is the time delay for propagating along the waveguide in seconds. For the phase shift comparison utilized here, we define the phrase “phase variation” to be the difference of the one-way through phase shift of a waveguide assembly relative to the phase shift of a distortionless transmission line at ±500 MHz from the center frequency of 94 GHz under the condition that the phase shift of the distortionless transmission line equals that of the waveguide assembly at 94 GHz. A vector network analyzer cannot measure the total phase shift at such high millimeter-wave frequencies because the lowest frequency cannot start at 0 Hz. Therefore, to circumvent the constraint of the instrumentation, the one-way through time delay measurement of each waveguide assembly was used to determine the nominal phase shift of a corresponding distortionless transmission line at 94 GHz. Next, the network analyzer phase shift measurements for each waveguide assembly were offset such that the phase shift of the waveguide assembly at 94 GHz matched the nominal phase shift of the corresponding distortionless transmission line at 94 GHz. Finally, the phase variations were then determined between the waveguide assembly and the distortionless transmission line at 93.5 and 94.5 GHz.
III. RESULTS
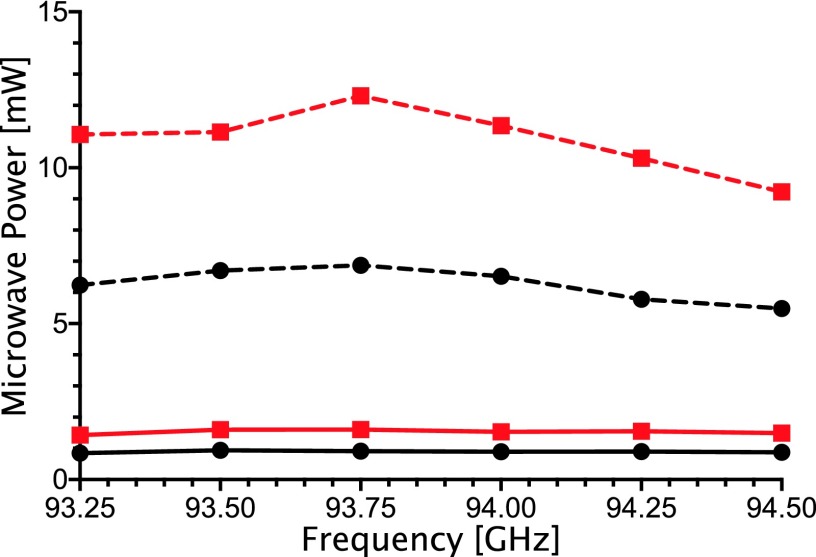
The microwave power measurements taken at the waveguide assembly resonator port for different arms of the EPR bridge over a 1.25 GHz frequency range are shown in Fig. 2. Results at a spot frequency of 94 GHz are also shown in Table I.
FIG. 2.
Power measurements made over the central frequency range of the W-band bridge for the observe arm (solid) and the pump arm (dashed). Results from the twisted oversize assembly are shown in red and from the WR10 assembly are shown in black.
TABLE I.
Measured characteristics comparing the twisted oversize (TOS) assembly and the WR10 assembly.
| TOS | WR10 | Δ (dB) | Frequency (GHz) | |
|---|---|---|---|---|
| Observe ave. power (mW) | 1.53 | 0.89 | 2.35 | 94.00 |
| Pump ave. power (mW) | 10.90 | 6.26 | 2.41 | 94.00 |
| EPR signal, Ss (a.u.) | 1.34 | 1 | … | 94.35 |
| EPR signal, Su (a.u.) | 2.69 | 1 | … | 94.35 |
| P1/2 (mW) | 0.92 | 1.51 | 2.15 | 94.35 |
| Insertion loss (dB) | 0.78 | 3.15 | 2.37 | … |
| Time delay (ns) | 3.543 | 4.030 | … | … |
| Phase variation (deg) | ||||
| At 93.5 GHz | 135.76 | 287.08 | … | … |
| At 94.5 GHz | −138.28 | −285.08 | … | … |
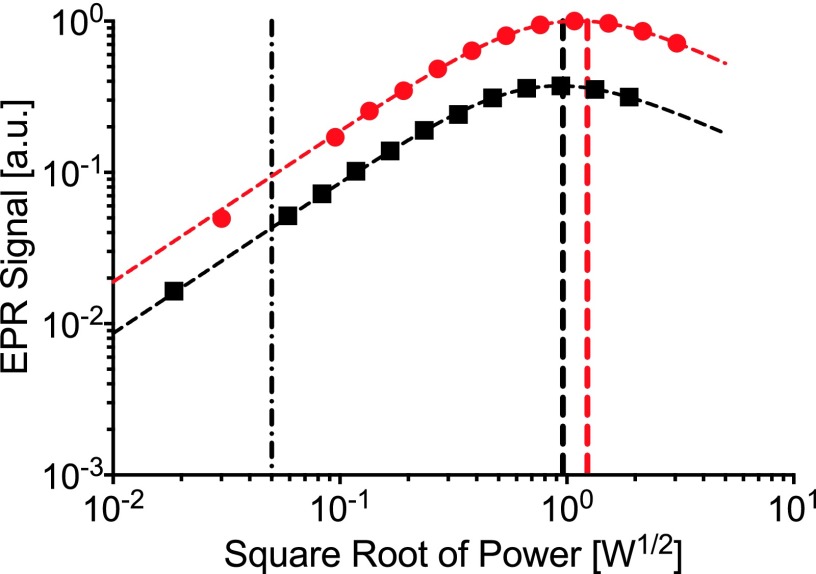
Power saturation measurements of the first harmonic EPR spectrum of 0.5 mM degassed TEMPO are plotted in Fig. 3. Signal comparisons are made at constant microwave power, shown as dashed-dotted, and constant microwave field, shown as red and black dashes. The P1/2-values for power saturation and signal comparisons are listed in Table I.
FIG. 3.
Power saturation curve of degassed TEMPO at W-band. Results from the twisted oversize assembly are shown in red and those from the WR10 assembly are shown in black. Signal measurements are taken at constant microwave field (P1/2-values 0.92 mW and 1.51 mW, red and black dashed, respectively) and at constant microwave power (0.05 mW, dashed-dotted).
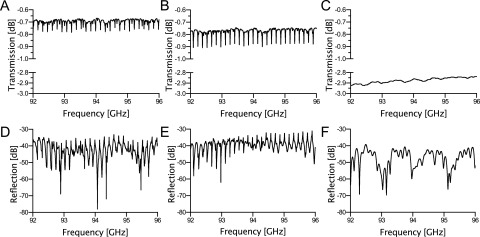
The measured one-way transmission coefficients of the waveguide assemblies, Figs. 4(a)-4(c), compare favorably to those from Ansys HFSS finite-element code simulations (ver. 15, Canonsburg, PA) and analytic theory: −0.581 dB for the straight oversize assembly, −0.608 dB for the twisted oversize assembly, and −2.337 dB for the WR10 assembly. The measured transmission coefficients are expected to be somewhat lower due to surface roughness and copper oxides formed on the interior surfaces of the waveguide. These variations are not accounted for in the simulations and theoretical calculations. The comb-like dips in the transmission coefficient, seen in Figs. 4(a) and 4(b), are caused by the excitation of higher-order modes in the oversize waveguide assemblies (see Ref. 1 for details).
FIG. 4.
Measured transmission (negative of insertion loss) and reflection (negative of return loss) coefficients comparing the straight oversize assembly ((a) and (d)) with the twisted oversize assembly ((b) and (e)), and the WR10 assembly ((c) and (f)), respectively.
The higher-order modes propagate only in the oversize waveguide. Special taper-oversize waveguide interface flanges were adjusted to minimize the magnitude of the transmission dips. The dips are approximately 0.10 dB for the straight oversize assembly and 0.15 dB for the twisted oversize assembly. Such dips are not present in the WR10 assembly, shown in Fig. 4(c). The frequency spacing of the dips is less in the twisted oversize assembly because it has a longer length of oversize waveguide relative to the straight oversize assembly. The average improvement of the one-way insertion loss compared to the WR10 assembly is 2.18 dB for the straight oversize assembly and 2.10 dB for the twisted oversize assembly. However, this comparison does not include the 38 mm WR10 twist, which adds a measured 0.27 dB (theoretically 0.10 dB) loss to the WR10 assembly and to the straight oversize assembly measurements. The resultant decrease in transmission loss of the twisted oversize assembly, 2.37 dB, compares favorably to the improvement in the measured unsaturable EPR signal, 2.32 dB in Table I, and the previously reported results, 2.36 dB, for the straight oversize assembly without the separate twist of Ref. 1. The reflection coefficients of the various sections, Figs. 4(d)-4(f), indicate that the twisted oversize assembly is, on average, 3.37 dB higher than the straight oversize assembly and that the straight oversize assembly is, on average, 8.27 dB higher than the WR10 assembly. However, both oversize assemblies have a return loss greater than 30 dB.
A time delay of 4.030 ns was measured for the WR10 assembly and 3.543 ns for the twisted oversize assembly, shown in Table I. These time delay measurements correspond to phase shifts in corresponding distortionless transmission lines at 94 GHz of −8.2681 × 10⁴ degree and −9.4156 × 10⁴ degree, respectively. The phase shift measurement data for each assembly were then offset by the difference between the phase shift based on the time delay measurement and the measured phase shift at 94 GHz on the vector network analyzer. Thus, the phase shift of each waveguide assembly and its corresponding distortionless transmission line is equal at 94 GHz. Finally, the phase variation was calculated by taking the difference of the adjusted phase shift measurement for the waveguide assembly and the phase shift of the corresponding distortionless transmission line at 93.5 GHz. This process is repeated at 94.5 GHz. For the WR10 assembly, the phase deviation was 287.1° at 93.5 GHz and −285.1° at 94.5 GHz, compared to theoretical deviations of 287.2° and −285.0°, respectively. For the twisted oversize waveguide assembly (including the phase shifts of the hyperbolic cosine transitions), the phase deviations were 135.8° at 93.5 GHz and −138.3° at 94.5 GHz, compared to theoretical 138.45° and −137.5°, respectively.
IV. DISCUSSION
The implementation of the twisted oversize waveguide assembly shows an average increase in incident microwave power of 2.41 dB and 2.35 dB for the pump and observe arms, respectively, at the resonator port relative to the WR10 assembly. These numbers have been validated by power measurements, EPR power saturation results, and vector network analyzer data, shown in Table I. In principle, an oversize waveguide has less dispersion than a WR10 waveguide and this is confirmed by the phase variations over the measured 1 GHz bandwidth. Compared to WR10 waveguide, the twisted oversize guide is closer to an ideal distortionless transmission line because the operating frequency is farther away from cutoff, and therefore has less dispersion.
EPR power saturation data show an increase by a factor of 2.69 at constant microwave power and a factor of 1.34 at constant microwave field. These two results can be directly related to samples at saturable, constant microwave field, and unsaturable, constant microwave power conditions.8 One-way insertion losses compare favorably with simulated results of the oversize assembly of Ref. 1.
Vector network analyzer data were used to compute the averages and standard deviations of the frequency responses of the waveguide assemblies. The averages and standard deviations for the transmission measurements are −0.70 ± 0.02 dB for the straight oversize assembly, −0.78 ± 0.03 dB for the twisted oversize assembly, and −2.88 ± 0.02 dB for the WR10 assembly. The average and standard deviations for the reflection measurements are −42.9 ± 5.2 dB for the straight oversize assembly, −39.5 ± 3.4 dB for the twisted oversize assembly, and −47.8 ± 5.6 dB for the WR10 assembly. At W-band, reflections from misaligned waveguide flanges can be as high as −30 dB, so the measured reflection levels are deemed acceptable. We utilize ALMA flat flanges on the input and output WR10 flanges for precision repeatable placement and to reduce reflections.9,10
As discussed in Ref. 1, the 0.15 dB amplitude variations at a mean comb frequency of 147 MHz over the system bandwidth are caused by very high-Q higher-order modes in the oversize waveguide excited primarily by flange misalignments in the oversize waveguide section. The phase was perturbed relative to the TE10 mode in the oversize waveguide at the minor excitation frequencies of the higher-order modes. The perturbations are on the order of 0.8° for the twisted oversize assembly and 0.6 for the straight oversize assembly. The perturbations cause an average of 0.25 ns in delay variation at the very high-Q higher-order mode frequencies. The delay variations were deemed acceptable. The return EPR signal is minimally affected. The phase variation measurement results confirm the low phase distortion of waveguide operating well above cutoff over a relatively narrow bandwidth.
Although transmission dips are not present in the WR10 assembly, corrugated and quasi-optic approaches easily excite non-optimal higher-order modes that propagate in the waveguide. Overmoded waveguides are highly frequency dependent and may have standing waves that interfere with resonator tuning.11–13 Another concern is the frequency dependence of the transition to the resonator or the system. Transitions to overmoded waveguide are frequency dependent since they require a standing wave to establish the proper propagating mode in the oversize waveguide, such as a TE30 mode. The hyperbolic-cosine taper approach employed here minimizes these concerns by always transitioning back to WR10 waveguide with precision ALMA flat flanges to attach to the resonator and the microwave bridge. Therefore, the only unwanted mode excitation comes from imperfections along the oversize waveguide or at the taper oversize interface, which have been minimized by design. Further reduction of these amplitude and phase variations can be accomplished by fabricating a single waveguide assembly using electro-forming techniques.
In pulsed EPR experiments, it has been shown that distortions to incident pulses caused by the transmission line can be removed by a pre-conditioning filter applied to the generated pulse using an arbitrary waveform generator.14 Additionally, the pre-conditioning filter can be modified to include effects of the resonator and coupling iris. Effects from the coupling iris can be minimized by the use of a long-slot capacitive iris, which has been shown to have similar broadband characteristics to that of the parent waveguide.7 However, the pre-conditioning filter only presents a more ideal excitation to the spin system and it cannot compensate for distortions by the probe on the return EPR signal. In this work, the oversize waveguide and hyperbolic tapers minimize transmission line distortions and allow for a more ideal excitation and signal return path.
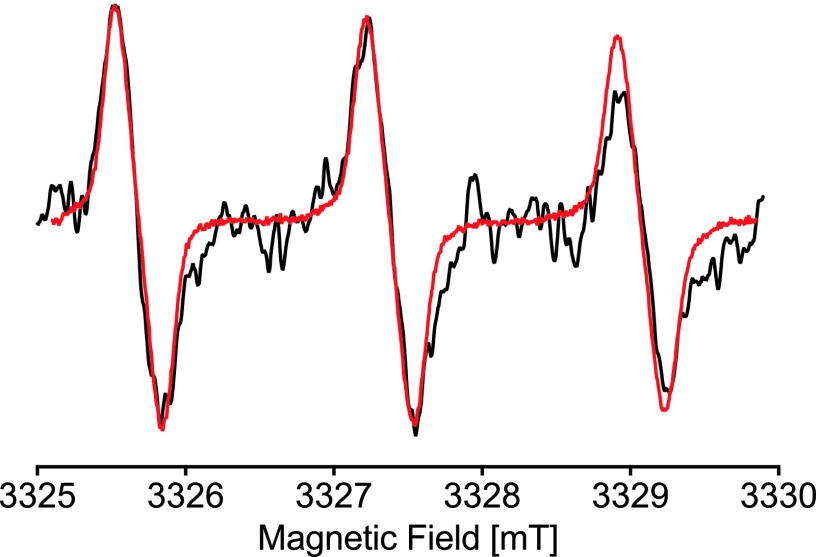
Continuous wave experiments using 1 μM of TEMPO in a 0.15 mm I.D. and 0.25 mm O.D. quartz capillary are shown in Fig. 5. A five-loop–four-gap LGR was used with 433 Hz field modulation at 3 G(p−p), 0.5 mW power, 50 ms time constant, and 128 averages at 120 s per scan. Total scan time was 3 h and 45 min and each scan was 1024 points over 5 mT. Minor tuning and phase corrections were made during the scan. The current five-loop–four-gap LGR has no modulation slots; therefore a low audio frequency must be used for field modulation. Comparison of a previous benchmark is taken from Ref. 5. In this benchmark, a TE011 cavity was used with 100 kHz field modulation at 3 G(p−p), 0.5 mW power, 50 ms time constant, and 128 averages at 20 s per scan. Total scan time was 45 min and each scan was 1024 points over 5 mT. Both experiments were performed in air and amplitudes were normalized. Dramatic increase in signal-to-noise ratio and overall stability is attributed to W-band system upgrades. These upgrades include a custom Gunn-diode oscillator with significant (−30 dB/Hz) reduction in phase noise, delay-line balancing, stable automatic frequency control, water-bath temperature controlled resonator and modulation coils, and the twisted oversize assembly.
FIG. 5.
Comparison of 1 μM concentration of TEMPO from Ref. 5 (black) and the current W-band system with twisted oversize assembly (red).
V. CONCLUSION
Broadband response in high frequency EPR has been an ongoing technical challenge.15 In this work, we presented the use of a twisted oversize waveguide assembly to reduce transmission line losses while minimizing amplitude and phase variations over the operational frequency range of the system. The twisted oversize waveguide assembly increases incident power to the sample and also increases the return EPR signal. Oversize waveguide is distinguished from corrugated waveguide, “overmoded waveguide,” or quasi-optic techniques by maintaining the lowest order mode (TE10) of the parent waveguide. The oversize assembly has shown to be a robust low-loss transmission line for use in broadband EPR spectroscopy.
Acknowledgments
This work was supported by Grant Nos. EB001417 and EB001980 from the National Institute of Biomedical Imaging and Bioengineering of the National Institutes of Health.
REFERENCES
- 1.Mett R. R., Sidabras J. W., Anderson J. R., and Hyde J. S., Rev. Sci. Instrum. 82, 074704 (2011). 10.1063/1.3607432 [DOI] [PMC free article] [PubMed] [Google Scholar]
- 2.Hyde J. S., Strangeway R. A., Camenisch T. G., Ratke J. J., and Froncisz W., J. Magn. Reson. 205, 93 (2010). 10.1016/j.jmr.2010.04.005 [DOI] [PMC free article] [PubMed] [Google Scholar]
- 3.Hyde J. S., Froncisz W., Sidabras J. W., Camenisch T. G., Anderson J. R., and Strangeway R. A., J. Magn. Reson. 185, 259 (2007). 10.1016/j.jmr.2007.01.002 [DOI] [PubMed] [Google Scholar]
- 4.Principles of Pulse Electron Paramagnetic Resonance, edited by Schweiger A. and Jeschke G. (Oxford University Press, 2001). [Google Scholar]
- 5.Sidabras J. W., Mett R. R., Froncisz W., Camenisch T. G., Anderson J. R., and Hyde J. S., Rev. Sci. Instrum. 78, 034701 (2007). 10.1063/1.2709746 [DOI] [PubMed] [Google Scholar]
- 6.Froncisz W., Camenisch T. G., Ratke J. J., Anderson J. R., Subczynski W. K., Strangeway R. A., Sidabras J. W., and Hyde J. S., J. Magn. Reson. 193, 297 (2008). 10.1016/j.jmr.2008.05.008 [DOI] [PMC free article] [PubMed] [Google Scholar]
- 7.Mett R. R., Sidabras J. W., and Hyde J. S., Appl. Magn. Reson. 35, 285 (2009). 10.1007/s00723-008-0162-0 [DOI] [PMC free article] [PubMed] [Google Scholar]
- 8.Hyde J. S. and Froncisz W., “Loop gap resonators,” in Advanced EPR: Applications in Biology and Biochemistry (Elsevier, Amsterdam, 1989), Chap. 7. [Google Scholar]
- 9.Kerr A., Wollack E., and Horner N., “Waveguide flanges for ALMA instrumentation,” Technical Report ALMA MEMO 278 (National Radio Astronomy Observatory, Charlottesville, VA,1999). [Google Scholar]
- 10.Kerr A. R., Kozul L., and Marshall A. A., “Recommendations for flat and anti-cocking waveguide flanges,” Technical Report ALMA MEMO 444 (National Radio Astronomy Observatory, Charlottesville, VA, 2003). [Google Scholar]
- 11.Rohrer M., Brügmann O., Kinzer B., and Prisner T., Appl. Magn. Reson. 21, 257 (2001). 10.1007/BF03162406 [DOI] [Google Scholar]
- 12.Hofbauer W., Earle K. A., Dunnam C. R., Moscicki J. K., and Freed J. H., Rev. Sci. Instrum. 75, 1194 (2004). 10.1063/1.1710700 [DOI] [Google Scholar]
- 13.Reijerse E. J., Appl. Magn. Reson. 37, 795 (2010). 10.1007/s00723-009-0070-y [DOI] [Google Scholar]
- 14.Doll A. and Jeschke G., J. Magn. Res. 246, 18 (2014). 10.1016/j.jmr.2014.06.016 [DOI] [PubMed] [Google Scholar]
- 15.Very High Frequency (VHF) ESR/EPR, edited by Grinberg O. Y. and Berliner L. J. (Springer Press, 2004). [Google Scholar]


