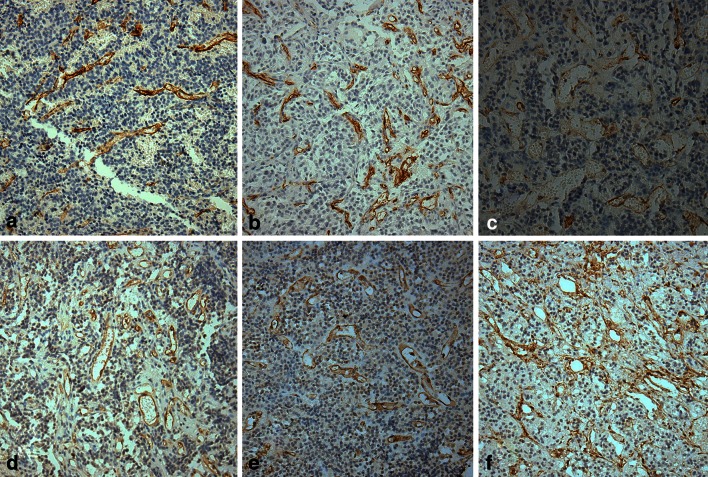
Fig. 5.
Tissues from representative IRS-TC = 12 (a, d) and IRS-TC = 1 (b, e) pituitary adenomas and from a normal pituitary gland(c, f) for CD34 (a–c) and CD105 (d–f) immunostaining. MVDs in panels a and d are not more noticeable than those in b and e, whereas those in the normal pituitary gland are the most pronounced in panels c and f. Magnification, ×200

