Abstract
White adipose tissue inflammation (WATi) has been linked to the pathogenesis of obesity-related diseases, including type 2 diabetes, cardiovascular disease, and cancer. In addition to the obese, a substantial number of normal and overweight individuals harbor WATi, putting them at increased risk for disease. We report the first technique that has the potential to detect WATi noninvasively. Here, we used Raman spectroscopy to detect WATi with excellent accuracy in both murine and human tissues. This is a potentially significant advance over current histopathological techniques for the detection of WATi, which rely on tissue excision and, therefore, are not practical for assessing disease risk in the absence of other identifying factors. Importantly, we show that noninvasive Raman spectroscopy can diagnose WATi in mice. Taken together, these results demonstrate the potential of Raman spectroscopy to provide objective risk assessment for future cardiometabolic complications in both normal weight and overweight/obese individuals.
Graphical Abstract
White adipose tissue inflammation (WATi) is believed to play a causal role in a wide array of diseases, including type 2 diabetes mellitus, atherosclerosis, and certain cancers.1–4 As such, it is imperative to identify those subjects who harbor this chronic, low-grade inflammation prior to the development of disease. While WATi is common in the obese, it is recognized that as many as 30% of phenotypically obese individuals may be metabolically healthy,5–8 while significant metabolic abnormalities occur in others despite having a normal body mass index (BMI).9,10 Hence, precisely defining the population most likely to benefit from targeted intervention(s) to reverse WATi is a challenge and requires a more sophisticated assessment than BMI alone.
A histologic hallmark of WATi is the crownlike structure (CLS), defined as a dead or dying adipocyte surrounded by macrophages.11 This pathologic feature, which can be quantified by light microscopy, has been shown to correlate with increased levels of inflammatory mediators, as well as clinical parameters associated with metabolic syndrome.12 Importantly, the presence of CLS has also been associated with cardiometabolic disease13,14 and has been suggested to play a role in the development and progression of cancer.15 Assessment of CLS burden, which can identify those patients with WATi, is currently performed using a fat biopsy, which is invasive and thus, is not routinely performed. Effective and practical means to identify those individuals harboring WATi are urgently needed to stratify patients and subsequently develop therapeutic strategies.
A noninvasive detection modality for WATi would define those individuals likely to benefit from intervention(s) and could also be used to monitor efficacy of therapy. For this purpose, sensitive spectroscopic characterization based on endogenous contrast mechanisms offers a powerful tool. Detection strategies currently under investigation, such as positron emission tomography (PET) and magnetic resonance imaging, require the administration of exogenous contrast agents, involve exposure to high-dose radiation (PET), and have not been rigorously tested in humans.16,17 Currently, no analytical method exists to reproduce or exceed histopathological capabilities. To this end, we investigate the ability of Raman spectroscopy to detect WATi and show its diagnostic ability in diverse tissue specimens both ex vivo and in vivo.18
Raman spectroscopy is particularly amenable to in vivo measurements as the powers and excitation wavelengths used are nondestructive to tissue.19 As such, it has been successfully applied to the diagnosis of several pathologies.20–23 Furthermore, Raman spectroscopy is well-suited to monitor WATi, as it is particularly sensitive to adipose tissue and lipids typically exhibit large Raman scattering cross sections, relative to other biological molecules.24 Lipid alterations are known to occur in association with obesity-related adipocyte hypertrophy, which correlates with WATi.25,26
To interrogate the efficacy of Raman spectroscopy for the detection of WATi, we examined three different mouse models known to exhibit inflammation. In these mouse models, Raman spectroscopy detected inflammation with high sensitivities and specificities, which may be based, in part, on a biochemical signature (fatty acid saturation) that is consistent with the known pathobiology of adipose inflammation. CLS burden, as defined by light microscopy, was used as the gold standard for diagnosis of WATi. Next, we show that Raman spectroscopy can accurately detect WATi in ex vivo samples of human adipose tissues from obese, overweight, and normal BMI women. Importantly, we also show that, in a standard mouse model of obesity, transcutaneous acquisition of Raman spectra can accurately detect WATi. Taken together, these results demonstrate that Raman spectroscopy can accurately detect WATi, which has been linked to cardiometabolic disease and possibly cancer. Hence, Raman spectroscopy-based detection of WATi could prove useful for both assessing an individual’s risk of future cardiometabolic complications and monitoring the efficacy of interventions aimed at attenuating WATi.
EXPERIMENTAL SECTION
Animal Studies
Mice were housed in a pathogen-free environment at Weill Cornell Medical College (WCMC) and used in accordance with protocols approved by the Institutional Animal Care and Utilization Committee at WCMC. Following sacrifice, epididymal and mammary WAT were either immediately interrogated with Raman spectroscopy or snap-frozen in liquid nitrogen, stored at −80 °C and then passively thawed at room temperature (fresh/frozen). In the transcutaneous study, at 6 weeks of age, male C57BL/6J mice (Jackson Laboratories) were randomized (n = 5/group) to receive either a low fat diet (LFD) or high fat diet (HFD) ad libitum for 12 weeks before being sacrificed. Immediately after sacrifice, fur was removed above the mammary gland and Raman spectra were acquired transcutaneously and then again on the explanted mammary gland. Animal models are described in depth in the Supporting Information.
Human Studies
The study was approved by the Institutional Review Boards of Memorial Sloan Kettering Cancer Center (MSKCC) and WCMC. Women undergoing mastectomy with or without immediate reconstructive surgery for the treatment of breast cancer at MSKCC provided informed consent, allowing tissue specimens to be obtained under a standard tissue acquisition protocol. Patients undergoing a lumpectomy were excluded, to ensure adequate tissue for the planned studies. For each patient, adipose tissue was snap-frozen in the operating suite and five paraffin blocks were also prepared from formalin-fixed tissue. Samples were examined for the presence of CLS using established methods.27
Instrumentation and Data Analysis
Data were acquired using the clinical Raman instrument and Raman fiber optic probe, which have been described previously.28,29 In short, light from an 830 nm diode laser (Process Instruments, Salt Lake City, UT) is collimated and then bandpass-filtered (Kaiser Optical Systems, Inc., Ann Arbor, MI) before being focused into the excitation fiber of the Raman probe. The 4-m-long probe is <2 mm in diameter and consists of a single central excitation fiber surrounded by 15 collection fibers. The distal end of the probe is registered with a dual-filter module that rejects the intense interfering signals generated in the fibers. The probe is terminated with a sapphire ball lens, which collimated the excitation light and efficiently gathers and couples the Raman scattered light from the tissue into the collection fibers. For all experiments, the probe was placed in gentle contact with the tissue and ~100 mW of excitation light was used to interrogate the tissue. For mice, which have a higher CLS burden than humans, Raman spectra were collected from three unique locations per sample with an acquisition time of 2 s per frame and 25 frames. For humans, who have a lower CLS burden than mice, Raman spectra were collected from 9 unique locations per sample with an acquisition time of 2 s. per frame and 25 frames. Several spectra were acquired from each subject to optimize the probability of data collection from focal regions of inflammation. The number of spectra necessary for accurate diagnosis was determined experimentally using tissues of known inflammatory status. Diagnoses for each subject were obtained from the diagnosis of the majority of the spectra. Sensitivity and specificity are reported both on a per subject basis and a per spectrum basis.
All data processing was performed in Matlab as described previously30 and detailed in the Supporting Information. In short, following calibration, the dataset was normalized to the 1445 cm−1 peak height to remove any possible intensity biases and mean centered before performing principal component analysis (PCA). SVM was used on the PC scores as the input variables. The accuracy of the developed decision algorithm was validated using a traditional leave-one-out cross-validation technique.31 To further validate the results, a control study was done where the sample classes “inflamed” and “non-inflamed” were randomly assigned, irrespective of their true pathological class label and PCA performed as described above. One hundred (100) iterations were carried out per dataset. Reported sensitivities and specificities are the average of the 100 analyses.
RESULTS AND DISCUSSION
Detection of WATi in Epididymal Fat from a Mouse Model of Dietary-Induced Obesity
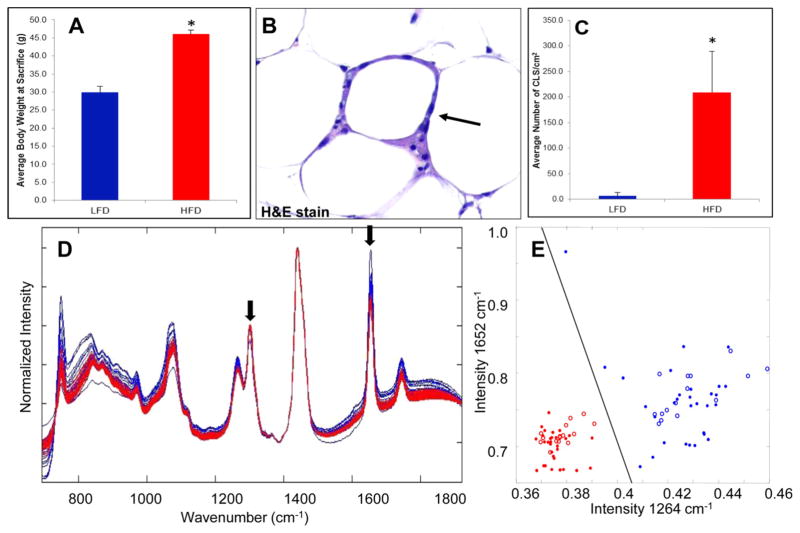
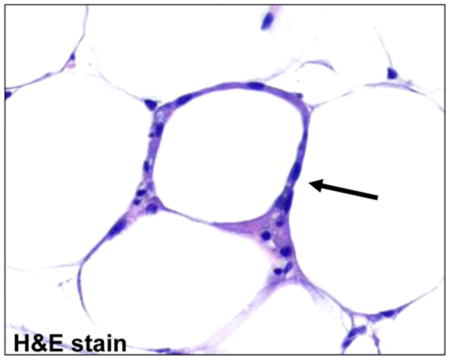
We first assessed the ability of Raman spectroscopy to detect WATi in ex vivo epididymal (visceral) adipose tissue from a standard mouse model of obesity in which male mice were fed a high fat diet (HFD) to induce WATi. Figure 1A shows the expected trend in the average body weights of mice on the low fat diet (LFD) and HFD at the time of sacrifice. Figure 1B displays an example of a CLS, an inflammatory focus comprised of macrophages surrounding a dead or dying adipocyte, in WAT from a mouse fed the HFD. The average number of epididymal fat CLS/cm2 in each group of mice is also shown (Figure 1C). As expected, mice on the HFD have a significantly higher CLS burden, indicative of WATi, than mice on the LFD. In this study, CLS burden is used as the gold standard for diagnosis of WATi. Raman spectra were acquired from 10 mice on the HFD and 10 mice on the LFD. Three spectra, taken from unique locations in the epididymal fat pad, were acquired per animal. We note that tissues from this animal model either exhibit frank inflammation or are not inflamed. Raman spectra from inflamed (red) and noninflamed (blue) WAT are shown in Figure 1D. Data were normalized to the 1445 cm−1 peak height, attributed to C–H bending motions, to remove any possible intensity biases.32 Spectral features are consistent with previously published Raman spectra of adipose tissue.24 Clear differences in the spectra of inflamed and noninflamed WAT can be seen, particularly in the intensity of the Raman peaks at 1264 and 1652 cm−1 (see arrowed features in Figure 1D). The 1264 cm−1 Raman peak results from =C–H in plane bending motions while the 1652 cm−1 can be assigned to C=C stretching.33,34 A diagnostic scatter plot was created based on the peak heights of the 1264 and 1652 cm−1 bands (Figure 1E). Inflamed and noninflamed samples can be separated based on the intensity of these two Raman peaks with 100% sensitivity (30/30 spectra) and 100% specificity (30/30 spectra).
Figure 1.
Raman spectroscopy detects WATi in epididymal fat from a mouse model of diet-induced obesity with perfect accuracy. (A) Average body weights of mice on the LFD (noninflamed) and HFD (inflamed) at the time of sacrifice (n = 10/group). (Asterisk (*) denotes P < 0.001.) (B) A CLS in WAT from a mouse on the HFD stained with H&E. (C) Average number of CLS/cm2 in mice on the LFD and HFD. (Asterisk (*) denotes P < 0.001.) (D) Raman spectra from inflamed (red, HFD) and noninflamed (blue, LFD) epididymal WAT. Clear differences in the spectra of inflamed and noninflamed WAT can be seen, particularly in the intensity of the Raman peaks at 1264 and 1652 cm−1 (see arrowed features). (E) Diagnostic scatter plots based on the peak heights of the 1264 and 1652 cm−1, which can separate inflamed (red) from noninflamed (blue) WAT with 100% accuracy (data shown as closed circles). Data were also collected in a blinded prospective manner from contralateral epididymal fat from the same mice (n = 5/group) and diagnoses were provided based on the intensity of the 1264 and 1652 cm−1 Raman peaks. Using the algorithm in a prospective manner, Raman spectroscopy could correctly identify the inflammatory state of all 10 mice examined. These data are shown as red and blue open circles on the diagnostic scatter plot in panel (E).
The 1264 and 1652 cm−1 Raman peaks are known to reflect the degree of fatty acid saturation, with lower intensities indicating increased saturation.34,35 A variety of lipid changes occur with obesity.25,26,36,37 A decrease in n-3 and n-6 polyunsaturated fatty acids has been observed in hypertrophic adipocytes, which is a feature of obesity.25 Consistent with this paradigm, the Raman spectra acquired from inflamed adipose of obese mice exhibit reduced intensities in the 1264 and 1652 cm−1 Raman peaks, possibly indicative of an increase in fatty acid saturation. Here, simple univariate analysis of the Raman features of interest is found to be sufficient in isolating the expression of a biochemical marker that indicates changes in the composition of the adipose tissue. This biochemical signature provides a basis for devising a diagnostic algorithm that is likely rooted in the known pathobiology of adipose inflammation.
To test the reproducibility of our diagnostic algorithm for the detection of WATi, we acquired Raman measurements from the contralateral epididymal fat pad that had not been used to create the diagnostic algorithm. Data were acquired from 5 mice on the HFD and 5 mice on the LFD in a blinded fashion. The number of CLS/cm2 in the epididymal fat were comparable on both the right and left sides. Sample identity was recorded with a deidentifying code and tissue pathology was unknown during data collection, analysis and Raman based diagnosis. Data are shown as open red and blue circles on the scatter plot in Figure 1E. Using only the intensity information on the 1264 and 1652 cm−1 Raman peaks, we correctly identified the inflammatory state of all 10 mice examined in a blinded prospective manner.
We also investigated the effects of tissue freeze–thaw on our ability to detect WATi using Raman spectroscopy, as initial studies relied on the use of freshly thawed snap-frozen tissues (fresh/frozen) rather than freshly excised adipose specimens. Male mice on the HFD and LFD were sacrificed and epididymal fat removed. Raman spectra were acquired from freshly excised tissues. The tissues were then snap frozen, stored at −80 °C, and then, 2 days later, passively thawed and re-examined. Consistent with previous studies showing that Raman spectra are largely unaffected by tissue freeze–thaw,38 minimal differences were observed between the Raman spectra of fresh and fresh/frozen adipose tissues and we were able to obtain identical diagnostic accuracy using data acquired from either tissue set. Data support the use of fresh/frozen tissues and the straightforward translation of results obtained with them to freshly excised specimens.
Detection of WATi in Epididymal Fat from a Mouse Model of Genetically Induced Obesity
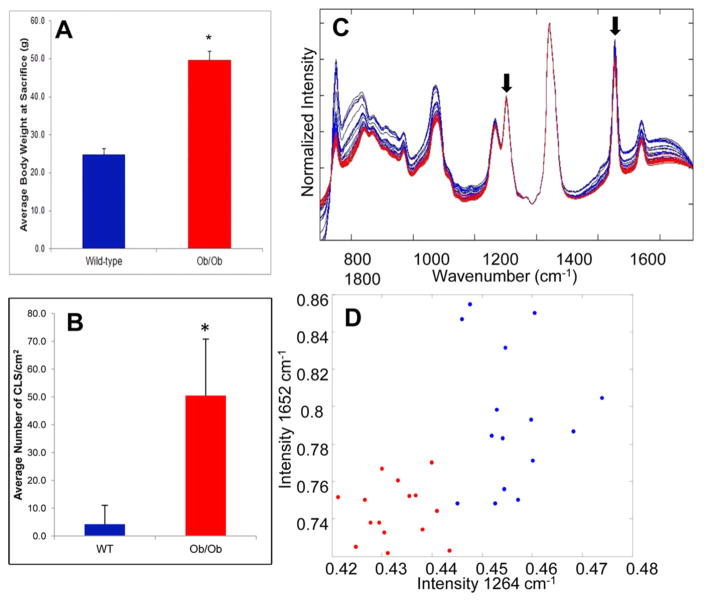
To determine if the differences in the Raman spectra seen in the diet-induced obesity mouse model were due to WATi or differences in the composition of the diets, we utilized a genetic model of obesity in which WATi occurs in mice that have been fed a standard diet. Raman spectra were acquired from ex vivo fresh/frozen epididymal adipose tissues from wild type and ob/ob mice maintained on standard chow. The ob/ob mouse becomes profoundly obese and inflamed resulting from hyperphagia secondary to leptin deficiency.39,40 Figure 2A shows the expected trend in the average body weights of wild-type and ob/ob mice. The average number of CLS/cm2 in each group of mice is also shown (Figure 2B). As expected, ob/ob mice have a significantly higher CLS burden than their wild-type counterparts, which is indicative of WATi. Raman spectra were acquired from 5 wild type mice and 5 ob/ob mice. Raman spectra from inflamed (red) and noninflamed (blue) epididymal WAT are shown in Figure 2C. Key differences seen in the data acquired from a murine model in which WATi is induced via diet (Figure 1) are recapitulated in the spectra acquired from a murine model in which WATi is induced in a genetic model of obesity (see arrowed features in Figure 2C). Again, a diagnostic scatter plot was created based on the peak heights of the 1264 and 1652 cm−1 bands (Figure 2D). Inflamed and noninflamed samples can be separated based on the intensity of these two Raman peaks with 100% sensitivity (15/15 spectra) and 100% specificity (15/15 spectra).
Figure 2.
Raman spectroscopy detects WATi in epididymal fat from a mouse model of genetically induced obesity with perfect accuracy. (A) Average body weights of wild type (noninflamed) and ob/ob (inflamed) mice (n = 5/group), and (B) average number of CLS/cm2 in each group of mice. (In panels (A) and (B), the asterisk (*) denotes P < 0.001.) (C) Raman spectra from inflamed (red, ob/ob) and noninflamed (blue, wild type) epididymal WAT. (D) Diagnostic scatter plot based on the peak heights of the 1264 and 1652 cm−1 bands, separating inflamed (red) from noninflamed (blue) murine WAT with 100% accuracy.
Detection of WATi in Mammary Tissue from a Mouse Model of Postmenopausal Dietary-Induced Obesity
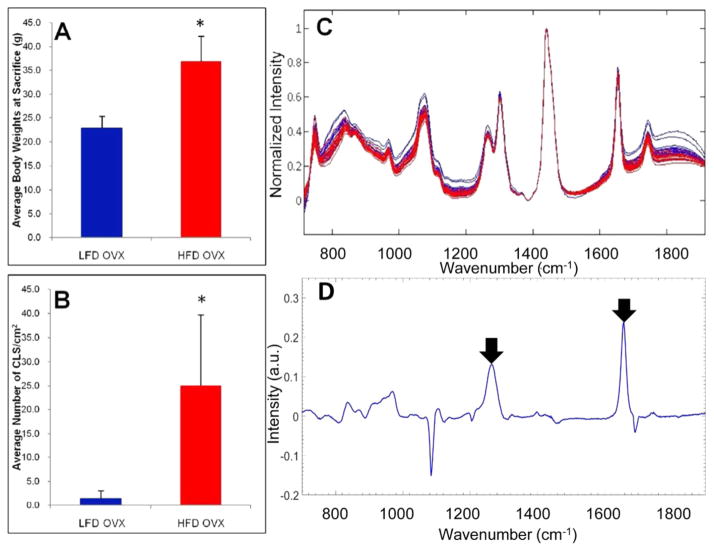
Given the potential importance of WATi in the pathogenesis of breast cancer,15 we next utilized an established model of mammary WATi.41 We anticipated differences in the Raman spectra acquired from the mammary and epididymal fat depots, as the mammary gland contains epithelium. Furthermore, the mammary gland is less inflamed than visceral fat depots, with its inflammatory burden being similar to that of subcutaneous fat. The ovaries, presumably via estrogen, suppress diet-induced weight gain and WATi in the mammary gland.41,42 Raman spectra of mammary tissues were acquired from mice that were ovariectomized at 4 weeks of age and then fed the HFD or LFD. Figure 3A shows the expected trends in the average body weights of mice on the LFD and HFD at the time of sacrifice. Figure 3B shows the average number of CLS/cm2 in each group of mice. Mice on the HFD have a significantly higher CLS burden, indicative of WATi, than mice on the LFD. Raman spectra were acquired from fresh/frozen mammary glands from 6 mice on the HFD and 6 mice on the LFD. Figure 3C shows Raman spectra acquired from mammary WAT of mice on the HFD (inflamed, red) and the LFD (noninflamed, blue).
Figure 3.
Raman spectroscopy detects WATi in mammary tissue from a mouse model of post-menopausal diet-induced obesity with high accuracy. (A) Average body weights of ovariectomized LFD (noninflamed) and ovariectomized HFD (inflamed) female mice (n = 10/group), and (B) average number of CLS/cm2 in each group of mice. (In panels (A) and (B), the asterisk (*) denotes P < 0.001.) (C) Raman spectra from inflamed (red, HFD) and noninflamed (blue, LFD) mammary WAT. (D) PC5, which is a diagnostic principal component (PC), contains Raman peaks at 1264 and 1652 cm−1, which are also found to be diagnostic in other datasets (see arrowed features).
The ratio of the two Raman peaks (1264 and 1652 cm−1), found to correlate with inflammation in studies of epididymal fat, was insufficient to distinguish between inflamed and noninflamed murine mammary tissues. This difference between the male and female murine datasets is likely due to the utilization of the mammary fat depot (female mice), rather than the epididymal fat depot (male mice). Consequently, we employed a multivariate statistical method of analysis called principal component analysis (PCA) to examine spectral trends correlating with WATi.
PCA exploits the multivariate nature of the Raman spectrum and resolves the spectral dataset into a few orthogonal principal components (PCs).43 These PCs form a basis set that accurately describes all of the data (within limitations imposed by noise). Although PCA provides little physical information in and of itself, it is adept at isolating spectral trends that correlate with biochemical information and thereby provides a basis for diagnostic algorithm development. Next, we used support vector machines (SVM), an emerging discriminate analysis method, to generate a diagnostic algorithm based on the PCs.44,45 In this analysis, the selection of PCs in the SVM-derived decision algorithm was determined by the net variance threshold (99.9%), as well as by the minimization of error in cross-validation (and therefore the highest diagnostic utility). A leave-one-out cross-validation (LOOCV) analysis was used to obtain a robust diagnostic algorithm.
Raman spectra of inflamed and noninflamed mammary glands could be distinguished using PCA. Four PCs were found to be optimal for use in building the SVM decision algorithm. All four diagnostic PCs are shown in Figure S-1 in the Supporting Information. Using this decision algorithm in a LOOCV analysis, we obtained a per-subject sensitivity of 100% (6/6 mice) and specificity of 83.3% (5/6 mice). On a per spectrum basis, a sensitivity of 100% (18/18 spectra) and specificity of 77.8% (14/18 spectra) was obtained. The increase in misdiagnoses is not wholly unexpected, as the mammary gland is less inflamed than epididymal fat depots. Diagnostic PC5 utilized features at 1264 and 1652 cm−1, recapitulating those used for the detection of WATi in male mice (see arrowed features in Figure 3D). However, several additional, presently unidentified, Raman features were also necessary for diagnosis of WATi in mammary glands from female mice. It is worth noting that the PCs providing the highest discrimination accuracy were chosen for this model (and for similar models in the ensuing experimental investigations), rather than the PCs that directly account for the highest variance in the spectral dataset. This is consistent with previous reports in the literature, which have discussed that the parameters that contribute most to the fit of spectroscopic data to a model may not be the parameters with the most diagnostic utility.
Detection of WATi in Human Abdominal Subcutaneous Adipose Tissue
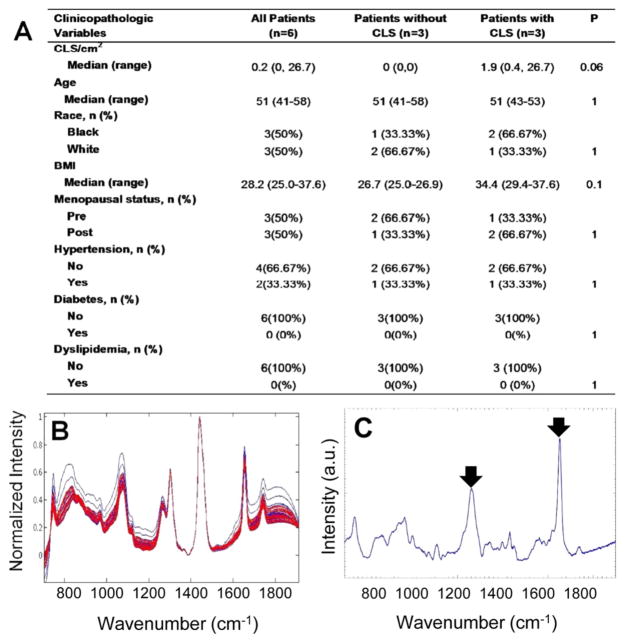
Based on the excellent results obtained in the mouse models, we next examined human tissues. Raman spectra were acquired from ex vivo fresh/frozen human abdominal subcutaneous adipose tissue from six overweight and obese women with varying CLS burdens. The demographics of the women examined are shown in Figure 4A. Because human adipose tissues have a substantially lower CLS burden than murine adipose, we increased our data collection from three unique locations to nine unique locations per sample, to enhance the probability of acquiring data near focal sites of inflammation. Raman spectra from inflamed (red) and noninflamed (blue) human subcutaneous WAT are shown in Figure 4B. The Raman spectra of subcutaneous adipose tissue from women exhibited features similar to those found in the Raman spectra of murine adipose tissue, indicative of conserved similarities between the Raman signatures of adipose tissue from the two species.
Figure 4.
Raman spectroscopy detects WATi in human abdominal subcutaneous adipose tissue with high accuracy. (A) Demographics and inflammatory status of the 6 subjects whose subcutaneous adipose tissues were interrogated with Raman spectroscopy. (B) Raman spectra from inflamed (red) and noninflamed (blue) human subcutaneous WAT. (C) PC5, which is a diagnostic principal component (PC), contains Raman peaks at 1264 and 1652 cm−1, which are found to be diagnostic in other observations (see arrowed features).
Differences between the Raman spectra of inflamed and noninflamed women were not as readily evident as trends seen in the mouse models and a simple algorithm based on the 1264 and 1652 cm−1 Raman peaks was insufficient to separate inflamed and noninflamed subjects. This is not surprising, as genetics and diet cannot be as readily controlled in human subjects as they are in mice. Furthermore, given the lower CLS burdens of the human WAT, the expected differences in the spectral patterns are more subtle. Consequently, we once again employed PCA to examine spectral trends correlating with WATi in the human samples.
Using PCA and SVM to develop the decision algorithm and a LOOCV to test its performance, we find that each human subject can be diagnosed as inflamed or noninflamed with 100% accuracy using 4 PCs. All 4 diagnostic PCs are shown in Figure S-2 in the Supporting Information. Subjects were given a diagnosis consistent with the diagnosis rendered for the majority of the spectra acquired from their tissue. On a per spectrum basis, a sensitivity of 81.5% (22/27 spectra) and a specificity of 100% (27/27 spectra) was obtained. The spectra that were misclassified belonged to subjects with a CLS burden of 0.4 and 1.86 CLS/cm2, whereas all spectra from the subject with a substantially higher CLS burden of 26.7 CLS/cm2 were correctly diagnosed. Thus, the misclassification is not wholly unexpected, given the substantially lower inflammation in the aforementioned two subjects. Importantly, the spectral misclassifications are not clinically significant in the context of detection of WATi, as the overall assessment that these subjects harbor WATi was correct.
To ensure that the diagnosis is based on inflammation, we performed prediction on Raman data with randomized labels (irrespective of their pathological origins) as a form of negative control. When the data are randomized, a sensitivity of 38.5% and a specificity of 34.8% are obtained, indicating that there is almost no prediction capability. This reinforces that our predictions are based on nonspurious factors (i.e., inflammation). Further evidence that the PCA diagnosis is based on WATi comes from examination of the diagnostic PCs. Analysis of the diagnostic PCs for human adipose tissue shows that some of the same features used to separate adipose tissue from inflamed and noninflamed mice were also used to differentiate inflamed and noninflamed adipose tissue from humans. The Raman peaks at 1264 and 1652 cm−1, which are possibly indicative of fatty acid saturation, can clearly be seen in diagnostic PC5 (see arrowed features in Figure 4C). Furthermore, the PCA results recapitulate the findings in mice that inflamed tissues exhibit reduced intensities in 1264 and 1652 cm−1 Raman peaks, likely indicating an increase in fatty acid saturation. In addition to the 1264 and 1652 cm−1 bands, a large number of other Raman peaks were necessary for the diagnosis of WATi in human subcutaneous adipose tissue.
Detection of WATi in Human Breast WAT from Normal BMI Subjects
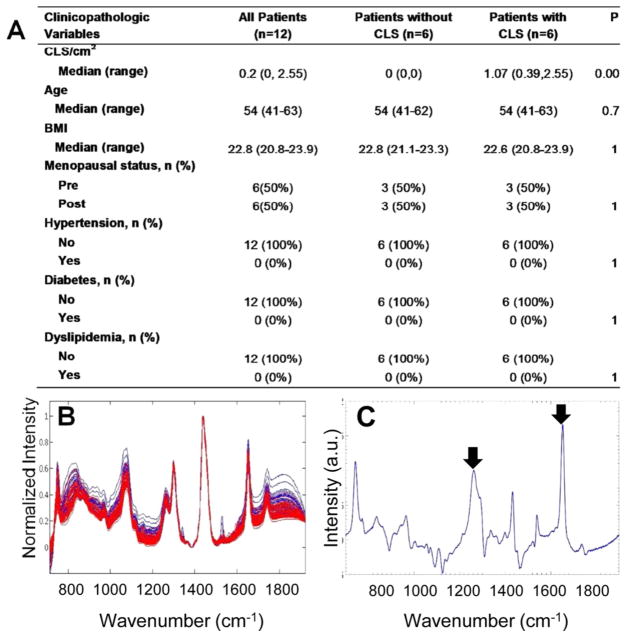
It is increasingly recognized that WATi occurs in a significant subset of normal BMI women.9,10,46 Although these women have a normal BMI, the presence of WATi may increase their risk of chronic disease. To examine WATi in the absence of obesity, Raman spectra were acquired from ex vivo fresh/frozen nontumorous human breast tissue from 12 normal BMI women with varying CLS burdens who underwent mastectomy for the treatment of breast cancer. The demographics of the women examined are shown in Figure 5A. Again, differences between the Raman spectra acquired from inflamed and noninflamed mammary tissue of the normal BMI female subjects (Figure 5B) were not as readily evident as differences between inflamed and noninflamed mice. Nonetheless, each human subject could be diagnosed as inflamed or noninflamed with 100% accuracy using 4 PCs. The diagnostic PCs are shown in Figure S-3 in the Supporting Information. On a per spectrum basis, a sensitivity of 100% (54/54 spectra) and a specificity of 100% (54/54 spectra) was obtained. Even though the ratio of the important Raman features indicative of fatty acid saturation was insufficient for diagnostic purposes, visualization of diagnostic PC6 clearly shows the presence of features at 1264 and 1652 cm−1 that are correlated with noninflamed samples (see arrowed features in Figure 5C). Again, several additional, presently unidentified, Raman features were necessary for the diagnosis of WATi in human breast tissue.
Figure 5.
Raman spectroscopy detects WATi in human breast tissue from normal BMI subjects with perfect accuracy. (A) Demographics and inflammatory status of the 12 subjects whose breast adipose tissues were interrogated with Raman spectroscopy. (B) Raman spectra from inflamed (red) and noninflamed (blue) human mammary WAT. (C) PC6, which is a diagnostic PC, contains Raman peaks at 1264 and 1652 cm−1, which are found to be diagnostic in all our datasets (see arrowed features).
Transcutaneous Detection of WATi in Mammary Tissue from a Mouse Model of Obesity
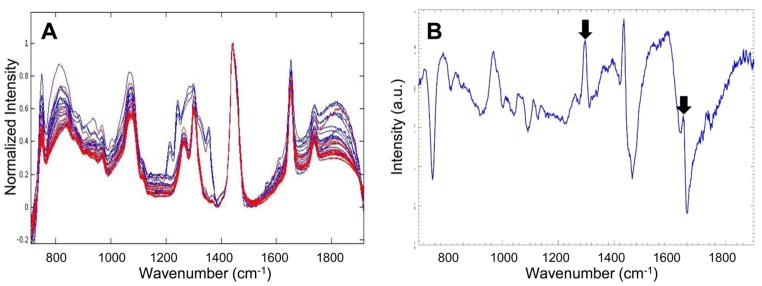
To assess the ability of Raman spectroscopy to probe WATi noninvasively, we acquired transcutaneous data from the mammary gland in a male mouse model of diet-induced obesity. Transcutaneous Raman spectra were acquired from 5 inflamed (red, HFD) and 5 noninflamed (blue, LFD) mice (Figure 6A). Features of adipose tissue can clearly be seen in the transcutaneous spectra. Contributions of murine epidermis to the spectra, such as features of collagen, can be seen in the 1240–1300 cm−1 region and are particularly evident in data acquired from lean mice.24 Mammary adipose tissue from noninflamed mice can be distinguished from mammary adipose tissue from inflamed mice transcutaneously with 80% sensitivity (4/5 mice) and 80% specificity (4/5 mice) using 4 PCs. On a per spectrum basis, a sensitivity of 80% (12/15 spectra) and a specificity of 80% (12/15 spectra) was obtained.
Figure 6.
Noninvasive Raman spectroscopy accurately detects WATi in a mouse model of obesity. (A) Transcutaneous Raman spectra from inflamed (red) and noninflamed (blue) murine mammary WAT (n = 5/group). (B) Diagnostic PC highlighting Raman peaks at 1264 and 1652 cm−1 (see arrowed features), which were found to be diagnostic in all other datasets.
The robustness of the PCA-derived decision algorithm was tested using a negative control study where arbitrary labels were assigned to the spectral data, regardless of their true pathological origins. In this case, a sensitivity of 29.3% and a specificity of 31.5% were obtained, indicating that there is almost no prediction capability. The low sensitivity and specificity in the control study confirms that the algorithm is not influenced by spurious and chance correlations. Further evidence that the PCA diagnosis is based on WATi and not spurious factors comes from examination of the diagnostic PCs. Analysis of the diagnostic PCs showed that the peaks at 1264 and 1652 cm−1 (shown to be diagnostic in all other datasets) were also key diagnostic components in this experiment. A single diagnostic PC exhibiting the 1264 and 1652 cm−1 peaks is shown in Figure 6B. The data demonstrate that Raman spectroscopy can be used for the segmentation of inflamed and noninflamed WAT in a standard mouse model of obesity—even when the spectroscopic measurements are performed noninvasively.
CONCLUSIONS
We have demonstrated the ability of Raman spectroscopy to detect white adipose tissue inflammation (WATi) with high sensitivities and specificities in both mouse models of obesity and human tissues. These diagnoses are likely based, in part, on changes in fatty acid saturation that occur in association with adipocyte hypertrophy, which is a known correlate of WATi.11,25,27 Raman spectra are rich in information content and the principal components (PCs) contain many diagnostic peaks, in addition to those reflecting fatty acid saturation. Future studies will investigate other species that contribute to Raman spectroscopic diagnosis of WATi to provide insight into the onset and progression of WATi. In mouse models, the diagnosis of WATi could be made noninvasively. These excellent ex vivo results are a critical milestone in translation toward noninvasive data acquisition in clinical settings. If future studies are successful, Raman spectroscopy could be used to provide disease risk assessment in subjects varying in body mass index (BMI). The technique may also provide a novel and much-needed tool for assessing the efficacy of therapeutic interventions (behavioral, dietary, pharmacological) aimed at attenuating WATi and subsequent disease.
Supplementary Material
Acknowledgments
This work was supported by National Institutes of Health (NIH) (NIH Grant No. UL1TR000457 of the Clinical and Translational Science Center at Weill Cornell Medical College, NIH Grant No. 5RO1 HL093324-07, NIH Grant No. 5P41EB015871-28 of the Laser Biomedical Research Center at the Massachusetts Institute of Technology), as well as the National Center for Advancing Translational Sciences (NCATS) (Grant No. UL1TR000043), the NIH Clinical and Translations Science Award (CTSA) Program at Rockefeller University, and cosponsored by the Center for Basic and Translational Research on Disorders of the Digestive System at Rockefeller University through the generosity of Leona M. and Harry B. Helmsley Charitable Trust, the Sackler Center for Biomedicine and Nutrition through the generosity of the Sackler Foundation, the Botwinick–Wolfensohn Foundation (in memory of Mr. and Mrs. Benjamin Botwinick), and the Breast Cancer Research Foundation.
Footnotes
Notes
The authors declare no competing financial interest.
The Supporting Information is available free of charge on the ACS Publications website at DOI: 10.1021/acs.anal-chem. 5b03696.
Diagnostic principal components (PDF)
Description of animal models, light microscopy and immunohistochemistry, human studies, human abdominal subcutaneous adipose tissue, human breast adipose tissue, and data analysis (PDF)
References
- 1.Hotamisligil GS. Nature. 2006;444:860–867. doi: 10.1038/nature05485. [DOI] [PubMed] [Google Scholar]
- 2.Olefsky JM, Glass CK. Annu Rev Physiol. 2010;72:219–246. doi: 10.1146/annurev-physiol-021909-135846. [DOI] [PubMed] [Google Scholar]
- 3.Lumeng CN, Saltiel AR. J Clin Invest. 2011;121:2111–2117. doi: 10.1172/JCI57132. [DOI] [PMC free article] [PubMed] [Google Scholar]
- 4.Park J, Euhus DM, Scherer PE. Endocr Rev. 2011;32:550–570. doi: 10.1210/er.2010-0030. [DOI] [PMC free article] [PubMed] [Google Scholar]
- 5.Kloting N, Fasshauer M, Dietrich A, Kovacs P, Schon MR, Kern M, Stumvoll M, Bluher M. Am J Physiol Endocrinol Metab. 2010;299:E506–515. doi: 10.1152/ajpendo.00586.2009. [DOI] [PubMed] [Google Scholar]
- 6.Xu XJ, Gauthier MS, Hess DT, Apovian CM, Cacicedo JM, Gokce N, Farb M, Valentine RJ, Ruderman NB. J Lipid Res. 2012;53:792–801. doi: 10.1194/jlr.P022905. [DOI] [PMC free article] [PubMed] [Google Scholar]
- 7.Denis GV, Obin MS. Mol Aspects Med. 2013;34:59–70. doi: 10.1016/j.mam.2012.10.004. [DOI] [PMC free article] [PubMed] [Google Scholar]
- 8.Bluher S, Schwarz P. Metab, Clin Exp. 2014;63:1084–1092. doi: 10.1016/j.metabol.2014.06.009. [DOI] [PubMed] [Google Scholar]
- 9.Chen S, Chen Y, Liu X, Li M, Wu B, Li Y, Liang Y, Shao X, Holthofer H, Zou H. Endocrine. 2014;46:496–504. doi: 10.1007/s12020-013-0079-8. [DOI] [PubMed] [Google Scholar]
- 10.Deepa M, Papita M, Nazir A, Anjana RM, Ali MK, Narayan KM, Mohan V. Diabetes Technol Ther. 2014;16:91–96. doi: 10.1089/dia.2013.0198. [DOI] [PMC free article] [PubMed] [Google Scholar]
- 11.Cinti S, Mitchell G, Barbatelli G, Murano I, Ceresi E, Faloia E, Wang S, Fortier M, Greenberg AS, Obin MS. J Lipid Res. 2005;46:2347–2355. doi: 10.1194/jlr.M500294-JLR200. [DOI] [PubMed] [Google Scholar]
- 12.Farb MG, Bigornia S, Mott M, Tanriverdi K, Morin KM, Freedman JE, Joseph L, Hess DT, Apovian CM, Vita JA, Gokce N. J Am Coll Cardiol. 2011;58:232–237. doi: 10.1016/j.jacc.2011.01.051. [DOI] [PMC free article] [PubMed] [Google Scholar]
- 13.Apovian CM, Bigornia S, Mott M, Meyers MR, Ulloor J, Gagua M, McDonnell M, Hess D, Joseph L, Gokce N. Arterioscler, Thromb, Vasc Biol. 2008;28:1654–1659. doi: 10.1161/ATVBAHA.108.170316. [DOI] [PMC free article] [PubMed] [Google Scholar]
- 14.Ahlin S, Sjoholm K, Jacobson P, Andersson-Assarsson JC, Walley A, Tordjman J, Poitou C, Prifti E, Jansson PA, Boren J, Sjostrom L, Froguel P, Bergman RN, Carlsson LM, Olsson B, Svensson PA. Obesity. 2013;21:E571. doi: 10.1002/oby.20443. [DOI] [PMC free article] [PubMed] [Google Scholar]
- 15.Howe LR, Subbaramaiah K, Hudis CA, Dannenberg AJ. Clin Cancer Res. 2013;19:6074–6083. doi: 10.1158/1078-0432.CCR-12-2603. [DOI] [PMC free article] [PubMed] [Google Scholar]
- 16.Bucerius J, Mani V, Wong S, Moncrieff C, Izquierdo-Garcia D, Machac J, Fuster V, Farkouh ME, Rudd JH, Fayad ZA. Eur J Nucl Med Mol Imaging. 2014;41:934–945. doi: 10.1007/s00259-013-2653-y. [DOI] [PMC free article] [PubMed] [Google Scholar]
- 17.Luciani A, Dechoux S, Deveaux V, Poirier-Quinot M, Luciani N, Levy M, Ballet S, Manin S, Pechoux C, Autret G, Clement O, Rahmouni A, Mallat A, Wilhelm C, Lotersztajn S, Gazeau F. Radiology. 2012;263:786–793. doi: 10.1148/radiol.12111957. [DOI] [PubMed] [Google Scholar]
- 18.Raman CV, Krishnan KS. Nature. 1928;121:501–502. doi: 10.1038/121501c0. [DOI] [Google Scholar]
- 19.Hanlon EB, Manoharan R, Koo TW, Shafer KE, Motz JT, Fitzmaurice M, Kramer JR, Itzkan I, Dasari RR, Feld MS. Phys Med Biol. 2000;45:R1–59. doi: 10.1088/0031-9155/45/2/201. [DOI] [PubMed] [Google Scholar]
- 20.Haka AS, Shafer-Peltier KE, Fitzmaurice M, Crowe J, Dasari RR, Feld MS. Proc Natl Acad Sci U S A. 2005;102:12371–12376. doi: 10.1073/pnas.0501390102. [DOI] [PMC free article] [PubMed] [Google Scholar]
- 21.Motz JT, Fitzmaurice M, Miller A, Gandhi SJ, Haka AS, Galindo LH, Dasari RR, Kramer JR, Feld MS. J Biomed Opt. 2006;11:021003. doi: 10.1117/1.2190967. [DOI] [PubMed] [Google Scholar]
- 22.Matousek P, Stone N. J Biophotonics. 2013;6:7–19. doi: 10.1002/jbio.201200141. [DOI] [PubMed] [Google Scholar]
- 23.Ellis DI, Cowcher DP, Ashton L, O’Hagan S, Goodacre R. Analyst. 2013;138:3871–3884. doi: 10.1039/c3an00698k. [DOI] [PubMed] [Google Scholar]
- 24.Shafer-Peltier KE, Haka AS, Fitzmaurice M, Crowe J, Myles J, Dasari RR, Feld MS. J Raman Spectrosc. 2002;33:552–563. doi: 10.1002/jrs.877. [DOI] [Google Scholar]
- 25.Garaulet M, Hernandez-Morante JJ, Lujan J, Tebar FJ, Zamora S. Int J Obes. 2006;30:899–905. doi: 10.1038/sj.ijo.0803219. [DOI] [PubMed] [Google Scholar]
- 26.Li M, Fu W, Li X-A. Int J Clin Exp Med. 2010;3:303–307. [PMC free article] [PubMed] [Google Scholar]
- 27.Morris PG, Hudis CA, Giri D, Morrow M, Falcone DJ, Zhou XK, Du B, Brogi E, Crawford CB, Kopelovich L, Subbaramaiah K, Dannenberg AJ. Cancer Prev Res. 2011;4:1021–1029. doi: 10.1158/1940-6207.CAPR-11-0110. [DOI] [PMC free article] [PubMed] [Google Scholar]
- 28.Motz JT, Hunter M, Galindo LH, Gardecki JA, Kramer JR, Dasari RR, Feld MS. Appl Opt. 2004;43:542–554. doi: 10.1364/AO.43.000542. [DOI] [PubMed] [Google Scholar]
- 29.Motz JT, Gandhi SJ, Scepanovic OR, Haka AS, Kramer JR, Dasari RR, Feld MS. J Biomed Opt. 2005;10:031113. doi: 10.1117/1.1920247. [DOI] [PubMed] [Google Scholar]
- 30.Buschman HP, Deinum G, Motz JT, Fitzmaurice M, Kramer JR, van der Laarse A, Bruschke AV, Feld MS. Cardiovasc Pathol. 2001;10:69–82. doi: 10.1016/S1054-8807(01)00064-3. [DOI] [PubMed] [Google Scholar]
- 31.Brereton RG. Chemometrics: Data Analysis for the Laboratory and Chemical Plant. John Wiley & Sons, Ltd; Hoboken, NJ: 2003. [Google Scholar]
- 32.Bresson S, El Marssi A, Khelifa B. Chem Phys Lipids. 2005;134:119–129. doi: 10.1016/j.chemphyslip.2004.12.009. [DOI] [PubMed] [Google Scholar]
- 33.De Gelder J, De Gussem K, Vandenabeele P, Moens L. J Raman Spectrosc. 2007;38:1133–1147. doi: 10.1002/jrs.1734. [DOI] [Google Scholar]
- 34.Weng YM, Weng RH, Tzeng CY, Chen W. Appl Spectrosc. 2003;57:413–418. doi: 10.1366/00037020360625952. [DOI] [PubMed] [Google Scholar]
- 35.Muik B, Lendl B, Molina-Diaz A, Ayora-Canada MJ. Chem Phys Lipids. 2005;134:173–182. doi: 10.1016/j.chemphyslip.2005.01.003. [DOI] [PubMed] [Google Scholar]
- 36.Scott RA, Cornelius SG, Mersmann HJ. J Anim Sci. 1981;52:505–511. doi: 10.2134/jas1981.523505x. [DOI] [PubMed] [Google Scholar]
- 37.Warensjo E, Rosell M, Hellenius ML, Vessby B, De Faire U, Riserus U. Lipids Health Dis. 2009;8:37. doi: 10.1186/1476-511X-8-37. [DOI] [PMC free article] [PubMed] [Google Scholar]
- 38.Lyng F, Gazi E, Gardner P. Preparation of Tissues and Cells for Infrared and Raman Spectroscopy and Imaging in Biomedical Applications of Synchrotron Infrared Microspectroscopy. Royal Society of Chemistry; London: 2011. [Google Scholar]
- 39.Ingalls AM, Dickie MM, Snell GD. J Hered. 1950;41:317–318. doi: 10.1093/oxfordjournals.jhered.a106073. [DOI] [PubMed] [Google Scholar]
- 40.Friedman JM, Halaas JL. Nature. 1998;395:763–770. doi: 10.1038/27376. [DOI] [PubMed] [Google Scholar]
- 41.Subbaramaiah K, Howe LR, Bhardwaj P, Du B, Gravaghi C, Yantiss RK, Zhou XK, Blaho VA, Hla T, Yang P, Kopelovich L, Hudis CA, Dannenberg AJ. Cancer Prev Res. 2011;4:329–346. doi: 10.1158/1940-6207.CAPR-10-0381. [DOI] [PMC free article] [PubMed] [Google Scholar] [Retracted]
- 42.Hong J, Stubbins RE, Smith RR, Harvey AE, Nunez NP. Nutr J. 2009;8:11. doi: 10.1186/1475-2891-8-11. [DOI] [PMC free article] [PubMed] [Google Scholar]
- 43.Ringner M. Nat Biotechnol. 2008;26:303–304. doi: 10.1038/nbt0308-303. [DOI] [PubMed] [Google Scholar]
- 44.Ramaswamy S, Tamayo P, Rifkin R, Mukherjee S, Yeang CH, Angelo M, Ladd C, Reich M, Latulippe E, Mesirov JP, Poggio T, Gerald W, Loda M, Lander ES, Golub TR. Proc Natl Acad Sci U S A. 2001;98:15149–15154. doi: 10.1073/pnas.211566398. [DOI] [PMC free article] [PubMed] [Google Scholar]
- 45.Noble WS. Nat Biotechnol. 2006;24:1565–1567. doi: 10.1038/nbt1206-1565. [DOI] [PubMed] [Google Scholar]
- 46.Ruderman N, Chisholm D, Pi-Sunyer X, Schneider S. Diabetes. 1998;47:699–713. doi: 10.2337/diabetes.47.5.699. [DOI] [PubMed] [Google Scholar]
Associated Data
This section collects any data citations, data availability statements, or supplementary materials included in this article.


