

Abstract
Background
Personal device technology has facilitated gathering data in real-time using Ecological momentary assessment (EMA). We hypothesized that using smartphones to measure symptoms in auto-generated surveys twice a day would be feasible in a group with bipolar disorder (BD). A second exploratory objective of this study was to compare potential differences in core symptoms between BD and healthy control (HC) groups.
Methods
A two-arm, parallel group, observational study was designed to measure completion rates of surveys of symptoms of mood, energy, speed of thought, impulsivity, and social stress in BD (N=10) and HC (N=10) participants. The surveys were auto-generated twice a day for fourteen days, and subjects could also perform self-generated surveys. Completion rates were compared between BD and HC groups. Scores were averaged for each participant over the 14 day period, and group medians were compared.
Results
Median completion rates did not differ between groups: 95% in BD, 88% in HC (p=0.68); the median completion rate of auto-generated surveys in the BD group was 79% and in the HC group was 71% (p=0.22). The BD group had significantly lower median mood score (p=0.043) and energy score (p=0.007) than the HC group. Median scores of speed of thoughts (p=0.739), impulsivity (p=0.123) and social stress (p=0.056) did not significantly differ between BD and HC. The BD group had significantly higher range of variability of group median mood (p=0.043), speed of thoughts (p=0.002) and impulsivity (p=0.005) scores over the course of 14 days than HC, while range of variability of energy (p=0.218) and social stress (p=0.123) scores did not differ. Results were not significantly different between auto-generated and self-generated surveys for BD or HC.
Limitations
This pilot study was conducted for a short time and with a small sample.
Conclusions
This study demonstrates feasibility of using EMA with a smartphone to gather data on BD symptoms.
Keywords: Bipolar disorder, Ecological momentary assessment, Mood, Depression, Mania
1. Introduction
Bipolar disorder (BD) is a recurrent, episodic illness affecting 1–4.4% of the population (Merikangas et al., 2007). While BD is defined by episodes of depression, mania and/or hypomania, studies have shown that as many as half of patients have chronic, subsyndromal symptoms (Judd et al., 2002). Core symptoms of BD, such as disturbances in mood state and energy level are solicited by the healthcare provider through the use of clinical questioning, and – in systems using best-practice standards – patient-rated questionnaires and mood diaries between weekly or monthly appointments (Harding et al., 2011; Sachs et al., 2003). This current model is generally successful in detecting large fluctuations in mood, yet is limited by recall bias and the influence of manic or depressive states on recollection of symptoms (Ghaemi, 2007).
There is growing interest in self-monitoring of mood and behavior on a daily basis, allowing for observation of progression into episodic depressive or manic states (Bauer et al., 2007, 2008; Aan Het Rot et al., 2012). The capacity for frequent self-monitoring of symptomology associated with BD, including prodromal symptoms, would allow clinicians to tailor treatment approaches in a more timely manner, and to better study the effects of early interventions on daily symptoms (Proudfoot et al., 2014; Judd et al., 2002). Additionally, monitoring of medication changes and mood changes related to medication are important for treatment (Bauer et al., 2013a, 2013b).
Ecological momentary assessment (EMA) is a data-capturing method related to experience sampling that is designed to assess data as events happen in real-time (Csikszentmihalyi and Larson, 1987; Johnstone et al., 1989; Terracciano et al., 2003; Ebner-Priemer and Trull, 2009; Trull and Ebner-Priemer, 2009; Shiffman et al., 2008). Emotions and behaviors can be recorded in the moment they occur within the patient’s natural environment (Aan Het Rot et al., 2012; Moskowitz and Young, 2006). EMA has been used in paper-and-pencil forms to explore emotional reactivity to daily life stress among participants with psychosis and affective disorder (Myin-Germeys et al., 2003; Havermans et al., 2007, 2010, 2011), and to gather mood data to improve prediction of suicidal ideation in subjects with BD (Thompson et al., 2014). Several studies in BD have also investigated negative or positive affect on a daily basis (Knowles et al., 2007; Myin-Germeys et al., 2003; Husky et al., 2010). Response to negative events have been identified as more stressful for BD than HC (Havermans et al., 2007), and correlated with higher cortisol levels (Havermans et al., 2011).
Advancing technology, including internet services and smartphones, has enhanced the ability to gather data in the field and has been well-accepted. Using at-home computer-based software, Bauer et al (2004) demonstrated a greater than 80% completion rate for more than 90% of participants over a 3-month period; reliability between self-report and clinician-report (Bauer et al., 2004); and that the use of the computer does not bias data collection based on comparable demographics (Bauer et al., 2005). As part of a trial of a new intervention, (Miklowitz et al., 2012) developed a text or email-based system to report scores of self-rated scales to the study team, and subjects responded to 71% of the daily prompts and 88% of the weekly prompts. (Faurhopsen et al 2013) developed a system for detecting prodromal symptoms and reported participation using this system in a randomized controlled trial of 66.1%. (Depp et al., 2012) found higher compliance using paper-and-pencil data collection when compared to using mobile phones in 56 participants with BD, however, mobile phones were better able to capture intra-participant variability. Concordance between self- and clinician-ratings has been found to be greater for depressive symptoms than manic symptoms (Faurholt-Jepsen et al., 2014; Depp et al., 2012).
We hypothesized that using smartphones to capture EMA ratings of mood symptoms would be feasible in those with BD, as measured by completion rates. To measure symptomology of BD, we selected a visual analog scale for mood, energy, speed of thoughts and impulsivity. These four areas correspond to independent factors of mania shown through factor analysis: dysphoric mood (mood), psychomotor pressure (energy), psychosis (not conducive to self-report measure), increased hedonic function (impulsivity) and irritable aggression (Cassidy et al., 1998a; 1998b). Additionally, mood, energy and intellect (thoughts) are the three areas noted through careful, longitudinal study of phenomenology by Emil Kraepelin to cycle out of sync, producing mixed states (Kraepelin, 1921; Mackinnon and Pies, 2006). It was hypothesized that the BD group would demonstrate lower mood and energy; and higher speed of thoughts, impulsivity and social stress. We hypothesized that greater variability in all symptoms would be present in the BD group.
2. Methods
2.1. Design and sample
The study was approved by the institutional review board of the Hershey Medical Center (PSU COM IRB # 00251, approval 3/28/2014). A two-arm, parallel group, observational study was designed to measure a method of capturing information on symptoms of mood, energy, speed of thought, impulsivity and stress in a BD and a HC group. Personal health information collected for this study was stored in Research Electronic Data Capture System (REDCap), a secure data-management system supported by the Penn State Clinical Translational Science Institute.
A small sample size (n=20) was selected to gather pilot data for this feasibility study. We recruited 10 participants with BD I or II and 10 HC. Individuals with BD and HC were recruited from a database of individuals who participated in our research program in the past and agreed to be contacted for future studies. Eligibility criteria for the BD group included minimum age of 18, and BD diagnosis established using the Mini International Neuropsychiatric Interview, version 5.0 (MINI 5.0). Subjects could be in any mood state at the time of enrollment. The HC group included minimum age of 18, and individuals without personal or family history of major psychiatric illness including mood or anxiety disorders, established using the Mini International Neuropsychiatric Interview, version 5.0 (MINI 5.0). Exclusion criteria for both groups included inability to read English and discomfort using smartphone technology. Informed consent was obtained at the time of enrollment for all participants. Individuals with BD were engaged in outpatient care by a psychiatrist.
2.2. Technology and security of data transfer
Smartphone devices were distributed to participants to collect data for this study. Smartphones were provided to subjects to ensure that all subjects had the same device, and to ensure that data was encrypted and secure. Ensuring confidentiality and secure transfer of data is a key ethical concern in studies using electronic means to gather data.
Smartphones were preset with unique identification numbers. Upon enrollment, participants were randomly assigned these devices and were identified by this number for the duration of the study. Smartphones (Motorola Droid RazrM) were obtained and programmed through the Survey Research Center at Penn State University Park Dynamic Real-Time Ecological Ambulatory Methodologies (DREAM). Data was collected on a system developed by DREAM on a secure ITS-hosted virtual server running Windows Server 2008. Data collected via the smartphones were transmitted to a set of PHP scripts on the server, and the data were stored in a local MySQL database. Data stored in the SQLite database on the smartphones was protected by a 256-bit AES encryption provided by the SQLCipher library. Data stored in text files on the phone was also protected with AES encryption provided by the javax cipher library. All web requests to the server were protected by AES 256-bit SSL encryption. The PHP pages that allow dataset retrieval by researchers were also password-protected to ensure data confidentiality.
2.3. Survey tools
Demographic data including age, sex, employment status, ethnicity, race, and marital and status were gathered.
Surveys were composed of two types of scales:
A Visual Analog Scale was utilized to record ratings for each of the following variables: mood, energy, speed of thought and impulsivity. Participants were able to choose any point along the scale ranging from 0 to 100 by positioning a marker. The middle mark of 50 was the default position. During the training, participants were instructed that 0 and 100 represented the most extreme states they could imagine experiencing for each item, and were provided examples to illustrate these points, i.e. 0 on the mood variable was described as being the most “down or depressed” one could imagine feeling, and 100 was described as the most “up or elated” one could imagine feeling; 50 was described as “normal mood”. Subjects were taught to position the VAS marker at the point on the scale that they believed best described their feelings and behavior at the time the device generated a survey.
A Likert scale was used for social stress (Myin Germeys et al., 2003). Two items formed the measure of social stress: “I am with others” and “I would rather be alone.” The response for the item “I am with others” was dichotomous (yes, no). The scoring for “I would rather be alone” utilized a 7-point Likert Scale where 1= “strongly agree” and 7= “strongly disagree,” if the response to “I am with others” was “no.” If the response to “I am with others” was “yes,” then the Likert Scale scoring was reverse-coded (1= “strongly disagree, 7= “strongly agree”). Using this scoring method, incongruence between current social state and desired social state (i.e. being with others while preferring to be alone) was rated a “7” or high-stress situation. Congruence between current state and desired state (i.e. being with others and desiring that company) was rated as “1,” depicting a low-stress situation.
2.4. Procedures
The Survey Research Center at Penn State University Park Dynamic Real-Time Ecological Ambulatory Methodologies (DREAM) group provided on-site training to the research team on how to use the smartphone devices, survey software, and data collection tools. DREAM staff also instructed the research team on the use of a standardized protocol for subject participation. The research team developed a checklist to guide orientation of the participants to the phone.
At the initial visit, participants were provided a smartphone programmed with the survey application and were trained on how to use the device and application by the study team using the orientation checklist. Participants were responsible for completing surveys twice a day at random, requesting information regarding mood state, energy and stress levels, and other symptoms. Once signaled to respond, participants had 30 min to complete the survey, with the option to delay survey completion for up to 20 min via a snooze feature. Each auto-generated survey timed out after 30 min if the participant did not complete and submit the survey. In order to best implement the EMA model, participants were instructed to complete the surveys at the time that they were generated by the device. However, participants could manually enter a survey any time that day if they missed an automated prompt. Participants could refuse to answer questions at any time. The surveys were active for fourteen days. Please see Fig 1 for screen shots of the survey.
Figure 1.
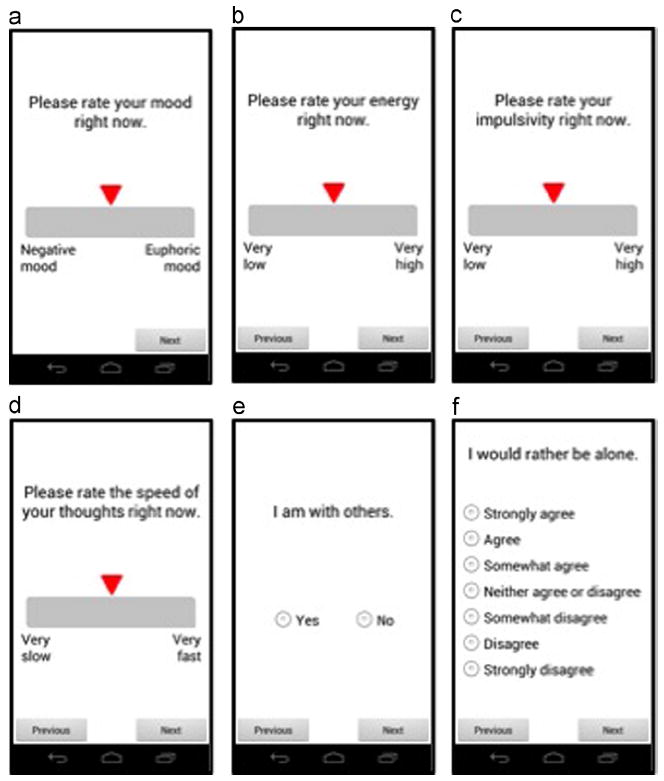
Screet shots of smartphone interface. A VAS scale was used for mood (a), energy (b), speed of thoughts (c) and impulsivity (d) measures. The two items comprising the social stress measure are shown in e and f.
2.5. Qualitative feedback
When participants returned the smartphones, qualitative feedback was solicited regarding the study. Participants were asked a series of satisfaction questions including, “if you previously participated in studies using written surveys, how did your experience with the smartphone survey compare to your experiences with written questionnaires?” and “ how would you describe your experience with the survey tool and its delivery.”
2.6. Statistical analysis
Completion rates were calculated as the number of surveys answered divided by the total number of surveys expected over the fourteen-day period. Survey entries were identified as either auto-generated or self-generated, contingent on whether the participant responded to the prompt by the smartphone or manually entered the survey, respectively. Analysis was conducted on the combined data, and on auto-generated surveys alone. Median completion rates are reported and groups were compared using Mann-Whitney U test due to non-normal distribution.
To assess the average symptom score of mood, energy, thought, impulsivity and social stress, the mean value for each symptom for the 14-day period was calculated for each individual. The group medians of the individual 14-day means were compared between study groups by the Mann-Whitney U test. To assess differences in variability between BD and HC groups, the range for each individual over the 14-day period was calculated for the scores of mood, energy, speed of thoughts, impulsivity and social stress. The median ranges were compared between study groups using the Mann-Whitney U test. Alpha level was set at less than 0.05 for determining statistical significance. SPSS Version 22, IBM Statistics, IBM Corporation, Armonk, New York, USA was used to perform all statistical computations.
3. Results
3.1. Completion rates
Demographic characteristics of the control and BD groups are presented in Table 1. Groups did not differ by age, sex or employment rate. Eighteen out of twenty participants completed the full 14 days of the study; one BD participant dropped out on day 10 due to development of a manic episode, and one HC participant dropped out on day 12 due to a family emergency. Descriptive data on the completion of surveys are presented in Table 1. Median completion rates of surveys were not significantly different between groups: 95% in the BD group, and 88% in the HC group (Table 1, p=0.68). Completion rates for auto-generated surveys alone did not differ by group – in the BD group, the median completion rate was 79% of the surveys through the auto-generated survey, and in the HC group, 71% (p=0.22, Table 1). Similarly, completion rates for self-generated surveys did not differ between group – in the BD group, median completion rate was 15% and in the HC group, 19% (p=0.53, Table 1).
Table 1.
Demographic and mood survey information by group.
| BD (N=10) | HC (N=10) | p-value | |
|---|---|---|---|
| Age, mean ± SD | 48.94 ± 16.8 | 39.66 ± 14.2 | 0.2 |
| Sex, N (% female) | 7 (70%) | 8 (80%) | 0.61 |
| Employed, N (%) | 7 (70%) | 8 (80%) | 0.61 |
| Caucasian Race, N (%) | 8 (80%) | 8 (80%) | 0.61 |
| Non-Hispanic Ethnicity, N (%) | 10(100%) | 9 (90%) | 0.69 |
| Married | 2 (20%) | 6 (60%) | 0.95 |
| Bipolar I, N (%) | 10 (100%) | N/A | N/A |
| Completion of surveys, mean ± SD | 25.4 ± 3.6 | 24.0 ± 5.1 | |
| Completion of surveys, median (IQR) | 26.5 (3.75) | 24.5 (7.25) | |
| Completion of surveys, min | 17 | 14 | |
| Completion of surveys, max | 29 | 30 | |
| Auto completion of surveys, mean ± SD | 21.1 ± 6.0 | 18.2 ± 6.0 | |
| Auto completion of surveys, median (IQR) | 22.0 (6.25) | 20.0 (13.0) | |
| Auto completion of surveys, min | 8 | 9 | |
| Auto completion of surveys, max | 28 | 25 | |
| Self completion of surveys, mean ± SD | 4.3 ± 3.7 | 5.8 ± 4.5 | |
| Self completion of surveys, median (IQR) | 4.0 (6.75) | 5.0 (7.5) | |
| Self completion of surveys, min | 0 | 0 | |
| Self completion of surveys, max | 11 | 14 | |
| Median (IQR) | Median (IQR) | ||
| Completion rate | 95% (13) | 88% (26) | 0.68 |
| Auto-completion rate | 79% (22) | 71% (46) | 0.22 |
| Self-completion rate | 15% (24) | 19% (27) | 0.53 |
| 14-day mean of mood | 48.6 (25.2) | 53.2 (22.9) | 0.043* |
| 14-day range of mood | 48.0 (20.3) | 32.5 (25.0) | 0.043* |
| 14-day mean of energy | 44.7 (25.7) | 52.1 (22.3) | 0.007* |
| 14-day range of energy | 46.5 (34.3) | 36.5 (51) | 0.218 |
| 14-day mean of thoughts | 53.0 ± 18.6 | 50.0 ± 16.8 | 0.739 |
| 14-day range of thoughts | 59.5 (30.8) | 26.5 (31.8) | 0.002* |
| 14-day mean of impulsivity | 36.9 ± 10.3 | 14.5 ± 37.9 | 0.123 |
| 14-day range of impulsivity | 76 (31.3) | 28.5 (46) | 0.005* |
| 14-day mean of social stress | 3.4 (0.67) | 3.0 (0.43) | 0.056 |
| 14-day range of social stress | 5.7 (1) | 5.7 (1.3) | 0.123 |
p < 0.0.5 is statistically significant. The scale for mood, energy, thoughts, impulsivity ranges from 0 to 100; the scale for social stress is 1–7.
3.2. Group differences in mood symptoms (Table 1)
The median scores of the 14-day mean mood and energy in the BD group was significantly lower than in the HC group, while speed of thoughts, impulsivity and social stress were not significantly different. The median scores of the 14-day range for mood, speed of thoughts, and impulsivity did differ from HC, while energy, and social stress did not differ. Please see Fig 2, which shows the individual scores for mood over the 14-day period for HC (Fig 2a) and BD (Fig 2b).
Figure 2.
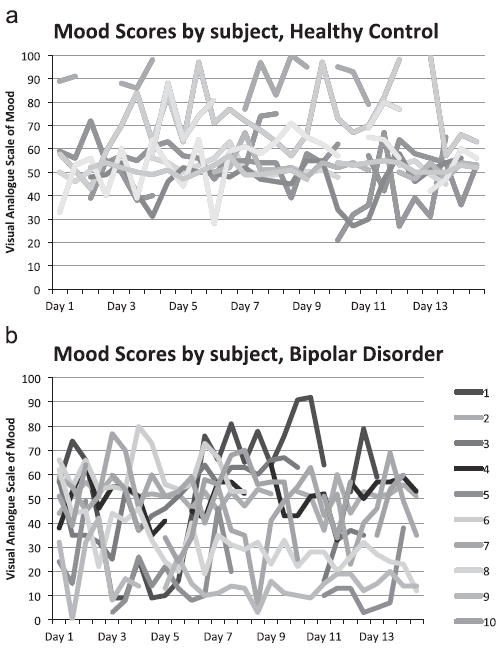
Ranges for mood variable for HC group (a) and BD group (b).
A secondary group comparison was done to determine if there was a difference in results between auto- and self-generated survey data. No significant difference in the medians was found between the auto-generated and self-generated surveys for either group (data not shown). Data from the auto-generated and self-generated surveys were therefore reported together.
3.3. Qualitative feedback
Qualitative feedback from all study participants was elicited at the end of the 14-day data collection period. Participants were asked a series of satisfaction questions including,
“If you previously participated in studies using written surveys, how did your experience with the smartphone survey compare to your experiences with written questionnaires?” and “how would you describe your experience with the survey tool and its delivery.” Responses from the study participants indicated that smartphone EMA was well accepted. Some participants with BD compared the experience with the smartphone to experiences with written diaries in previous studies and/or treatment interventions, and those participants reported that mobile devices were more convenient, more preferable and user-friendly. Research subjects with BD also reflected that they gained personal insight into mood and other symptoms as a result of participating in this study.
4. Discussion
Completion rates for this study demonstrated that the use of EMA on a smartphone device is a feasible modality for data collection in BD. The majority of the surveys were completed through the auto-generated survey, reflecting true EMA. While technological methods for capturing data are generally well-accepted, some have shown less compliance with smartphones than pencil-and-paper (Depp et al., 2012). However, capitalizing on technological methods quells concerns for factors that may generate bias, such as completing the assessments at the instructed times instead of retrospectively or prospectively (Wenze and Miller, 2010) and the bias reconstruction of past experiences (Ebner-Priemer and Trull, 2009). Although allowing subjects to complete ratings through self-generated surveys when auto-generated surveys are missed improves convenience and may have improved compliance, this protocol may introduce bias. Subjects may not be able or may choose not to answer surveys for a particular symptom-related reason, or may choose to generate surveys at a particular time with regard to how they are feeling. The software used in this study allowed for time-stamping of surveys, and coded the distinction between auto-generated and self-generated surveys. We therefore compared results from auto-generated and self-generated surveys. We found no quantitative difference between auto-generated and self-generated entries in mean or variability, which may indicate no systematic bias related to the symptoms we were measuring. However, these findings are preliminary due to the small sample. A longer study with a larger sample will be beneficial in answering if the auto-generated surveys truly differ from self-generated surveys. The positive qualitative feedback reflected the high completion rate seen in the study and is promising that the technology can be productively used in future studies, echoing high acceptability found in other studies (Depp et al., 2010).
A notable strength of this study was the exploration of a broad range of symptomology associated with BD. While many reports of EMA methods in BD have measured mood, this study also supports that EMA measurement of energy, impulsivity, speed of thought and social stress assessed using the same technique.
As a pilot study, there are several limitations. Short duration of monitoring may not capture the full spectrum of symptomatology. Future studies will explore using an increased duration to confirm sustainability of completion rates over extended periods of time. The length of time for optimal monitoring will depend on the purpose of that monitoring. To detect prodromal symptoms of an impending major episode, prolonged monitoring, perhaps for months, may be required. To detect subsyndromal symptoms that may be a target for optimization of inter-episode treatment, a shorter time period may be sufficient.
Additionally, although all participants received training utilizing a standardized instructional manual, participant understanding and interpretation of the visual analog scales are difficult to ensure and are subjective. Participants in the BD group were all receiving active outpatient psychiatric treatment. These techniques could be investigated in subjects in different treatment settings to explore the sensitivity of detection of changes in symptoms. Lastly, the ability to generalize the results to the population at large is limited secondary to the study sample size and selectivity of the results is limited given that there was not another comparison group with a different psychiatric diagnosis that might have overlapping symptoms. Future studies could address this by using several comparison groups.
This study enriches current literature demonstrating feasibility and positive participant experience by those with BD when EMA smartphone technology is used.
Acknowledgments
Role of the funding source
The authors wish to acknowledge the participants in the study who donated time and effort to research. The project described was supported by the National Center for Research Resources, Grant KL2 RR033180 (EFHS), and is now at the National Center for Advancing Translational Sciences, Grant KL2 TR000126. The content is solely the responsibility of the authors and does not necessarily represent the official views of the NIH. The sponsors of this research did not have direct influence over the collection, analysis or interpretation of data.
Footnotes
Contributors
S. Schultz and S. Schwartz were involved with the design of the trial, the collection of data, analysis of data and preparation of all drafts of the manuscript. AR was involved with study design, data collection, and reviewing the manuscript. ES was involved with study design, data collection, data analysis and preparation of all drafts of the manuscript.
Institutional review board
The study was approved by the institutional review board of the Hershey Medical Center (PSU COM IRB # 00251, approval 3/28/2014).
Conflict of interest
None.
Financial disclosures
EFHS has been a consultant for Projects In Knowledge, CME; AR, SS,SS – none.
Contributor Information
Stefani Schwartz, Email: sschwartz1@hmc.psu.edu.
Summer Schultz, Email: sschultz1@hmc.psu.edu.
Aubrey Reider, Email: areider@hmc.psu.edu.
References
- Aan Het Rot M, Hogenelst K, Schoevers RA. Mood disorders in everyday life: a systematic review of experience sampling and ecological momentary assessment studies. Clin Psychol Rev. 2012;32:510–523. doi: 10.1016/j.cpr.2012.05.007. [DOI] [PubMed] [Google Scholar]
- Bauer M, Glenn T, Alda M, Sagduyu K, Marsh W, Grof P, Munoz R, Severus E, Ritter P, Whybrow PC. Drug treatment patterns in bipolar disorder: analysis of long-term self-reported data. Int J Bipolar Disord. 2013a;1:5. doi: 10.1186/2194-7511-1-5. [DOI] [PMC free article] [PubMed] [Google Scholar]
- Bauer M, Glenn T, Grof P, Pfennig A, Rasgon NL, Marsh W, Munoz RA, Sagduyu K, Alda M, Quiroz D, Sasse J, Whybrow PC. Self-reported data from patients with bipolar disorder: frequency of brief depression. J Affect Disord. 2007;101:227–233. doi: 10.1016/j.jad.2006.11.021. [DOI] [PubMed] [Google Scholar]
- Bauer M, Grof P, Gyulai L, Rasgon N, Glenn T, Whybrow PC. Using technology to improve longitudinal studies: self-reporting with ChronoRecord in bipolar disorder. Bipolar Disord. 2004;6:67–74. doi: 10.1046/j.1399-5618.2003.00085.x. [DOI] [PubMed] [Google Scholar]
- Bauer M, Rasgon N, Grof P, Gyulai L, Glenn T, Whybrow PC. Does the use of an automated tool for self-reporting mood by patients with bipolar disorder bias the collected data? MedGenMed. 2005;7:21. [PMC free article] [PubMed] [Google Scholar]
- Bauer M, Wilson T, Neuhaus K, Sasse J, Pfennig A, Lewitzka U, Grof P, Glenn T, Rasgon N, Bschor T, Whybrow PC. Self-reporting software for bipolar disorder: validation of ChronoRecord by patients with mania. Psychiatry Res. 2008;159:359–366. doi: 10.1016/j.psychres.2007.04.013. [DOI] [PubMed] [Google Scholar]
- Bauer R, Glenn T, Alda M, Sagduyu K, Marsh W, Grof P, Munoz R, Murray G, Ritter P, Lewitzka U, Severus E, Whybrow PC, Bauer M. Anti-depressant dosage taken by patients with bipolar disorder: factors associated with irregularity. Int J Bipolar Disord. 2013b;1:26. doi: 10.1186/2194-7511-1-26. [DOI] [PMC free article] [PubMed] [Google Scholar]
- Cassidy F, Forest K, Murry E, Carroll BJ. A factor analysis of the signs and symptoms of mania. Arch Gen Psychiatry. 1998a;55:27–32. doi: 10.1001/archpsyc.55.1.27. [DOI] [PubMed] [Google Scholar]
- Cassidy F, Murry E, Forest K, Carroll BJ. Signs and symptoms of mania in pure and mixed episodes. J Affect Disord. 1998b;50:187–201. doi: 10.1016/s0165-0327(98)00016-0. [DOI] [PubMed] [Google Scholar]
- Csikszentmihalyi M, Larson R. Validity and reliability of the experience-sampling method. J Nerv Ment Dis. 1987;175:526–536. doi: 10.1097/00005053-198709000-00004. [DOI] [PubMed] [Google Scholar]
- Depp CA, Kim DH, De Dios LV, Wang V, Ceglowski J. A pilot study of mood ratings captured by mobile phone versus paper-and-pencil mood charts in bipolar disorder. J Dual Diagn. 2012;8:326–332. doi: 10.1080/15504263.2012.723318. [DOI] [PMC free article] [PubMed] [Google Scholar]
- Depp CA, Mausbach B, Granholm E, Cardenas V, Ben-Zeev D, Patterson TL, Lebowitz BD, Jeste DV. Mobile interventions for severe mental illness: design and preliminary data from three approaches. J Nerv Ment Dis. 2010;198:715–721. doi: 10.1097/NMD.0b013e3181f49ea3. [DOI] [PMC free article] [PubMed] [Google Scholar]
- Ebner-Priemer UW, Trull TJ. Ecological momentary assessment of mood disorders and mood dysregulation. Psychol Assess. 2009;21:463–475. doi: 10.1037/a0017075. [DOI] [PubMed] [Google Scholar]
- Faurholt-Jepsen M, Vinberg M, Christensen EM, Frost M, Bardram J, Kessing LV. Daily electronic self-monitoring of subjective and objective symptoms in bipolar disorder – the MONARCA trial protocol (MONitoring, treAtment and pRediCtion of bipolAr disorder episodes): a randomised controlled single-blind trial. BMJ Open. 2013;3:e003353. doi: 10.1136/bmjopen-2013-003353. http://dx.doi.org/10.1136/bmjopen-2013-003353. [DOI] [PMC free article] [PubMed] [Google Scholar]
- Faurholt-Jepsen M, Vinberg M, Frost M, Christensen E, Bardram J, Kessing L. Daily electronic monitoring of subjective and objective measures of illness activity in bipolar disorder using smartphones inverted question mark the MONARCA II trial protocol: a randomized controlled single-blind parallel-group trial. BMC Psychiatry. 2014;14:309. doi: 10.1186/s12888-014-0309-5. [DOI] [PMC free article] [PubMed] [Google Scholar]
- Ghaemi SN. Feeling and time: the phenomenology of mood disorders, depressive realism, and existential psychotherapy. Schizophr Bull. 2007;33:122–130. doi: 10.1093/schbul/sbl061. [DOI] [PMC free article] [PubMed] [Google Scholar]
- Harding KJ, Rush AJ, Arbuckle M, Trivedi MH, Pincus HA. Measurement-based care in psychiatric practice: a policy framework for implementation. J Clin Psychiatry. 2011;72:1136–1143. doi: 10.4088/JCP.10r06282whi. [DOI] [PubMed] [Google Scholar]
- Havermans R, Nicolson NA, Berkhof J, Devries MW. Mood reactivity to daily events in patients with remitted bipolar disorder. Psychiatry Res. 2010;179:47–52. doi: 10.1016/j.psychres.2009.10.020. [DOI] [PubMed] [Google Scholar]
- Havermans R, Nicolson NA, Berkhof J, Devries MW. Patterns of salivary cortisol secretion and responses to daily events in patients with remitted bipolar disorder. Psychoneuroendocrinology. 2011;36:258–265. doi: 10.1016/j.psyneuen.2010.07.016. [DOI] [PubMed] [Google Scholar]
- Havermans R, Nicolson NA, Devries MW. Daily hassles, uplifts, and time use in individuals with bipolar disorder in remission. J Nerv Ment Dis. 2007;195:745–751. doi: 10.1097/NMD.0b013e318142cbf0. [DOI] [PubMed] [Google Scholar]
- Husky MM, Gindre C, Mazure CM, Brebant C, Nolen-Hoeksema S, Sanacora G, Swendsen J. Computerized ambulatory monitoring in mood disorders: feasibility, compliance, and reactivity. Psychiatry Res. 2010;178:440–442. doi: 10.1016/j.psychres.2010.04.045. [DOI] [PubMed] [Google Scholar]
- Johnstone EC, Owens DG, Bydder GM, Colter N, Crow TJ, Frith CD. The spectrum of structural brain changes in schizophrenia: age of onset as a predictor of cognitive and clinical impairments and their cerebral correlates. Psychol Med. 1989;19:91–103. doi: 10.1017/s0033291700011053. [DOI] [PubMed] [Google Scholar]
- Judd LL, Akiskal HS, Schettler PJ, Endicott J, Maser J, Solomon DA, Leon AC, Rice JA, Keller MB. The long-term natural history of the weekly symptomatic status of bipolar I disorder. Arch Gen Psychiatry. 2002;59:530–537. doi: 10.1001/archpsyc.59.6.530. [DOI] [PubMed] [Google Scholar]
- Knowles R, Tai S, Jones SH, Highfield J, Morriss R, Bentall RP. Stability of self-esteem in bipolar disorder: comparisons among remitted bipolar patients, remitted unipolar patients and healthy controls. Bipolar Disord. 2007;9:490–495. doi: 10.1111/j.1399-5618.2007.00457.x. [DOI] [PubMed] [Google Scholar]
- Kraepelin E. Manic-Depressive Illness and Paranoia. Edinburgh, UK: 1921. [Google Scholar]
- Mackinnon DF, Pies R. Affective instability as rapid cycling: theoretical and clinical implications for borderline personality and bipolar spectrum disorders. Bipolar Disord. 2006;8:1–14. doi: 10.1111/j.1399-5618.2006.00283.x. [DOI] [PubMed] [Google Scholar]
- Merikangas KR, Akiskal HS, Angst J, Greenberg PE, Hirschfeld RM, Petukhova M, Kessler RC. Lifetime and 12-month prevalence of bipolar spectrum disorder in the National Comorbidity Survey replication. Arch Gen Psychiatry. 2007;64:543–552. doi: 10.1001/archpsyc.64.5.543. [DOI] [PMC free article] [PubMed] [Google Scholar]
- Miklowitz DJ, Price J, Holmes EA, Rendell J, Bell S, Budge K, Christensen J, Wallace J, Simon J, Armstrong NM, Mcpeake L, Goodwin GM, Geddes JR. Facilitated integrated mood management for adults with bipolar disorder. Bipolar Disord. 2012;14:185–197. doi: 10.1111/j.1399-5618.2012.00998.x. [DOI] [PMC free article] [PubMed] [Google Scholar]
- Moskowitz DS, Young SN. Ecological momentary assessment: what it is and why it is a method of the future in clinical psychopharmacology. J Psychiatry Neurosci. 2006;31:13–20. [PMC free article] [PubMed] [Google Scholar]
- Myin-Germeys I, Peeters F, Havermans R, Nicolson NA, Devries MW, Delespaul P, Van Os J. Emotional reactivity to daily life stress in psychosis and affective disorder: an experience sampling study. Acta Psychiatr Scand. 2003;107:124–131. doi: 10.1034/j.1600-0447.2003.02025.x. [DOI] [PubMed] [Google Scholar]
- Proudfoot J, Whitton AE, Parker G, Manicavasagar V, Nicholas J, Smith M. Evidence of weekly cyclicity in mood and functional impairment in those with a bipolar disorder. Psychiatry Res. 2014 doi: 10.1016/j.psychres.2014.04.047. [DOI] [PubMed] [Google Scholar]
- Sachs GS, Thase ME, Otto MW, Bauer M, Miklowitz D, Wisniewski SR, Lavori P, Lebowitz B, Rudorfer M, Frank E, Nierenberg AA, Fava M, Bowden C, Ketter T, Marangell L, Calabrese J, Kupfer D, Rosenbaum JF. Rationale, design, and methods of the systematic treatment enhancement program for bipolar disorder (STEP-BD) Biol Psychiatry. 2003;53:1028–1042. doi: 10.1016/s0006-3223(03)00165-3. [DOI] [PubMed] [Google Scholar]
- Shiffman S, Stone AA, Hufford MR. Ecological momentary assessment. Annu Rev Clin Psychol. 2008;4:1–32. doi: 10.1146/annurev.clinpsy.3.022806.091415. [DOI] [PubMed] [Google Scholar]
- Terracciano A, Mccrae RR, Costa PT., Jr Factorial and construct validity of the Italian positive and negative affect schedule (PANAS) Eur J Psychol Assess. 2003;19:131–141. doi: 10.1027//1015-5759.19.2.131. [DOI] [PMC free article] [PubMed] [Google Scholar]
- Thompson WK, Gershon A, O’hara R, Bernert RA, Depp CA. The prediction of study-emergent suicidal ideation in bipolar disorder: a pilot study using ecological momentary assessment data. Bipolar Disord. 2014;16:669–677. doi: 10.1111/bdi.12218. [DOI] [PMC free article] [PubMed] [Google Scholar]
- Trull TJ, Ebner-Priemer UW. Using experience sampling methods/ecological momentary assessment (ESM/EMA) in clinical assessment and clinical research: introduction to the special section. Psychol Assess. 2009;21:457–462. doi: 10.1037/a0017653. [DOI] [PMC free article] [PubMed] [Google Scholar]
- Wenze SJ, Miller IW. Use of ecological momentary assessment in mood disorders research. Clin Psychol Rev. 2010;30:794–804. doi: 10.1016/j.cpr.2010.06.007. [DOI] [PubMed] [Google Scholar]