Abstract
The preparation and spectroscopic characterization of a CO-inhibited [FeFe] hydrogenase with a selectively 57Fe-labeled binuclear subsite is described. The precursor [57Fe2(adt)(CN)2(CO)4]2– was synthesized from the 57Fe metal, S8, CO, (NEt4)CN, NH4Cl, and CH2O. (Et4N)2[57Fe2(adt)(CN)2(CO)4] was then used for the maturation of the [FeFe] hydrogenase HydA1 from Chlamydomonas reinhardtii, to yield the enzyme selectively labeled at the [2Fe]H subcluster. Complementary 57Fe enrichment of the [4Fe-4S]H cluster was realized by reconstitution with 57FeCl3 and Na2S. The Hox-CO state of [257Fe]H and [457Fe-4S]H HydA1 was characterized by Mössbauer, HYSCORE, ENDOR, and nuclear resonance vibrational spectroscopy.
Graphical abstract

INTRODUCTION
Since their crystallographic identification, the hydrogenases (H2ases) represent perfect paradigms for bioinspired energy transformations. Utilizing only base metals and operating at near thermodynamic potentials, these enzymes promote reactions at extraordinary rates, in the case of [FeFe] H2ases thousands of turnover per second.1 Further motivating this theme are the practical implications of the H2/H+ redox reaction, which is the basis for fuel cells.
Many [FeFe] H2ases have been studied, but the algal H2ase from Chlamydomonas reinhardtii, HydA1,2 has received particular attention.3 The C. reinhardtii protein is ideal for studies on biosynthesis4 and spectroscopy because it represents a “minimal architecture” enzyme containing only the active site.5 In contrast, most [FeFe] H2ases feature multiple accessory [Fe–S] clusters. The active site of all [FeFe] H2ases is the “H-cluster”, consisting of a [4Fe-4S]H cluster appended via a bridging cysteinyl thiolate to a diiron subunit called [2Fe]H.6 In [2Fe]H, a diiron center is bound to CO, CN−, and azadithiolate (adt2– = [(SCH2)2NH]2–) ligands (Figure 1).7
Figure 1.
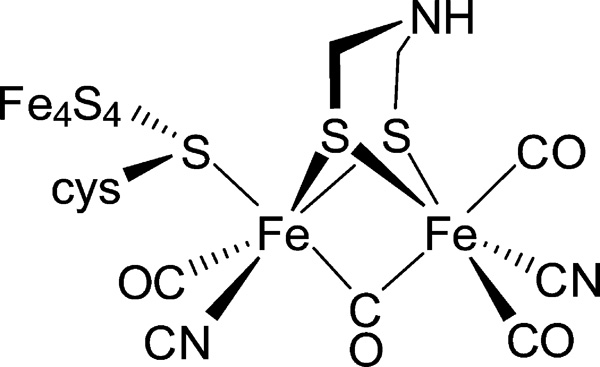
H-cluster of HydA1 in the Hox-CO state.
Recent work has shown that functional HydA1 enzyme can be produced through incubation of unmaturated HydA1 containing only the [4Fe-4S]H subcluster, with a synthetic active site mimic (Et4N)2[57Fe2(adt)(CN)2(CO)4].8 This innovation exploits the fact that the active site is attached to the protein through few covalent bonds. Via this artificial maturation, the enzyme is now available with wide variety of chemically and isotopically labeled versions9,10 of the [2Fe]H subunit on a scale and at a pace that would not be readily achieved by in vitro maturation routes.11,12 This “artificial maturation” allows a detailed characterization of individual active site states and the catalytic mechanism through a variety of spectroscopic techniques.9
The artificial maturation route in principle should allow the selective labeling of the [2Fe]H subunit with 57Fe, a nucleus highly responsive to Mössbauer and nuclear resonance vibrational spectroscopies (NRVS). With a nuclear spin I = 1/2, 57Fe is also ideal for the suite of EPR techniques that provide exquisite insights into Fe-based enzymes.13 57Fe-labeling of the [2Fe]H subunit however poses a significant synthetic challenge because salts of [Fe2(adt)(CN)2(CO)4]2– are prepared by multistep sequences starting from reagents that would only be awkwardly and inefficiently labeled with 57Fe. In this report these challenges are surmounted, as established by the preparation of HydA1 with a selectively 57Fe-labeled [2Fe]H site. The Hox-CO state of HydA1 (Figure 1) can be obtained as a pure state and was therefore chosen to demonstrate the selective labeling. Using (Et4N)2[57Fe2(adt)(CN)2(CO)4] as precursor the [2Fe]H subsite in Hox-CO was labeled using artificial maturation. In a complementary experiment the [4Fe-4S] subcluster in Hox-CO was labeled using FeS reconstitution. The two 57Fe labeled versions of Hox-CO were studied using Mössbauer, electron nuclear double resonance (ENDOR), hyperfine sublevel correlation (HYSCORE) as well as nuclear resonance vibrational (NRVS) spectroscopy.
RESULTS AND DISCUSSION
Synthesis and Characterization of [57Fe2(adt)-(CN)2(CO)4]2–
The precursor to the target [57Fe2(adt)-(CN)2(CO)4]2– is 57Fe2(adt)(CO)6, which undergoes dicyanation nearly quantitatively.14 Synthesis of the diiron hexacarbonyl, however, poses challenges because it is derived via a series of inefficient reactions from precursors that are not readily labeled with 57Fe. Low yielding routes to unlabeled Fe2(adt)(CO)6 are tolerated14 because the relevant reagents, e.g., Fe(CO)5, are inexpensive and the early steps in the preparation can be conducted on a multigram scale. The industrial method for production of Fe(CO)5 involves the direct carbonylation of Fe metal at high temperatures and pressures, e.g., 175 atm at 150 °C.15 Such reactions require specialized autoclaves,16 which are not suited for producing small amounts of 57Fe(CO)5. A variety of laboratory syntheses of 57Fe(CO)5 have been described, but they suffer from low yields and difficult separations even when using specialized equipment.17
The above considerations led to a focus on routes that avoid the intermediacy of Fe(CO)5. Retrosynthetic analysis reminds one that Fe2S2(CO)6, the immediate precursor to Fe2(adt)-(CO)6, is formed from the [HFe(CO)4]− anion, not the pentacarbonyl. Thus, syntheses of [H57Fe(CO)4]− from 57FeX2 are of interest. Literature methods18 for generating [HFe-(CO)4]− from iron halides proved low-yielding in our hands. Relevant to possible routes to [H57Fe(CO)4]− is the fact that it is easily derived from [Fe(CO)4]2– by protonation. The anion [Fe(anthracene)2]−, prepared by Ellis and co-workers in 61% yield from FeBr2, carbonylates at ambient pressures.19 The product, obtained in 81% isolated yield, is [K(18-crown-6)]2[Fe2(CO)8]. Unfortunately, attempts to convert this salt into Fe2S2(CO)6 were unfruitful. Treatment of [K(18-crown-6)]2[Fe2(CO)8] with S2Cl2 or S8 gave complex mixtures including [Fe2S2(S5)2]2– and intractable solids but no Fe2S2(CO)6. A successful method for the direct synthesis of Fe2S2(CO)6 was inspired by details in the PhD thesis of W. W. Brennessel of the Ellis group, who describes the synthesis of K2Fe(CO)4 from FeBr2 in ~50% yield.20 His method involves treatment of FeBr2 in THF with four equivalents of potassium anthracene at low temperature, followed by carbonylation at 1 atm. The Fe(-II) derivative is proposed to form via reduction of K2Fe2(CO)8 by the fourth equivalent of K(anthracene). This reaction was reproduced. Treatment of the resulting K2Fe-(CO)4 with methanol efficiently afforded KHFe(CO)4,21 which reacted with elemental sulfur to give Fe2S2(CO)6 after standard workup.21 In this way, starting from 500 mg of 57Fe, we prepared 180 mg of 57Fe2S2(CO)6 (11.8% from 57Fe metal) together with 60.8 mg (4.5% yield) of 57Fe3S2(CO)9 (Scheme 1). Repeat synthesis using the same procedure resulted in the yield of 57Fe2S2(CO)6 improving to 371 mg (24.4% from 57Fe metal). The 13C NMR spectra of 57Fe2S2(CO)6 and 57Fe3S2(CO)9 gives 1J(57Fe,13C) = 28.3 and 26.3 Hz, respectively. The most problematic step in the synthesis is the conversion of KHFe(CO)4 into Fe2S2(CO)6, which we estimate proceeded in 30% yield.
Scheme 1. Synthesis of [57Fe2(adt)(CN)2(CO)4]2−a.
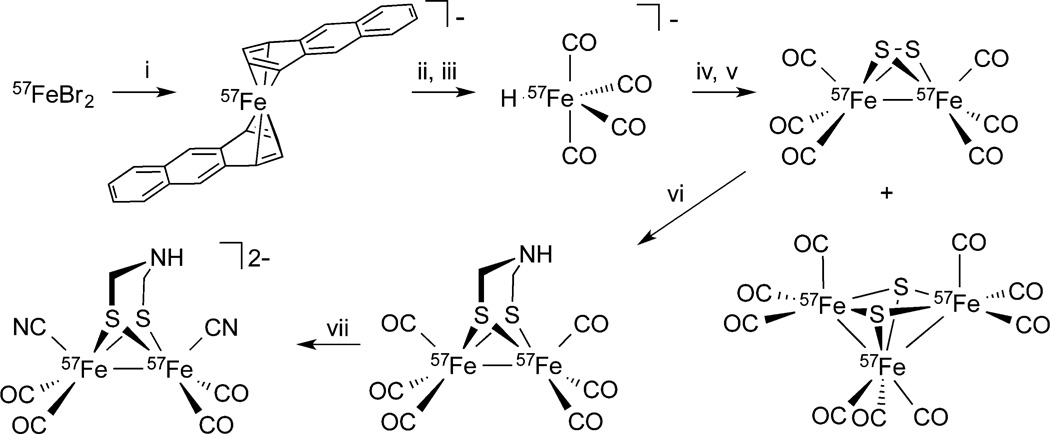
a(i) 4 KC14H10, (ii) CO, (iii) MeOH, (iv) S8, (v) H+, (vi) CH2O, NH4+, (vii) (NEt4)CN.
Conversion of 57Fe2S2(CO)6 to [57Fe2(adt)(CN)2(CO)4]2– requires two steps, which have been described previously for the unlabeled versions of these complexes.22 The first of these steps is the conversion of 57Fe2S2(CO)6 to 57Fe2(adt)(CO)6. This conversion was achieved by reduction of 57Fe2S2(CO)6 with LiBEt3H to give 57Fe2(SLi)2(CO)6, followed by protonation to 57Fe2(SH)2(CO)6 and subsequent adt bridge formation through reaction with a mixture of ammonia and formaldehyde to yield 57Fe2(adt)(CO)6. Conversion of 57Fe2(adt)(CO)6 to [57Fe2(adt)(CN)2(CO)4]2– was achieved by reaction with 2 equiv of (NEt4)CN. The isotopic purity of the anion [57Fe2(adt)(CN)2(CO)4]2– was established by negative ion ESI mass spectrometry (see Supporting Information (SI), Figure S1).
Selective Labeling of HydA1
The insertion of [57Fe2(adt)(CN)2(CO)4]2– into unmaturated HydA1 was monitored by Fourier transform infrared spectroscopy (FT-IR). The precursor undergoes substantial rearrangement upon incorporation into unmaturated HydA1 (Figure S2A and S2B, SI). One CO ligand migrates to the bridging position and the CN− groups shift from apical to basal sites. Furthermore, in a major desymmetrizing event, one of the two previously equivalent Fe sites binds to cysteinyl sulfur, which links the [2Fe]H and [4Fe-4S]H clusters. Under the usual reductive maturation conditions one terminal CO ligand of the distal Fe dissociates affording an open coordination site where substrate and inhibitors can bind. After oxidation with thionin (Figure S2C, SI) and flushing with CO, a pure Hox-CO state is created (Figure S2D, SI). In the Hox-CO state, the [2Fe]H subunit is in a delocalized mixed valence Fe(II)Fe(I) configuration.
In order to realize complementary 57Fe enrichment, in a separate experiment the [4Fe-4S]H cluster was 57Fe-labeled as described in the Experimental Section. In a first step, unfolding and thereby loss of the unlabeled [4Fe-4S]H cluster was observed by subsequent loss of the brownish color of the solution. The [4Fe-4S]H cluster was reconstituted with 57FeCl3 and Na2S, accompanied by recovery of the brownish color. Successful reconstitution was confirmed by activity measurements, UV–vis and EPR spectroscopy (see SI for detailed information).
EPR Characterization
The selective labeling of the two components of the H-cluster with 57Fe greatly simplifies the assignment of the observed pulse EPR signals (see Figure 2). For the hybrid in which the [2Fe]H subcluster is labeled, two spectral features in the HYSCORE spectra can be observed (Figure 2B,C). The correlation ridges in the right-hand section of the spectra (positive frequencies) are assigned to a weakly coupled 57Fe nucleus while the ones in the left-hand section (negative frequencies) originate from a strongly coupled 57Fe nucleus. These signals can both be simulated with axial hyperfine tensors (see Table S1 in the SI). Their Aiso values are 4.4 and 1.3 MHz, respectively, suggesting that one iron in the [2Fe]H subsite has ~4 times more spin density than the other. According to the spin-exchange model describing the electronic structure of Hox-CO (see below), the proximal iron in [2Fe]H has the largest spin density. The obtained hyperfine parameters are in agreement with previously reported EPR data on the [FeFe] H2ases from Desulfovibrio desulfuricans (DdH).13 Earlier Mössbauer studies on the [FeFe] H2ases from Desulfovibriovulgaris Hildenborough (DvH) and Clostridium pasteurianum (CpI) provided the first estimates for the hyperfine 57Fe interactions in the [2Fe]H subsite.23,25 These measurements, however, suffered from overlapping signals from the accessory [4Fe-4S] clusters and are therefore less accurate (see Table S1). The complete hyperfine tensor information on Fe1 and Fe2 as obtained from HYSCORE (Table S1) accurately defines the electronic structure of the binuclear subsite and can be used to validate quantum chemical calculations on the H-cluster properties.
Figure 2.
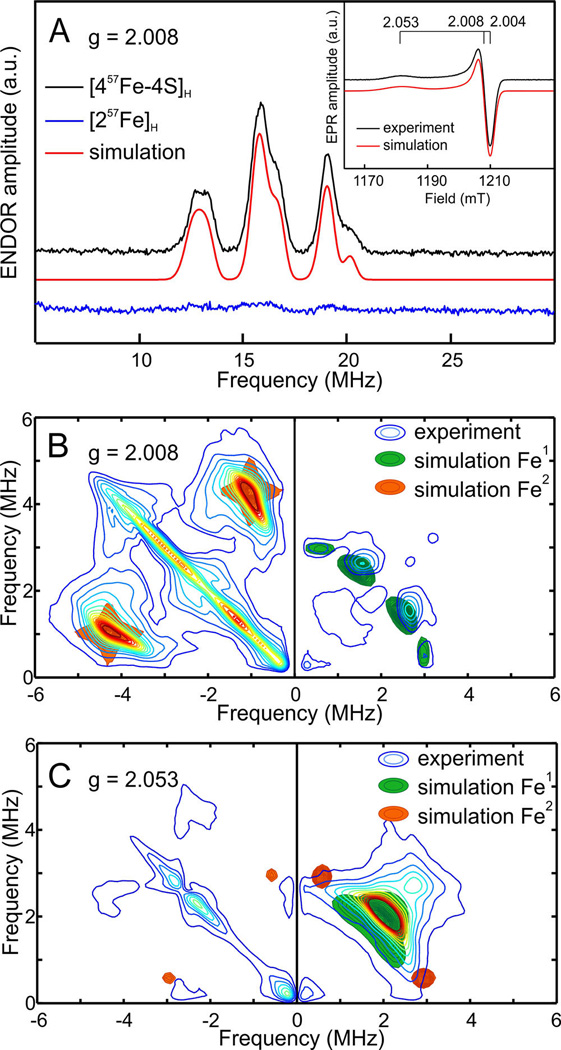
Q-band 57Fe ENDOR and HYSCORE spectra (20 K) of selectively labeled HydA1 Hox-CO recorded at field positions indicated in the EPR spectrum (inset); for experimental parameters see SI. (A) Davies ENDOR of Hox-CO 57Fe labeled at [4Fe-4S]H (black) or [2Fe]H (blue); simulations are indicated in red. (B) and (C) HYSCORE spectra recorded for Hox-CO 57Fe labeled at [2Fe]H at g = 2.008 and g = 2.053 respectively; for all simulation parameters see Table S1.
As described above, it is also possible to selectively label the [4Fe-4S]H subcluster with 57Fe. For this sample in the Hox-CO state, no signal in the HYSCORE spectra was observed. In the ENDOR spectra between 10–20 MHz signals from strongly coupled Fe nuclei are observed. As it is shown in Figure 2A, these signals are not observed when only the [2Fe]H subcluster is labeled. This unequivocally confirms that these signals originate from the [4Fe-4S]H subcluster. As presented in Figure 3, these signals can be simulated with four distinct anisotropic hyperfine interactions corresponding to the four Fe centers in the [4Fe-4S]H subcluster (hyperfine interaction parameters are listed in Table S1). In earlier Mössbauer studies on CpI, these relatively large hyperfine interactions of the formally diamagnetic [4Fe-4S]H subcluster were interpreted as originating from spin density induced by a substantial exchange coupling between the two subclusters.23 The four hyperfine interactions were predicted to be divided in two groups representing the two S = 9/2 Fe(II)Fe(III) pairs which are mutually antiferromagnetically coupled to effective spin S = 0. Later ENDOR studies on DdH confirmed this analysis and showed that the hyperfine interaction of the two groups have opposite signs.13 The current data on HydA1 are fully in line with these studies. The two groups are defined by pair 1 with Aiso = 33.2 MHz (brown) and 30.0 MHz (orange), pair 2 Aiso = 28.0 MHz (blue) and 27.6 MHz (green).
Figure 3.
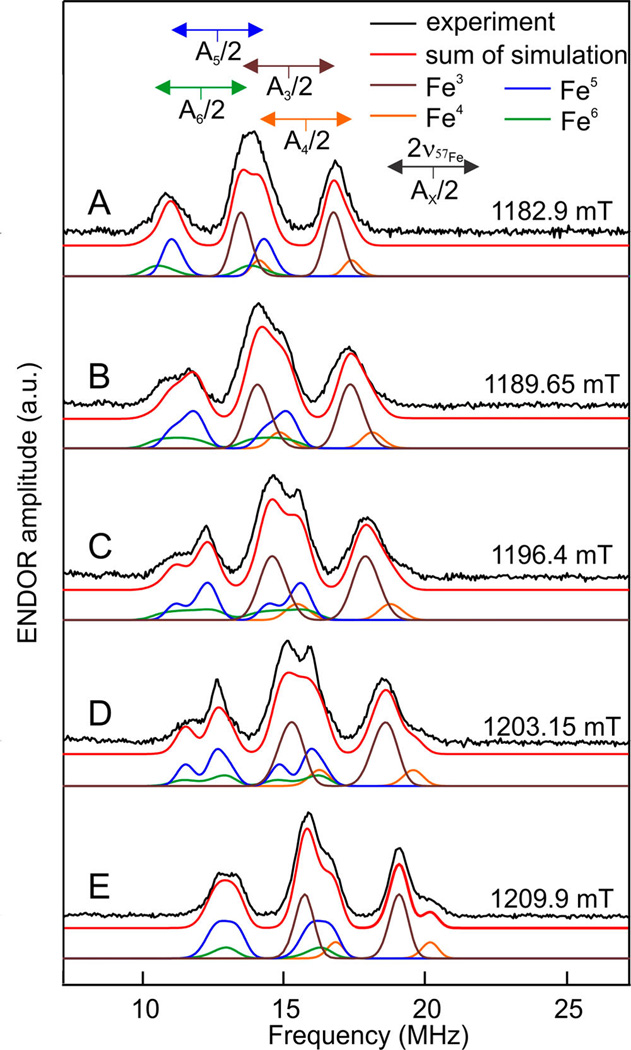
Q-band Davies ENDOR spectra and simulations of Hox-CO HydA1 selectively labeled with 57Fe at the [4Fe-4S]H cluster. Spectra were recorded with an RF pulse of 45 µs, shot repetition time 800 µs, microwave frequency 33.93396 GHz, temperature 20 K at field positions: (A) 1182.9 mT ≈ g1, (B) 1189.65 mT, (C) 1196.4 mT, (D) 1203.15 mT, (E) 1209.9 mT ≈ g2. The black line represents experimental data and the red line the sum of the simulations. The colored lines below each experimental spectrum are the components of the simulation corresponding to the four hyperfine couplings: brown Fe3, orange Fe4, blue Fe5, green Fe6 (see Table S1).
Mössbauer Characterization
The selective 57Fe-labeling of the [2Fe]H site enables the investigation of this specific subsite by Mössbauer spectroscopy. Previous Mössbauer studies on the active [FeFe] H2ases CpI23,24 and DvH25 are complicated by the presence of accessory [4Fe-4S] clusters in addition to the H-cluster. Using our approach of selective labeling, the Mössbauer spectra are simplified and Mössbauer parameters can be obtained without the cosimulation of other 57Fe-components. Additionally, this method enables high concentrations of the sample and therefore high-quality spectra. The Mössbauer spectrum of the [457Fe-4S]H cluster from HydA1 maturated with unlabeled [Fe2(adt)(CN)2(CO)4]2– in the Hox-CO state is shown in Figure 4A. The counterpart spectrum, the 57Fe-labeled [2Fe]H site in the Hox-CO state, is presented in Figure 4B. Both spectra are quite simple and can be simulated with relatively few components. Figure 4C displays a superimposition of the simulated spectra 4A and 4B. It clearly shows the overlap between the signals from the [4Fe-4S]H cluster and the [2Fe]H site, which would require 9 parameters for its simulation (apart from the background contributions).
Figure 4.
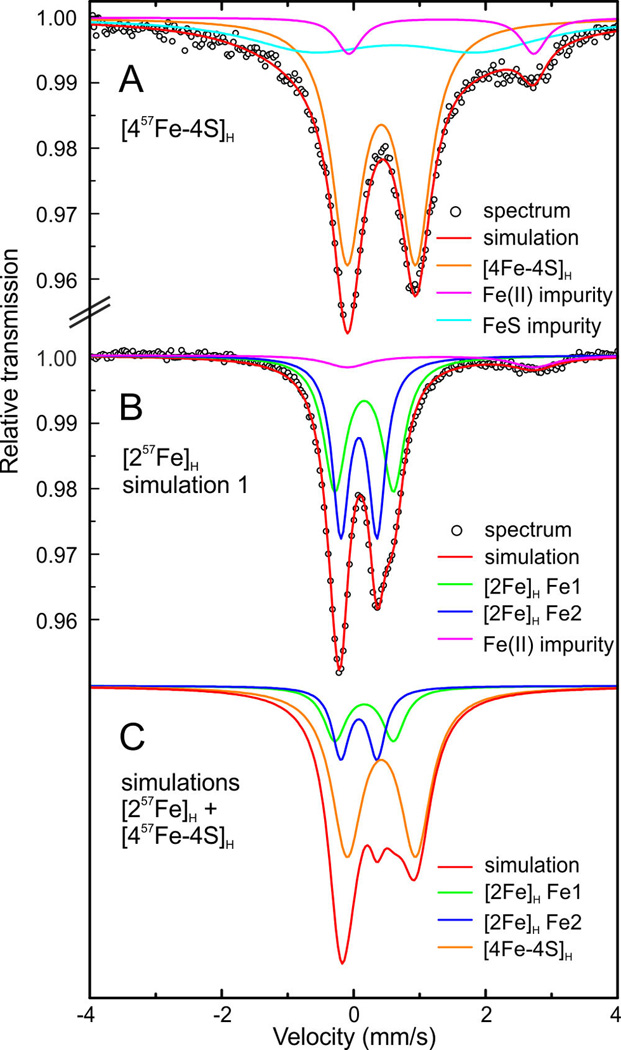
(A) Mössbauer spectrum and simulations of Hox-CO HydA1 selectively labeled with 57Fe at the [4Fe-4S]H subcluster. (B) Mössbauer spectrum and simulations of Hox-CO HydA1 selectively labeled with 57Fe at the [2Fe]H subcluster. (C) Superimposition of the simulations of the 57Fe-labeled [2Fe]H subunit and the [4Fe-4S]H cluster, ratio 0.5:1. All spectra were measured at 160 K in zero magnetic field.
The isomer shift (δ = 0.42 mm/s) and the quadrupole splitting (ΔEQ = 1.04 mm/s) found for the [457Fe-4S]H cluster are typical for oxidized [4Fe-4S] clusters.26 The spectrum of the 57Fe-labeled [2Fe]H site can be analyzed assuming two nonequivalent Fe sites. A small amount of an Fe(II) impurity is apparent as well. The data can be fitted assuming a slight nonequivalence either more pronounced in the quadrupole splitting (simulation 1, Figure 4B) or in the isomer shift (simulation 2, Figure S5). Simulation 1 (Figure 4B) is slightly favored. Taking into account the different ligands coordinating the two irons one would expect clear differences in quadrupole splitting whereas the isomer shift is relatively insensitive to electron density differences for low valence iron centers.27 Simulation 1 is characterized by the isomer shifts δ1(1) = 0.16 mm/s, δ1(2) = 0.08 mm/s and quadrupole splittings of ΔEQ1(1) = 0.89 mm/s, ΔEQ1(2) = 0.55 mm/s. The parameters of all simulations can be found in Table S2 in the SI. The fitted Mössbauer parameters are not identical to those obtained previously by Pereira et al. for DvH (δ1(1) = 0.17 mm/s, δ1(2) = 0.13 mm/s and ΔEQ1(1) = 0.70 mm/s, ΔEQ1(2) = 0.65 mm/s, see also Table S2), but lie in the same range that is consistent with low-spin iron in a low oxidation state. The slight differences between the parameters obtained in this work and those by Pereira et al. could originate from the lower accuracy in the latter study caused by the overlapping F-cluster signals but it is also possible that the H-cluster of [FeFe] H2ases in different organisms (DvH vs HydA1) slightly different electronic structures. To verify this, DvH could be maturated using the method described here to obtain a Mössbauer spectrum from the selectively labeled [2Fe]H site. This would also pave the way to study in detail the elusive “inactive” oxidation states in DvH Hox-air and Htrans as well as the “regular” active oxidation states Hox and Hred.
NRVS Characterization
The [257Fe]H-HydA1 Hox-CO sample was also analyzed by nuclear resonance vibrational spectroscopy (NRVS). This technique is exclusively responsive to vibrations affecting the 57Fe site. Previous attempts to record NRVS spectra of [FeFe] H2ase (CpI)11 were hampered by signals from other 57Fe labeled components, and not purely originating from the [2Fe]H subcluster (see Figure 6). In this study, NRVS spectra of (Et4N)2[57Fe2(adt)(CN)2(CO)4] and [257Fe]H HydA1 Hox-CO were obtained (Figure 5). The NRVS spectrum of the precursor displays intense bands in the regions assigned to Fe-CO stretching and Fe–C–O bending (six bands between 490 and 650 cm−1) and the Fe-CN region (two bands between 400 and 500 cm−1).28,29 Comparing the spectrum of the precursor to that for the HydA1 Hox-CO spectrum, one can clearly see that the Fe–C bands are strongly affected, with Fe- CO modes being (on average) red-shifted and Fe-CN modes being blue-shifted. The Fe-CO/-CN shift is consistent with major changes in the primary coordination sphere of the Fe centers upon insertion into the enzyme and conversion to Hox-CO.
Figure 6.
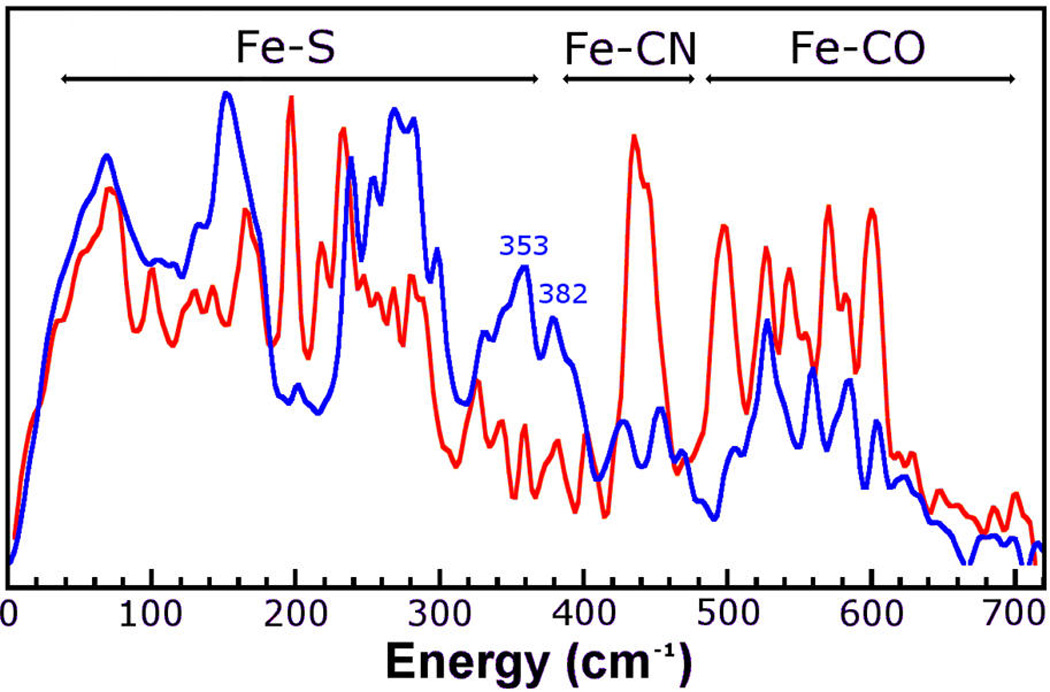
NRVS spectrum of HydA1 Hox-CO of this work (red) and CpI from previous NRVS on hydrogenase (mixed states, blue).11 The assignments are not pure vibrational modes.
Figure 5.
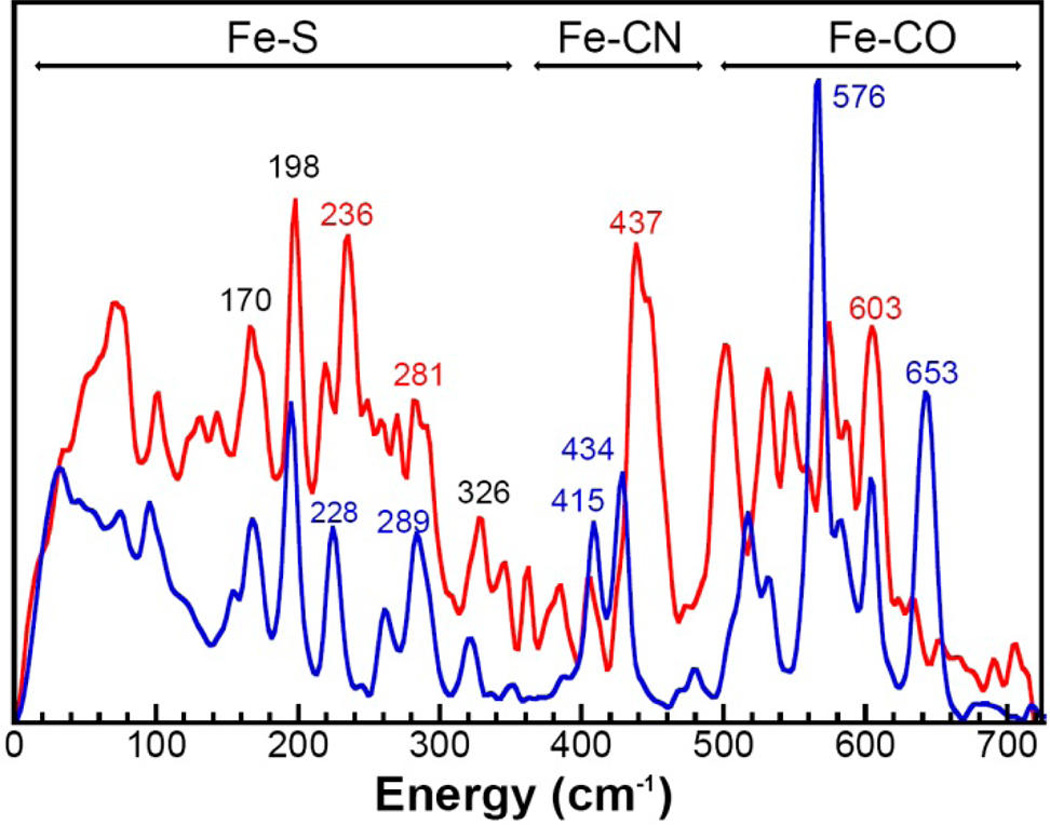
NRVS spectrum of [257Fe]H HydA1 Hox-CO (red) and the precursor [57Fe2(adt)(CN)2(CO)4]2– (blue). The peaks labeled in black are the same energy ±2 cm−1 in both spectra.
The notable band at 653 cm−1 is assigned as having significant contributions from a diequatorial Fe(CO)2 stretch–bend by comparison with assignments of previous model complexes.29–31 This band is absent in the [257Fe]H HydA1 Hox-CO spectrum as there are no longer two CO ligands in the basal positions of either iron center.31 The high intensity of the Fe-CO band at 576 cm−1 in the [57Fe2(adt)(CN)2(CO)4]2− spectrum is due to the high symmetry of this complex.
When comparing the low energy portion of the two spectra, it is clear that the bands at 170, 198, and 326 cm−1 are largely unmoved and there are only minor shifts for other bands in the Fe–S region. This is an indication that there is little change in the Fe–S geometry upon incorporation of the precursor into the enzyme. A common feature of the NRVS of [4Fe-4S] clusters are bands due to Fe–S bending and breathing at 150 cm−1.30 The absence of any strong band at 150 cm−1 demonstrates that there is no significant 57Fe incorporation into the [4Fe-4S]H cluster, verifying the results from the Mössbauer spectroscopy. Further discussion of bands and their assignments can be found in the Supporting Information.
The benefits of the selective labeling by the artificial maturation process are illustrated also by the NRVS measurements. The previously reported NRVS spectrum was recorded on CpI, which was only partially labeled by incubation/activation of the 56Fe-labeled inactive apo protein with 57Fe-enriched maturation proteins (Figure 6).11 The CpI spectrum has characteristic features at 353 and 382 cm−1 in the Fe–S region (300–400 cm−1) assigned to Fe–S bands of oxidized [4Fe-4S]2+ clusters. These bands are indicative of unselective labeling of a [4Fe-4S] cluster. For the [257Fe]H HydA1 Hox-CO spectrum, only low intensity features are present in this region. Selective labeling is also evident in a notable increase in the intensity of the Fe-CN and Fe-CO signals in the 400–600 cm−1 region.
CONCLUSIONS
In summary, the work demonstrates the selective 57Fe-labeling of the HydA1 enzyme at both the [2Fe]H subunit and the subcluster [4Fe-4S]H. The route to 57Fe-labeled iron carbonyls is described using only conventional Schlenk techniques. The method is clearly adaptable to labeling of other derivatives, perhaps other hydrogenases, and their synthetic analogues.32 Focusing on the protein prepared in the Hox-CO state, all spectroscopic measurements confirm the selectivity of the labeling.
The 57Fe hyperfine interactions from the [2Fe]H and [4Fe-4S]H subclusters in HydA1 obtained from HYSCORE and ENDOR spectroscopies are consistent with those obtained earlier from the H-cluster of the H2ase DdH although slight species dependent variations were observed. The overall electronic structures of Hox-CO of DdH and HydA1 seem therefore virtually identical. The Mössbauer parameters from the [2Fe]H subsite in HydA1 revealed an intrinsic ambiguity (i.e., two equivalent combinations of isomer shift and quadrupole splitting) that was not detected in earlier studies on DvH.
NRVS analysis demonstrated that through this selective 57Fe labeling the intensity of signals from the key [2Fe]H subunit can be improved significantly. This improvement opens up the possibility of new modes involving the bridging CO, hydrides, or Fe–Fe interactions being identified. This future effort would require suitable isotopic labeling experiments of other atoms of the [2Fe]H subunit and complementary simulations. These labeling experiments are facilitated by the frugal use of common reagents in this synthetic method, which allows easy substitution for their isotopically labeled counterparts 34S8, 13CO, and 13CN–.33 Such isotope labeling of atoms bound directly to 57Fe will facilitate assignment of the NRVS spectrum of catalytically significant states.
Further work is underway to spectroscopically characterize the “active” states of the enzyme, specifically Hox, Hred, and Hsred. Through selective labeling the overlapping 57Fe ENDOR spectra of the two subclusters in Hox13,34 can now be disentangled. The effects of, e.g., the bridging CO ligand and the exchange coupling to the [4Fe-4S]H subcluster can now for the first time be studied on selectively labeled H-clusters. In addition, also “inactive” precursors [57Fe2(pdt)(CN)2(CO)4]2– (pdt2– = propanedithiolate = [(SCH2)2CH2]2–) and [57Fe2(odt)(CN)2(CO)4]2– (odt2– = oxadithiolate = [(SCH2)2O]2–) will be studied in 57Fe labeled form as a product of this work. Although largely inactive, these variants show “trapped” intermediates that may be related to the catalytic cycle.35
EXPERIMENTAL SECTION
General Considerations
Unless otherwise indicated, reactions were conducted using standard Schlenk techniques or in a glovebox under an N2 atmosphere at room temperature with stirring. Synthesis of 57FeBr2 from 57Fe,36 57Fe2(adt)(CO)6 from 57Fe2S2(CO)6,37 and (Et4N)2[57Fe2(adt)(CN)2(CO)4] from 57Fe2(adt)(CO)6,14 were achieved by modification of literature procedures for the equivalent unlabeled complexes. Details can be found in the Supporting Information.
Synthesis of 57Fe2S2(CO)6
A potassium anthracene solution was prepared by stirring thinly sliced potassium metal (1.41 g, 36.2 mmol) and anthracene (6.44 g, 36.1 mmol) in THF (120 mL) overnight using a glass covered stir bar to give a deep blue solution of potassium anthracene. In a separate flask 57FeBr2 (1.82 g, 8.40 mmol) was also stirred overnight in THF (100 mL) giving a suspension of yellow solid in a pale orange solution. Both solutions were chilled to −77 °C, and the 57FeBr2 solution was cannula transferred into the potassium anthracene solution over a period of 10 min. The solution was allowed to warm to room temperature over a period of 5 h, resulting in a color change from blue to very dark red/brown indicating the formation of K[Fe(anthracene)2]. The solution was then filtered through Celite (the solution contains very fine particles that easily block glass frits and even block up Celite if too much pressure is applied). The volume of the filtrate was reduced to ~150 mL under a vacuum. The solution was cooled to −77 °C, and the headspace was replaced by an atmosphere of CO. The solution was then allowed to warm to room temperature over a period of 10 h under a constant 1.05 atm of CO. Once warmed to room temperature the solution is a dark color with a significant amount of pale precipitate. All solvent was removed to give a brown solid containing the desired K2Fe(CO)4. This solid was cooled to −77 °C, and treated with MeOH (50 mL) added over the course of 20 min. The initially brown/green solution changed to dark red as the mixture was warmed to room temperature over the course of an hour, indicating the formation of KHFe(CO)4. The solution was filtered through Celite, and any remaining solid was washed with MeOH. The volume of the solution was reduced to ~10 mL, with the aim of keeping as much of the red color in solution, not coprecipitating with the colorless solids, which precipitate upon this volume reduction. The solution was cooled to 0 °C, and solid potassium hydroxide (1.30 g, 23.2 mmol) was added against a positive pressure of argon, followed by the addition of degassed water (15 mL). After 5 min of stirring at 0 °C, elemental sulfur (1.29 g, 40.2 mmol) was added directly against a flow of argon. The mixture was stirred at 0 °C for 1.5 h before degassed water (20 mL) and hexane (50 mL) were added. Solid NH4Cl (3.22 g, 60.2 mmol) was added against a flow of argon, and a needle with attached bubbler was attached to the flask and the solution stirred for 16 h. Subsequent steps were performed in air. Stirring was ceased and the red hexane layer was decanted and reserved. The remaining aqueous solution was extract with hexane (4 × 20 mL) until no red color remained in the hexane layer, with the extracts then added to the previously reserved solution. The solution was passed through a short silica plug (2 cm) and the filtrate then evaporated on a rotary evaporator (Fe2S2(CO)6 readily sublimes under oil pump vacuum at room temperature). An extract of the resulting red oil in hexane (3 mL) was chromatographed on a silica gel column (2 cm × 30 cm), eluting with hexane. The first orange band was identified as 57Fe2S2(CO)6 (180 mg, 0.520 mmol, 12.4% from 57FeBr2) and the second dark red band as 57Fe3S2(CO)9 (60.8 mg, 4.5% from 57FeBr2). The preparation was repeated with improved handling giving an improved yield of 57Fe2S2(CO)6 (371 mg, 1.07 mmol, 25.4% from 57FeBr2) and a small amount of 57Fe3S2(CO)9 (15 mg, 0.031 mmol, 1.1% from 57FeBr2) 57Fe2S2(CO)6: IR (pentane): νC≡O = 2085 (m), 2045 (s), 2008 (s), 1993 (w); 13C NMR (600 MHz, d8-Toluene): δ 208.66 (d, JC–Fe = 28.3 Hz, CO); 57Fe3S2(CO)9: IR (pentane): νC≡O = 2063 (s), 2045 (s), 2024(s), 2008 (m), 1988 (w); 13C NMR (600 MHz, d8-Toluene): δ 209.23 (d, JC–Fe = 26.3 Hz, CO). MS ESI- (m/z) 515.6 ((Et4N)[57Fe2(adt)(CN)2(CO)4]−) IR (acetonitrile): νC≡N = 2075 (m) νC≡O = 1968 (s), 1924 (s), 1891 (s), 1873 (sh).
Preparation of 57Fe-Labeled HydA1
All samples were handled strictly anaerobically. All buffers were carefully degassed. Unmaturated HydA1 was prepared as described by Kuchenreuther et al.38 In order to selectively label the [4Fe-4S]H cluster with 57Fe, unmaturated HydA1 was treated with 6 M guanidinium chloride in 100 mM Tris/ HCl pH, 8.0, 20 mM EDTA to have a final concentration of 100–200 µM protein. After 30 min of incubation, samples were buffer exchanged into 100 mM Tris/HCl, pH 8.0, 150 mM NaCl using PD10 desalting columns (GE Healthcare). For the reconstitution reaction, a protocol similar to literature procedures was used.39 57FeCl3 was prepared from 57Fe powder by dissolving in concentrated hydrochloric acid, evaporation of the solvent and resolubilizing in distilled water. The protein solution (50–70 µM) was incubated with 5 mM DDT for 5 min and slightly stirred. 10-fold excess of 57FeCl3 solution was added stepwise to the reaction mixture within 20 min. Thereafter, 10-fold excess of an aqueous solution of Na2S was added stepwise. The reaction mixture turned from reddish (after addition of 57FeCl3) to a brownish color typical for unmaturated HydA1. After removing excess of ions using PD10 desalting columns, samples were concentrated and kept frozen until use.
In order to selectively label unmaturated HydA1 on the [2Fe]H subcluster, it was incubated with a 2-fold excess of (Et4N)2[57Fe2(adt)-(CN)2(CO)4] following recent protocols.8,10 In order to obtain the Hox-CO inhibited state, samples were first oxidized with thionine and then flushed with CO for 20 min (Figure S2, SI). The redox states of all samples were verified using FT-IR spectroscopy.
EPR Analysis
Field swept Q-band EPR spectra were recorded in the pulsed mode using FID detection after a 1 µs π/2 excitation pulse. After a pseudomodulation transformation, the spectra obtained in this way are comparable to those using CW EPR.40
Electron nuclear double resonance (ENDOR) was used to study the 57Fe hyperfine interactions. In this investigation the Davies ENDOR sequence was used: [π]-td1-[RF]-td2-[π/2]-τ-[π]-τ-(ESE).41,42 The excitation of nuclear spin transitions is detectable through an increase in the inverted ESE intensity. The microwave preparation pulse was set to 140 ns, whereas the length of the radiofrequency (RF) pulse was 45 µs and the shot repetition time 0.8 ms.
Q-band hyperfine sublevel correlation spectroscopy (HYSCORE) experiments were performed using the standard HYSCORE pulse sequence: [π/2]-τ-[π/2]-t1-[π]-t2-[π/2]-τ-(ESE).42,43 The length of the microwave [π/2] and [π] pulses was adjusted to the maximum available microwave power (3 W). The delay between the first two pulses (τ) was 352 ns. The starting t1 and t2 delays in all measurements were 100 ns and were changed by a step of 16 ns. To suppress the effect of unwanted echoes, a four step phase cycling of the microwave pulses was used.
Q-band experiments were performed on a Bruker ELEXYS E580 spectrometer with a SuperQ-FT microwave bridge and a home-built resonator described earlier.44 Cryogenic temperatures (20 K) were obtained by an Oxford CF935 flow cryostat. ENDOR experiments were performed using the random (stochastic) acquisition technique and making use of a 300W ENI 300 L RF amplifier. A Trilithic H4LE35-3-AA-R high-power low pass filter (cut off frequency around 35 MHz) was used to suppress the “harmonics” of the 1H ENDOR signals.
All the simulations were performed in an EasySpin based program written in the MATLAB environment.45 ENDOR spectra were simulated using the “salt” routine and the frequency domain calculations of HYSCORE spectra were simulated using the “saffron” routine. Signals corresponding to the different nuclei were simulated separately in order to reduce computing time.
Mössbauer Analysis
Mössbauer spectra were recorded on a conventional spectrometer with alternating constant acceleration of the γ-source. The sample temperature was maintained constant in an Oxford Instruments Variox cryostat. Isomer shifts are quoted relative to iron metal at 300 K. Mössbauer spectra were collected for frozen aqueous solution samples (1–2 mM, 650 µL) at 160 K and fitted using the program MFIT (written by Eckhard Bill, Max Planck Institute for Chemical Energy Conversion) with Lorentzian doublets.
NRVS
Nuclear resonance vibrational spectroscopy (NRVS) of [257Fe]H HydA1 Hox-CO and the precursor (Et4N)2[57Fe2(adt)-(CN)2(CO)4] were measured with a coldfinger helium cryostat maintained at 10 K. The real sample temperatures were obtained by the imbalance of the spectra and ranged from 40–60 K. NRVS measurement was performed at SPring-8, BL09XU and BL19LXU using C beam mode. A high heat load LN2-cooled Si(1,1,1) double crystal monochromators followed by a high resolution monochromators of Ge(4,2,2) and two Si(9,7,5) were used to achieve a 0.8 meV energy resolution. The delayed nuclear and Kα fluorescence were measured with a 2 × 2 APD array, and processed with the associated electronics.
Supplementary Material
Acknowledgments
We thank Annika Gurowski and Agnes Stoer for their excellent technical assistance, Eckhard Bill and Bernd Mienert for their help with the Mössbauer spectroscopy, and Lars Lauterbach, Leland Gee, Yoshitaka Yoda and Kenji Tamasaku for their expertise in NRVS. This project was supported by the National Institutes of Health (GM061153, GM-65440), the Max-Planck Society, the Deutsche Forschungsgemeinschaft (DIP project LU315/17–1), and US Department of Education (CFDA-84.200A). The NRVS experiments were performed at SPRING-8 BL09XU (JASRI proposed no.2014B1032) and BL19LXU (RIKEN proposal no 20140033).
Footnotes
ASSOCIATED CONTENT
Supporting Information
Spectra and preparative details. The Supporting Information is available free of charge on the ACS Publications website at DOI: 10.1021/jacs.5b03270.
Notes
The authors declare no competing financial interest.
REFERENCES
- 1.Frey M. ChemBioChem. 2002;3:153. doi: 10.1002/1439-7633(20020301)3:2/3<153::AID-CBIC153>3.0.CO;2-B. [DOI] [PubMed] [Google Scholar]
- 2.Happe T, Naber JD. Eur. J. Biochem. 1993;214:475. doi: 10.1111/j.1432-1033.1993.tb17944.x. [DOI] [PubMed] [Google Scholar]
- 3.Swanson KD, Ratzloff MW, Mulder DW, Artz JH, Ghose S, Hoffman A, White S, Zadvornyy OA, Broderick JB, Bothner B, King PW, Peters JW. J. Am. Chem. Soc. 2015;137:1809. doi: 10.1021/ja510169s. [DOI] [PubMed] [Google Scholar]; Mulder DW, Ratzloff MW, Bruschi M, Greco C, Koonce E, Peters JW, King PW. J. Am. Chem. Soc. 2014;136:15394. doi: 10.1021/ja508629m. [DOI] [PubMed] [Google Scholar]; Knörzer P, Silakov A, Foster CE, Armstrong FA, Lubitz W, Happe T. J. Biol. Chem. 2012;287:1489. doi: 10.1074/jbc.M111.305797. [DOI] [PMC free article] [PubMed] [Google Scholar]
- 4.Peters JW, Broderick JB. Annu. Rev. Biochem. 2012;81:429. doi: 10.1146/annurev-biochem-052610-094911. [DOI] [PubMed] [Google Scholar]; Shepard EM, Mus F, Betz JN, Byer AS, Duffus BR, Peters JW, Broderick JB. Biochemistry. 2014;53:4090. doi: 10.1021/bi500210x. [DOI] [PubMed] [Google Scholar]
- 5.Happe T, Kaminski A. Eur. J. Biochem. 2002;269:1022. doi: 10.1046/j.0014-2956.2001.02743.x. [DOI] [PubMed] [Google Scholar]; Mulder DW, Boyd ES, Sarma R, Lange RK, Endrizzi JA, Broderick JB, Peters JW. Nature. 2010;465:248. doi: 10.1038/nature08993. [DOI] [PubMed] [Google Scholar]
- 6.Nicolet Y, de Lacey AL, Vernede X, Fernandez VM, Hatchikian EC, Fontecilla-Camps JC. J. Am. Chem. Soc. 2001;123:1596. doi: 10.1021/ja0020963. [DOI] [PubMed] [Google Scholar]
- 7.Lemon BJ, Peters JW. Biochemistry. 1999;38:12969. doi: 10.1021/bi9913193. [DOI] [PubMed] [Google Scholar]; Berggren G, Adamska A, Lambertz C, Simmons TR, Esselborn J, Atta M, Gambarelli S, Mouesca JM, Reijerse E, Lubitz W, Happe T, Artero V, Fontecave M. Nature. 2013;499:66. doi: 10.1038/nature12239. [DOI] [PMC free article] [PubMed] [Google Scholar]
- 8.Esselborn J, Lambertz C, Adamska-Venkatesh A, Simmons T, Berggren G, Noth J, Siebel J, Hemschemeier A, Artero V, Reijerse E, Fontecave M, Lubitz W, Happe T. Nat. Chem. Biol. 2013;9:607. doi: 10.1038/nchembio.1311. [DOI] [PMC free article] [PubMed] [Google Scholar]
- 9.Adamska-Venkatesh A, Simmons TR, Siebel JF, Artero V, Fontecave M, Reijerse E, Lubitz W. Phys. Chem. Chem. Phys. 2015;17:5421. doi: 10.1039/c4cp05426a. [DOI] [PubMed] [Google Scholar]
- 10.Siebel JF, Adamska-Venkatesh A, Weber K, Rumpel S, Reijerse E, Lubitz W. Biochemistry. 2015;54:1474. doi: 10.1021/bi501391d. [DOI] [PubMed] [Google Scholar]
- 11.Kuchenreuther JM, Guo Y, Wang H, Myers WK, George SJ, Boyke CA, Yoda Y, Alp EE, Zhao J, Britt RD, Swartz JR, Cramer SP. Biochemistry. 2012;52:818. doi: 10.1021/bi301336r. [DOI] [PMC free article] [PubMed] [Google Scholar]
- 12.Kuchenreuther JM, George SJ, Grady-Smith CS, Cramer SP, Swartz JR. PLoS One. 2011;6:e20346. doi: 10.1371/journal.pone.0020346. [DOI] [PMC free article] [PubMed] [Google Scholar]
- 13.Silakov A, Reijerse EJ, Albracht SPJ, Hatchikian EC, Lubitz W. J. Am. Chem. Soc. 2007;129:11447. doi: 10.1021/ja072592s. [DOI] [PubMed] [Google Scholar]
- 14.Li H, Rauchfuss TB. J. Am. Chem. Soc. 2002;124:726. doi: 10.1021/ja016964n. [DOI] [PubMed] [Google Scholar]
- 15.Wildermuth E, Stark H, Friedrich G, Ebenhöch FL, Kühborth B, Silver J, Rituper R. Ullmann’s Encyclopedia of Industrial Chemistry. Weinheim: Wiley-VCH Verlag GmbH & Co. KGaA; 2000. [Google Scholar]
- 16.Seel F. In: Handbook of Preparative Inorganic Chemistry. 2nd. Brauer G, editor. New York: Academic Press; 1965. p. 1741. [Google Scholar]
- 17.Bernard B, Daniels L, Hance R, Hutchinson B. Synth. React. Inorg. Met.-Org. Chem. 1980;10:1. [Google Scholar]
- 18.Rameshkumar C, Periasamy M. Organometallics. 2000;19:2400. [Google Scholar]; Devasagayaraj A, Periasamy M. Transition Metal Chem. 1991;16:503. [Google Scholar]
- 19.Brennessel WW, Jilek RE, Ellis JE. Angew. Chem. Int. Ed. 2007;46:6132. doi: 10.1002/anie.200701353. [DOI] [PubMed] [Google Scholar]
- 20.Brennessel WW. PhD. Dissertation. University of Minnesota: 2009. [Google Scholar]
- 21.Brandt PF, Lesch DA, Stafford PR, Rauchfuss TB. Inorg. Synth. 1997;31:112. [Google Scholar]
- 22.Mack AE, Rauchfuss TB. Inorg. Synth. 2011;35:142. [Google Scholar]
- 23.Popescu CV, Münck E. J. Am. Chem. Soc. 1999;121:7877. [Google Scholar]
- 24.Rusnak FM, Adams MWW, Mortenson LE, Münck E. J. Biol. Chem. 1987;262:38. [PubMed] [Google Scholar]
- 25.Pereira AS, Tavares P, Moura I, Moura JJG, Huynh BH. J. Am. Chem. Soc. 2001;123:2771. doi: 10.1021/ja003176+. [DOI] [PubMed] [Google Scholar]
- 26.Middleton P, Dickson DPE, Johnson CE, Rush JD. Eur. J. Biochem. 1978;88:135. doi: 10.1111/j.1432-1033.1978.tb12430.x. [DOI] [PubMed] [Google Scholar]; Antonkine ML, Koay MS, Epel B, Breitenstein C, Gopta O, Gärtner W, Bill E, Lubitz W. Biochim. Biophys. Acta. 2009;1787:995. doi: 10.1016/j.bbabio.2009.03.007. [DOI] [PubMed] [Google Scholar]; Beinert H, Holm RH, Münck E. Science. 1997;277:653. doi: 10.1126/science.277.5326.653. [DOI] [PubMed] [Google Scholar]
- 27.Gütlich P, Bill E, Trautwein AX. Mössbauer Spectroscopy and Transition Metal Chemistry. Berlin: Springer; 2011. [Google Scholar]
- 28.Kamali S, Wang H, Mitra D, Ogata H, Lubitz W, Manor BC, Rauchfuss TB, Byrne D, Bonnefoy V, Jenney FE, Adams MWW, Yoda Y, Alp E, Zhao J, Cramer SP. Angew. Chem. Int. Ed. 2013;52:724. doi: 10.1002/anie.201204616. [DOI] [PMC free article] [PubMed] [Google Scholar]
- 29.Galinato MGI, Whaley CM, Lehnert N. Inorg. Chem. 2010;49:3201. doi: 10.1021/ic9022135. [DOI] [PMC free article] [PubMed] [Google Scholar]
- 30.Kuchenreuther JM, Guo Y, Wang H, Myers WK, George SJ, Boyke CA, Yoda Y, Alp EE, Zhao J, Britt RD, Swartz JR, Cramer SP. Biochemistry. 2013;52:818. doi: 10.1021/bi301336r. [DOI] [PMC free article] [PubMed] [Google Scholar]
- 31.Guo Y, Wang H, Xiao Y, Vogt S, Thauer RK, Shima S, Volkers PI, Rauchfuss TB, Pelmenschikov V, Case DA, Alp EE, Sturhahn W, Yoda Y, Cramer SP. Inorg. Chem. 2008;47:3969. doi: 10.1021/ic701251j. [DOI] [PMC free article] [PubMed] [Google Scholar]
- 32.Tard C, Pickett CJ. Chem. Rev. 2009;109:2245. doi: 10.1021/cr800542q. [DOI] [PubMed] [Google Scholar]
- 33.Gloaguen F, Lawrence JD, Schmidt M, Wilson SR, Rauchfuss TB. J. Am. Chem. Soc. 2001;123:12518. doi: 10.1021/ja016071v. [DOI] [PubMed] [Google Scholar]
- 34.Kuchenreuther JM, Myers WK, Suess DLM, Stich TA, Pelmenschikov V, Shiigi SA, Cramer SP, Swartz JR, Britt RD, George SJ. Science. 2014;343:424. doi: 10.1126/science.1246572. [DOI] [PMC free article] [PubMed] [Google Scholar]
- 35.Adamska-Venkatesh A, Krawietz D, Siebel J, Weber K, Happe T, Reijerse E, Lubitz W. J. Am. Chem. Soc. 2014;136:11339. doi: 10.1021/ja503390c. [DOI] [PubMed] [Google Scholar]
- 36.Winter G, Thompson DW, Loehe JR. Inorganic Synthesis. Hoboken, NJ: John Wiley & Sons, Inc.; 2007. p. 99. [Google Scholar]
- 37.Stanley JL, Rauchfuss TB, Wilson SR. Organometallics. 2007;26:1907. doi: 10.1021/om0611150. [DOI] [PMC free article] [PubMed] [Google Scholar]
- 38.Kuchenreuther JM, Grady-Smith CS, Bingham AS, George SJ, Cramer SP, Swartz JR. PLoS One. 2010;5:e15491. doi: 10.1371/journal.pone.0015491. [DOI] [PMC free article] [PubMed] [Google Scholar]
- 39.Rubach JK, Brazzolotto X, Gaillard J, Fontecave M. FEBS Lett. 2005;579:5055. doi: 10.1016/j.febslet.2005.07.092. [DOI] [PubMed] [Google Scholar]; Mulder DW, Ortillo DO, Gardenghi DJ, Naumov AV, Ruebush SS, Szilagyi RK, Huynh B, Broderick JB, Peters JW. Biochemistry. 2009;48:6240. doi: 10.1021/bi9000563. [DOI] [PubMed] [Google Scholar]
- 40.Hyde JS, Pasenkiewicz-Gierula M, Jesmanowicz A, Antholine WE. Appl. Magn. Reson. 1990;1:483. [Google Scholar]
- 41.Davies ER. Phys. Lett. A. 1974;47:1. [Google Scholar]
- 42.Schweiger A, Jeschke G. Principles of Pulse Electron Paramagnetic Resonance. Oxford: Oxford University Press; 2001. [Google Scholar]
- 43.Höfer P, Grupp A, Nebenführ H, Mehring M. Chem. Phys. Lett. 1986;132:279. [Google Scholar]; Shane JJ, Höfer P, Reijerse EJ, de Boer E. J. Magn. Reson. 1992;99:596. [Google Scholar]
- 44.Reijerse E, Lendzian F, Isaacson R, Lubitz W. J. Magn. Reson. 2012;214:237. doi: 10.1016/j.jmr.2011.11.011. [DOI] [PubMed] [Google Scholar]
- 45.Stoll S, Schweiger A. J. Magn. Reson. 2006;178:42. doi: 10.1016/j.jmr.2005.08.013. [DOI] [PubMed] [Google Scholar]
Associated Data
This section collects any data citations, data availability statements, or supplementary materials included in this article.


