

Summary
The role of microRNA in the regulation of encephalitogenic T‐cell development is of interest in understanding the pathogenesis of multiple sclerosis (MS). Direct binding of microRNAs to their target mRNAs usually suppresses gene expression and facilitates mRNA degradation. In this study, we observed that the expression of several microRNAs was significantly altered in patients with MS. Interestingly, the expression of miR‐140‐5p, among other microRNAs, was significantly decreased in the peripheral blood mononuclear cells of patients with MS, and this microRNA may regulate encephalitogenic T helper type 1 (Th1) cell differentiation. The expression level of miR‐140‐5p was inversely correlated with disease severity with greater reduction in relapsing disease compared with remitting disease. Transfection of synthetic miR‐140‐5p in peripheral blood mononuclear cells suppressed encephalitogenic Th1 differentiation. Signal transducer and activator of transcription 1 (STAT1) was the functional target of miR‐140‐5p – transfection of the synthetic miR‐140‐5p suppressed activation of STAT1 and the expression of its downstream target, T‐bet. Our results suggested that miR‐140‐5p is probably involved in the regulation of encephalitogenic T cells in the pathogenesis of MS.
Keywords: cell differentiation, microRNA, miR‐140‐5p, multiple sclerosis, Th1/Th2 cells
Introduction
Multiple sclerosis (MS) is an autoimmune demyelinating and neurodegenerative disease of the central nervous system. In MS, the autoreactive lymphocytes cross the blood–brain barrier, prompting an inflammatory response that leads to demyelination and plaque formation, resulting in neurological dysfunction.1, 2, 3 Many studies have studied the role of CD4 T cells in the pathogenesis of MS. The accumulated results show that T helper type 1 (Th1) and Th17 cells are involved in the disease course of MS.4, 5, 6, 7 The more complex studies used experimental autoimmune encephalomyelitis (EAE) animal models. In the EAE model, regulatory T cells and the cytokine interleukin‐10 (IL‐10), are two important negative regulators of disease development.8, 9, 10, 11, 12 Expansion of Th2 cells or inhibition of Th1/Th17 cells ameliorates EAE disease.13, 14, 15, 16 The clinical forms of MS are highly diverse and can range from relatively mild to severely debilitating disease due to loss of communication between the brain and other parts of the body. The majority of patients with MS go through relapsing and remitting flare‐ups, the precise mechanisms of which remain unclear. Whether distinct subsets of CD4 T cells play a role in the different forms of MS is currently unclear.6 Multiple sclerosis is difficult to diagnose and to treat, and the clinical progression and prognosis are challenging to predict. Hence, identification of biomarkers for early detection and pathogenesis is critical to improve the management of the disease.1, 2
Recently, microRNAs have emerged as promising targets for diagnosis and treatment of various clinical disorders, including MS. MicroRNAs are a class of ~22‐nucleotide non‐coding RNAs that regulate gene expression at the post‐transcriptional level. They bind to the 3′ untranslated region (UTR) of target mRNAs and cause degradation or translational inhibition of the target mRNAs.17 Many biological processes, such as development, homeostasis and pathophysiological changes, are regulated by microRNAs. Importantly, microRNAs are emerging as biomarkers with potential applications in the diagnosis and therapy of several human diseases.18, 19, 20, 21 Specifically, certain disease‐associated microRNAs isolated from plasma, peripheral blood mononuclear cells (PBMCs) and brain tissue of patients with MS were found to be dysregulated.17, 22, 23, 24 For example, the microRNAs miR‐155 and miR‐326 were up‐regulated in encephalitogenic CD4+ T cells and can affect the development of MS by promoting encephalitogenic Th1 and Th17 cells.23, 24, 25 However, microRNAs that exclusively regulate the pathogenesis of MS still need further elucidation.26, 27, 28, 29, 30
In this report, we demonstrate that the microRNA hsa‐miR‐140‐5p (miR‐140‐5p) is markedly down‐regulated in patients with MS. We further found that miR‐140‐5p regulates the differentiation of Th1 cells. We therefore propose that miR‐140‐5p is a new member of the family of microRNAs involved in MS pathogenesis.
Materials and methods
Human participants
Patients with MS from Palmetto Health Medical Center in Columbia, SC gave written consent to provide blood samples. Sample collection and further processing were undertaken according to a Human Subjects Protocol approved by the Institutional Review Board of the University of South Carolina. The disease was categorized as relapsing–remitting MS (Table 1). Peripheral blood was collected before giving medicinal treatment.
Table 1.
Characteristics of patients with multiple sclerosis and controlsa
| RRMS | Control | |
|---|---|---|
| Sample size | 22 | 22 |
| Relapsing | 4 | |
| Remitting | 18 | |
| Age (years) | 42 ± 9 | 44 ± 11 |
| Female | 20 | 20 |
| Male | 2 | 2 |
| Drug treatment | None | None |
Relevant information about human participants recruited for this study. RRMS, relapsing–remitting multiple sclerosis. The sample size includes the total number of participants in the relapsing–remitting multiple sclerosis or control group. The age is expressed as the mean ± SEM.
RRMS, relapsing–remitting multiple sclerosis.
Antibodies and reagents
Human MOG35–55 (hMOG35–55) peptide was purchased from Anaspec (Fremont, CA). Ionomycin and PMA were purchased from Sigma‐Aldrich (St Louis, MO). Anti‐GATA3 antibody was purchased from Affymetrix (eBioscience, San Diego, CA) and anti‐signal transducer and activator of transcription 1 (anti‐STAT1) antibody was purchased from Abcam (Cambridge, UK). The rest of the antibodies and isotype controls were purchased from Biolegend (San Diego, CA).
T‐cell subset isolation, intracellular staining, oligonucleotide transfection and plasma cytokine measurement
The PBMCs were prepared by density gradient centrifugation using Nycoprep 1.077 medium (Accurate Chemical & Scientific Corp, Westbury, NY). CD4+ T cells and CD8+ T cells were then purified with magnetic beads (Stemcell Technologies, Vancouver, BC, Canada) and the remaining cells were referred to as non‐T cells. Plasma was stored at −20° until cytokine measurement. Cytokine production in the plasma was measured by multiplexed microsphere cytokine immunoassay (Bio‐Plex Cytokine Assay kit; Bio‐Rad, Hercules, CA) as described previously.31 PBMCs were cultured with hMOG35–55 peptide (30 μg/ml) for 16 hr, followed by stimulation with 50 ng/ml PMA and 1 μg/ml ionomycin in the presence of 2 μm monensin for 4 hr. Some cells were transfected with miR‐140‐5p mimic or negative control of the mimic by Lipofectamine RNAiMAX (Invitrogen, Waltham, MA) as per the manufacturer's protocol. Production of IL‐4, IL‐17 and interferon‐γ (IFN‐γ) in the CD4+ T cells was detected by flow cytometry after intracellular staining (CXP FC500; Beckman Coulter, Brea, CA); the cytokines in the culture supernatants were detected using a sandwich ELISA or a multiplexed microsphere cytokine immunoassay (Bio‐Plex Cytokine Assay kit; Bio‐Rad).
MicroRNA array and quantitative real‐time PCR
Total RNA including microRNAs was extracted using an miRNeasy mini kit (Qiagen, Germantown, MD) and subjected to microRNA high‐throughput array with Affymetrix platform (eBioscience). MicroRNA array in Affymetrix platform was performed with probe set v4.01. Quantitative real‐time PCR was applied for the validation and amplification of the test samples. Relative fold expression values were calculated based on the expression of Snord96A gene as an endogenous control. Microarray data are available in the ArrayExpress database (www.ebi.ac.uk/arrayexpress) under accession number E‐MTAB‐3437.
Cell transfection and luciferase reporter assay
To develop the Dual‐Luciferase reporter vectors, wild‐type or mutated 3′‐UTR sequences of human STAT1 mRNA that overlaps the binding site for miR‐140‐5p were cloned into pmirGLO Dual‐Luciferase miRNA Target Expression vector (Promega, Madison, WI). HEK293 cells (ATCC, Manassas, VA) were transfected with the constructed vectors, miR‐140‐5p mimic or negative control of the mimic using Lipofectamine RNAiMAX (Invitrogen) as per the manufacturer's protocol. Cell extracts were prepared 24 hr later and luciferase activity was measured with the Dual‐Glo Luciferase Assay system per the manufacturer's protocol.
Western blot
Cells were lysed in RIPA buffer (Santa Cruz, Dallas, TX). The protein concentration was determined using the BCA Protein Assay Kit (Pierce, Waltham, MA). The samples were subjected to electrophoresis on 4–20% Mini‐Protean TGX Gels (Bio‐Rad) and transferred to nitrocellulose membrane (Bio‐Rad). The membranes were incubated with primary antibodies at 4° overnight and with secondary antibodies at room temperature for 1 hr. The staining was developed using the chemoluminescent reagents (LI‐COR, Lincoln, NE), and scanned with a Western blot scanner (LI‐COR).
Statistical analysis
Data were presented as the mean ± SEM and analysed for significance using the two‐tailed Student's t‐test (unequal variance type) or the Mann–Whitney U‐test. In the case of multiple testing, one‐way analysis of variance followed by Newman–Keuls multiple comparison tests was applied. The correlation between miR‐140‐5p, STAT1 and IFN‐γ was evaluated using Pearson's correlation coefficient. Comparisons were considered significant at P < 0·05.
Results
miR‐140‐5p is down‐regulated and let‐7e is up‐regulated in the CD4+ T cells of patients with MS
In order to assess potential alterations in microRNA expression in patients with MS, we first applied microRNA array to screen the microRNA expression profile in the PBMCs and compared with age‐ and sex‐matched controls (Table 1). We found 469 meaningful target microRNAs using the array. There were 42 microRNAs with greater than twofold difference in expression and P‐value < 0·05, including 33 mature microRNAs and nine pre‐mature microRNAs. Among them, miR‐140‐5p had the most down‐regulated expression level (Fig. 1a, Table 2). By using Ingenuity Pathway Analysis (ipa; Qiagen, Redwood City, CA), we found that these microRNAs were involved in many diseases and pathophysiological events such as development, cell survival, inflammation and cancer (Fig. 1c).
Figure 1.
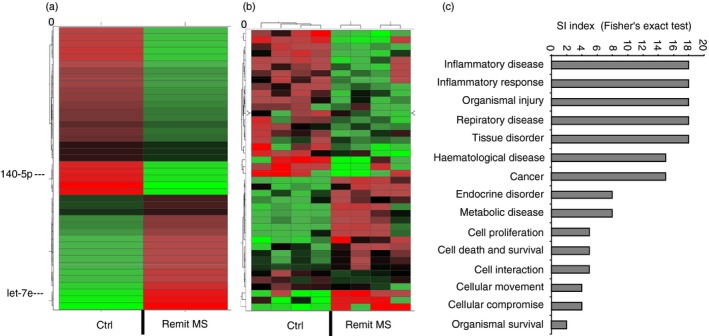
MicroRNAs and functional annotation categories in patients with multiple sclerosis (MS). MicroRNAs from the peripheral blood mononuclear cells (PBMCs) of patients with MS in the remitting stage and controls (ctrl) were subjected to microRNA array. (a) The heatmap of the microRNA array showed average values of 42 microRNAs that were significantly changed, with more than twofold differences between the groups. (b) The heatmap of microRNA array showed the same 42 dysregulated microRNAs as a cluster in four patients with MS and controls. (c) Predicted and experimentally supported targets were analysed using the Ingenuity Pathway Analysis (ipa) program for enrichment of genes into functional annotation categories. Significantly enriched categories are shown according to the significance index (SI) using the Fisher's exact test.
Table 2.
Representative microRNA expression in patients with multiple sclerosisa
| MicroRNA | Relative level | Log fold change |
|---|---|---|
| miR‐140‐5p | −27·008 ± 2·98 | −2·99 ± 0·44 |
| miR‐30a‐3p | −24·533 ± 2·88 | −3·106 ± 0·49 |
| miR‐660‐5p | −21·140 ± 2·83 | −2·394 ± 0·38 |
| miR‐30c‐5p | −21·013 ± 2·82 | −2·077 ± 0·33 |
| miR‐223‐3p | −13·153 ± 2·41 | −4·983 ± 0·51 |
| miR‐92a‐3p | −12·491 ± 2·38 | −1·650 ± 0·18 |
| miR‐26a‐5p | −11·673 ± 2·35 | −2·558 ± 0·35 |
| miR‐181a‐5p | 18·773 ± 2·62 | 2·048 ± 0·32 |
| let‐7e | 17·587 ± 2·58 | 2·13 ± 0·17 |
| miR‐455‐3p | 14·457 ± 2·48 | 2·819 ± 0·41 |
| miR‐423‐5p | 4·536 ± 0·52 | 1·531 ± 0·18 |
| mir‐15 | 4·485 ± 0·51 | 1·547 ± 0·22 |
| miR‐140‐3p | 3·078 ± 0·48 | 1·462 ± 0·19 |
The relative expression level and fold change for the part of the significantly changed microRNAs in peripheral blood mononuclear cells of patients with remitting multiple sclerosis compared with the controls. The full list of microRNAs and the detailed information of the microRNA array can be found in the ArrayExpress database under accession number E‐MTAB‐3437. The data were expressed as mean ± SEM from four patients with multiple sclerosis and four controls.
Because miR‐140‐5p was the most significantly down‐regulated microRNA in patients with MS, we next studied whether it was associated with the disease development. To that end, we examined the expression of miR‐140‐5p during relapsing and remitting stages of the clinical disease in patients with MS. The results showed that the expression level of miR‐140‐5p was significantly down‐regulated in both relapsing and remitting stages compared with that of the control. However, in the relapsing stage, the expression level was down‐regulated significantly more than in the remitting stage (Fig. 2a).
Figure 2.
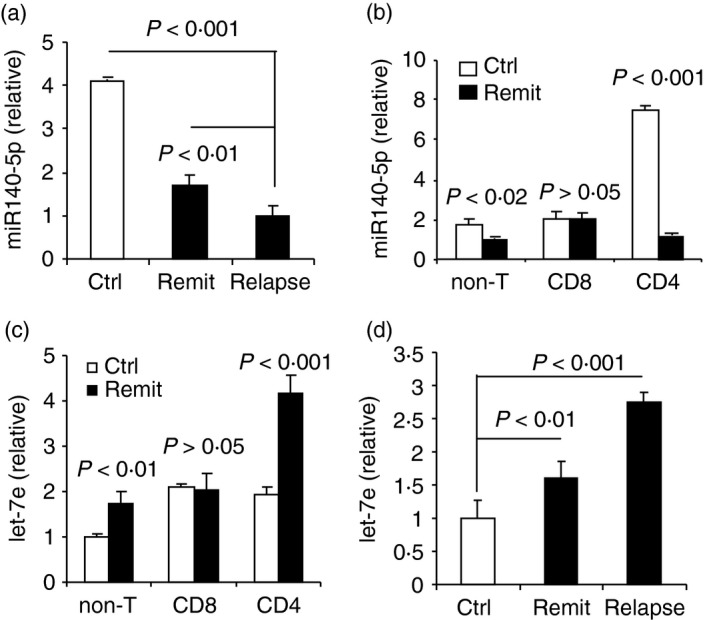
Down‐regulation of miR‐140‐5p and up‐regulation of let‐7e in patients with multiple sclerosis (MS). (a) Quantitative PCR analysis of miR‐140‐5p in peripheral blood mononuclear cells (PBMCs) of patients with remitting MS (remit), patients with relapsing MS (relapse) and controls (ctrl). (b) Quantitative PCR analysis of miR‐140‐5p in CD4+ T cells, CD8+ T cells and non‐T cells from PBMCs of patients with remitting MS and controls. (c) Quantitative PCR analysis of let‐7e in CD4+ T cells, CD8+ T cells and non‐T cells from PBMCs of patients with remitting MS and controls. (d) Quantitative PCR analysis of let‐7e in PBMCs of patients with remitting MS, patients with relapsing MS and controls. Data are shown as mean ± SEM of seven patients in the remitting stage, seven controls, and four patients in the relapsing stage of MS.
To validate these data, we performed quantitative PCR, to examine the expression of miR‐140‐5p in CD4+ T cells, CD8+ T cells and non‐T cells of PBMCs. The results showed that miR‐140‐5p was expressed in all three subsets in the controls of which CD4+ T cells had the highest expression level of miR‐140‐5p. In patients with MS in the remitting stage, the expression level of miR‐140‐5p was significantly down‐regulated in CD4+ T cells and non‐T cells, but levels remained the same in CD8+ T cells when compared with the controls (Fig. 2b). Together, our results indicated a negative correlation between the expression of miR‐140‐5p and the development of the disease and suggested a possible role of miR‐140‐5p in the differentiation of encephalitogenic CD4+ T cells.
On the other hand, using the microRNA array, we also found that some microRNAs were significantly up‐regulated in PBMCs of patients with MS when compared with the controls. For example, we found that microRNA let‐7e and miR‐181a‐5p were significantly up‐regulated in patients with MS (Fig. 1a, Table 2). Our laboratory previously reported that let‐7e was up‐regulated in an EAE murine model of MS, and was associated with the development of EAE,32 so we further examined the expression of let‐7e in CD4+ T cells, CD8+ T cells and non‐T cells. Interestingly, the expression pattern of let‐7e in the three subsets was similar but opposite to that of miR‐140‐5p, in that let‐7e was expressed in all three subsets but significantly up‐regulated in CD4+ T cells and non‐T cells in patients with MS when compared with the controls, whereas it remained unchanged in CD8+ T cells. The CD4+ T cells had the greatest up‐regulation in let‐7e expression when compared with CD8+ T cells and non‐T cells in patients in the remitting stage (Fig. 2c). Importantly, we found that let‐7e expression was positively correlated with disease progression, which was corroborated by the fact that patients with MS who were in the relapsing stage had significantly increased levels of let‐7e compared with that in the remitting stage (Fig. 2d). These results were consistent with our previous findings in EAE, in which let‐7e was the most up‐regulated microRNA in encephalitogenic CD4+ T cells and most increased in the relapsing stage.32 Together, our results indicated that let‐7e was positively associated with the development of MS and suggest a regulation that is inversely correlated with miR‐140‐5p expression in the development of encepholitogenic CD4+ T cells in MS.
miR‐140‐5p regulates differentiation of encephalitogenic CD4+ T cells to Th1 cells
Using ipa, we could see a predictive interaction network of the most changed microRNAs in patients with MS. The dysregulated microRNAs were predicted by ipa to directly target numerous mRNAs involved in T‐cell differentiation, particularly the Th1 subset, including the targeting of STAT1, IFN‐γ, and TBX21 (T‐bet) (Fig. 3). For example, miR‐140‐5p targeted STAT1; let‐7e targeted IL‐10 and IL‐13 (Fig. 3). These results suggested a possible regulatory role of miR‐140‐5p on Th1–Th2 differentiation.
Figure 3.
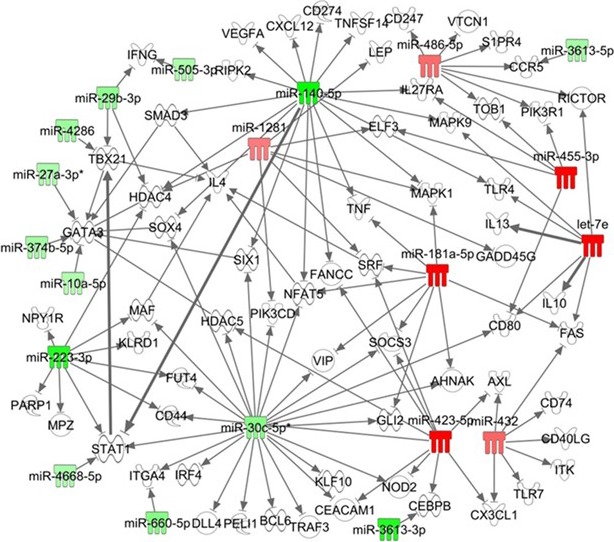
Predictive T helper type 1 (Th1) –Th2 regulation by miR‐140‐5p using the Ingenuity Pathway Analysis (ipa) program. Predictive analysis of microRNA–target interaction using the ipa program for the microRNAs with significantly changed expression levels in the peripheral blood mononuclear cells (PBMCs) of patients with multiple sclerosis (MS). Arrows indicate interaction between microRNAs and their targets. The up‐regulated microRNAs are highlighted in red; the down‐regulated microRNAs are highlighted in green. miR‐140‐5p directly targeted signal transducer and activator of transcription 1 (STAT1; bold arrow) and CXCL12. miR‐140‐5p indirectly targeted GATA3 through SMAD3 or HDAC4. Let‐7e directly targeted interleukin‐10 (IL‐10) and IL‐13. STAT1 directly targeted Tbx21 (T‐bet) (bolded arrow).
We then studied the effect of miR‐140‐5p on the differentiation of encephalitogenic CD4+ T cells by examining the Th1–Th2–Th17 polarization ex vivo. PBMCs from patients with MS were prepared and transfected with mimic mature miR‐140‐5p (labelled as mimic) to restore the expression of miR‐140‐5p or scrambled microRNA oligonucleotides as the negative control (labelled as mock). The cells were cultured with human MOG35–55 peptide for 20 hr, and then the production of IFN‐γ, IL‐4 and IL‐17A in the CD4+ T cells was detected using flow cytometry. The results showed that the CD4+ T cells transfected with the mock, showed strong polarization towards Th1 cells (~35%) whereas polarization towards Th2 and Th17 was modest (~2–3%), as shown in Fig. 4. In cultures transfected with the mimic, the Th1 polarization dropped by ~50–15%; the percentage of Th17 cells also decreased significantly (from ~2% to 1%), whereas the Th2 cells were not significantly altered. We also found that the restoration of miR‐140‐5p simultaneously decreased the expression level of let‐7e (Fig. 4c). These results suggested that miR‐140‐5p could play a role in regulation of Th1 differentiation of encephalitogenic CD4+ T cells.
Figure 4.
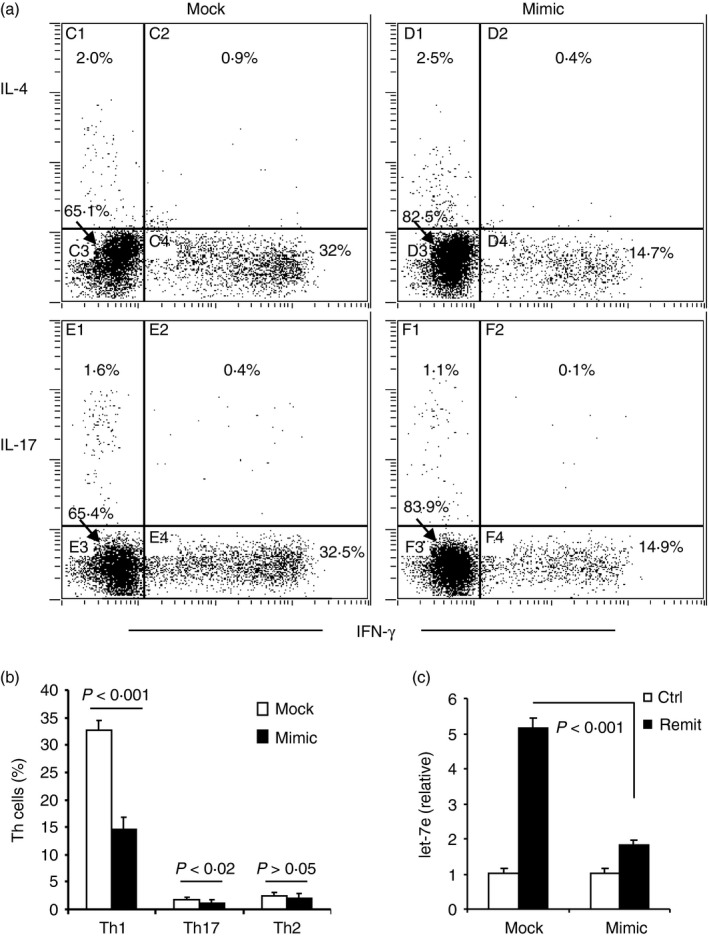
miR‐140‐5p regulates T helper type 1 (Th1) differentiation in in vitro stimulation with human MOG 35–55 peptide. Peripheral blood mononuclear cells (PBMCs) from patients with remitting multiple sclerosis (MS) were transfected with mimic oligonucleotide of miR‐140‐5p (mimic) or negative control oligonucleotide (mock), and then cultured with supplement of hMOG 35–55 peptide (30 μg/ml) for 20 hr. Intracellular production of interleukin‐4 (IL‐4), IL‐17A and interferon‐γ (IFN‐γ) in CD4+ T cells was measured using flow cytometry. (a) The dot plots are representative of three independent experiments. (b) The histogram shows the percentage of Th1, Th2 and Th17 populations (mean ± SEM from the three experiments). The gate was set on CD4+ T cells. (c) Quantitative PCR analysis of let‐7e in the transfected PBMCs. PBMCs from healthy controls were used as negative control (ctrl) in the PCR analysis. The relative expression is shown as mean ± SEM from three experiments.
miR‐140‐5p targets STAT1 and affects subsequent activation of T‐bet
We found that STAT1, a transcription factor involved in Th1 differentiation, is a putative target of miR‐140‐5p predicted by numerous microRNA prediction programs (dianamt, miranda, mirwalk, pictar5 and targetscan). To verify the binding between STAT1 and miR‐140‐5p, we performed a luciferase assay. HEK293 cells were transfected with the mimic oligonucleotide of miR‐140‐5p and the dual luciferase vector was conjugated with the STAT1 binding sequence at the 3′‐UTR (Fig. 5a). The subsequent luciferase assay showed that the miR‐140‐5p mimic significantly suppressed the luciferase activity in the STAT1‐transfected cells whereas the negative mock control or scrambled‐STAT1 transfection did not. These results demonstrated that miR‐140‐5p could specifically bind to STAT1 (Fig. 5b). To further confirm whether the miR‐140‐5p targeting on STAT1 could result in the translational and functional suppression of STAT1 in patients with MS, we examined the expression level of STAT1 in the PBMCs of patients with MS. We found that with restoration of miR‐140‐5p, the expression level of total STAT1 and phosphorylated STAT1 was indeed suppressed (Fig. 5c). Together, our results demonstrated that STAT1 was a functional target of miR‐140‐5p.
Figure 5.
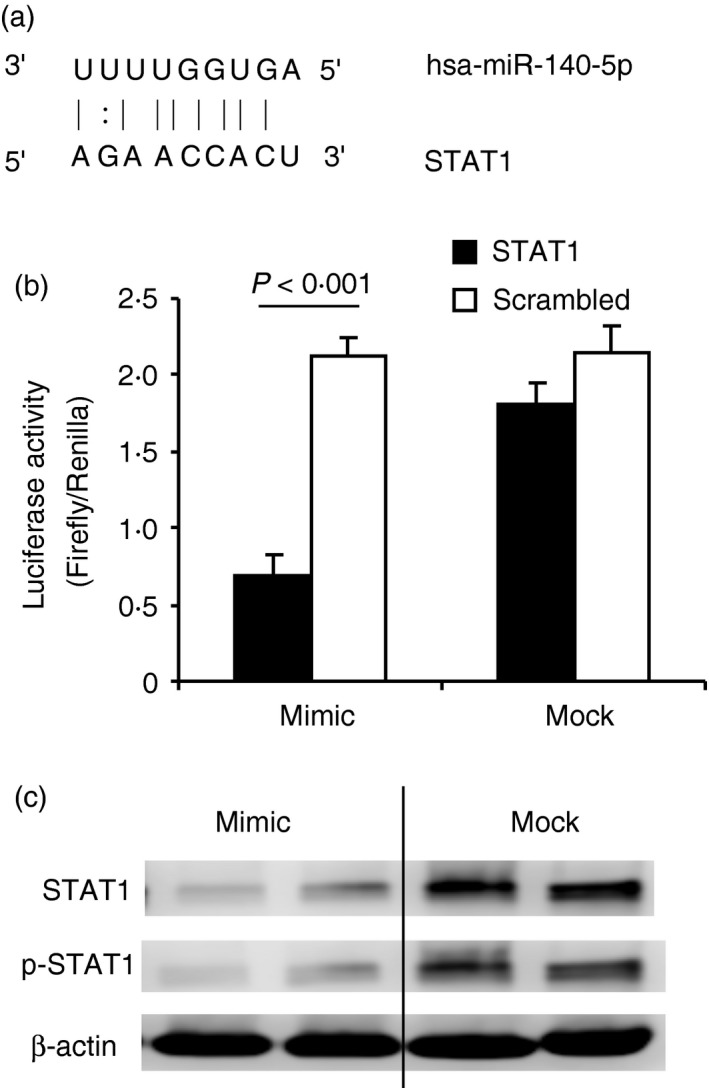
Signal transducer and activator of transcription 1 (STAT1) is the functional target of miR‐140‐5p. (a) The predicted binding site of miR‐140‐5p and STAT1. (b) HEK293 cells were transfected with mimic or mock oligonucleotide of miR‐140‐5p and subjected to the dual luciferase assay. The histogram shows the relative luciferase activity. The black bar represents the cells transfected with the vectors containing the STAT1 binding sequence; the white bar represents the cells transfected with the vectors containing the scrambled sequence as a negative control to the STAT1. Data are shown as mean ± SEM of three independent experiments. (c) Peripheral blood mononuclear cells (PBMCs) from patients with remitting multiple sclerosis (MS) were transfected with mimic oligonucleotide of miR‐140‐5p (mimic) or negative control peptide (mock), and then cultured with supplement of hMOG 35–55 peptide (30 μg/ml) for 20 hr. Cells were collected and subject to Western blot to measure total STAT1 (STAT1) and phosphorylated STAT1 (p‐STAT1). β‐Actin was used as an endogenous control. Data are representative of three independent experiments.
Interferon‐γ‐induced STAT1 activates T‐bet expression; this signalling pathway controls the differentiation of naive CD4+ T cells to Th1 effectors.33 Inasmuch as the above results confirmed that miR‐140‐5p functionally targeted STAT1, we further examined T‐bet expression in CD4+ T cells from patients with MS. To do this, PBMCs of patients with MS were transfected with the mimic oligonucleotide of miR‐140‐5p and re‐stimulated with human MOG35–55 peptide for 20 hr, then expression of T‐bet and GATA3 was examined by flow cytometry. We found that a significant portion of mock‐transfected CD4+ T cells expressed T‐bet (~65%) of which ~12% co‐expressed GATA3 (Tbet+ GATA3+ CD4+ T cells) (Fig. 6). Of these cells, only a few CD4+ T cells (up to 2%) expressed GATA3 alone (Tbet− GATA3+ CD4+ T cells). However, up to 52% of CD4+ T cells expressed T‐bet only (Tbet+ GATA3− CD4+ T cells) (Fig. 6). These results indicated that Th1 cells were the main effector cells in these patients; meanwhile, a portion of the effector CD4+ T cells were maintained between Th1 and Th2 differentiation. After the restoration of miR‐140‐5p with the mimic, Tbet+ GATA3− CD4+ T cells were significantly suppressed; meanwhile, Tbet+ GATA3+ CD4+ T cells and Tbet− GATA3+ CD4+ T cells were significantly increased (Fig. 6). These results suggested a possible role of miR‐140‐5p in the Th1–Th2 plasticity of encephalitogenic CD4+ T cells.
Figure 6.
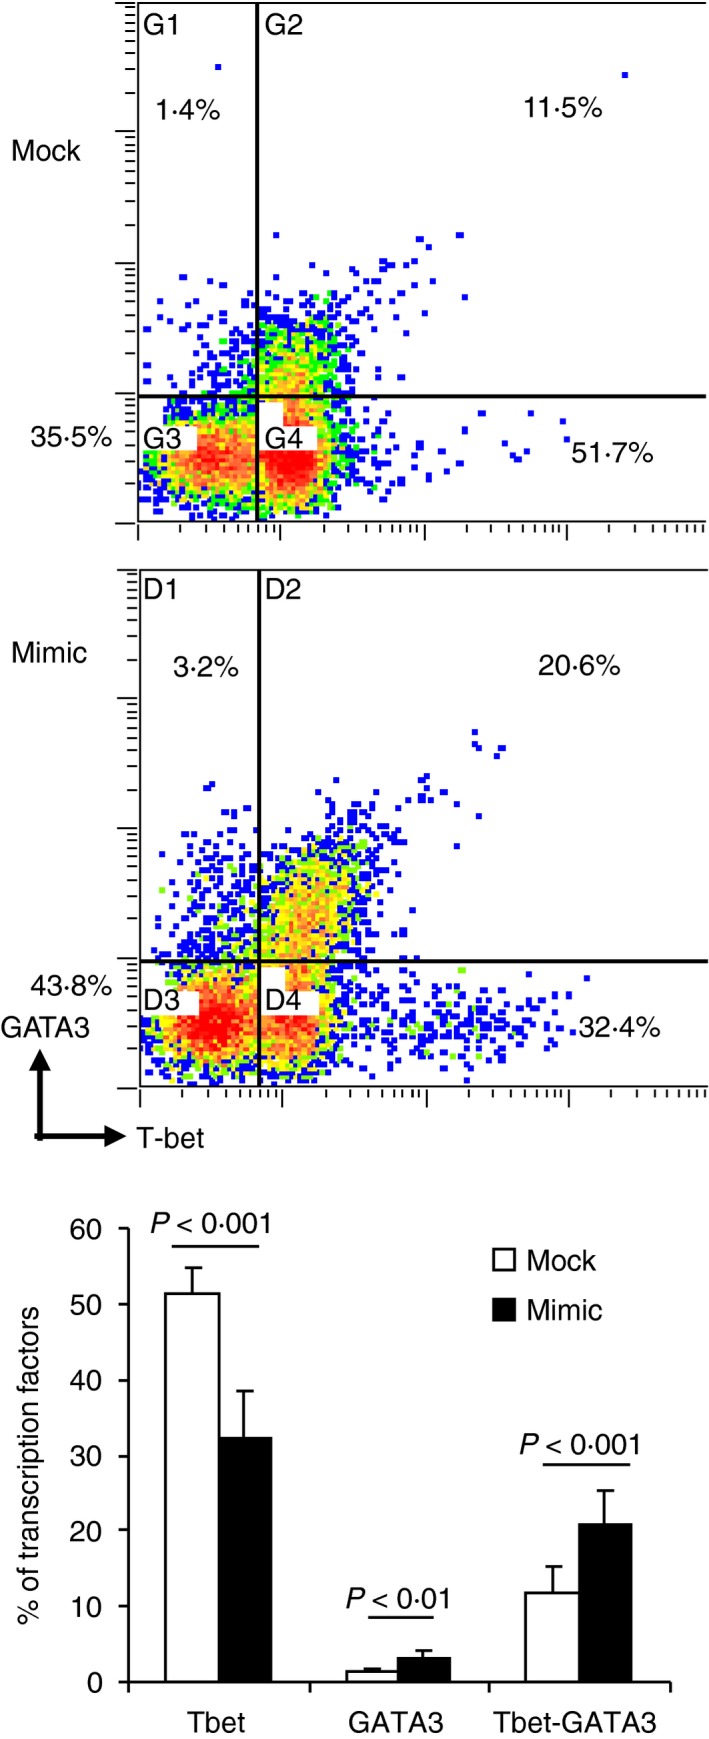
miR‐140‐5p regulates expression of T‐bet in CD4+ T cells upon human MOG 35–55 peptide stimulation. Peripheral blood mononuclear cells (PBMCs) from patients with remitting multiple sclerosis (MS) were transfected with mimic oligonucleotide of miR‐140‐5p (mimic) or negative control oligonucleotide (mock), and then cultured with hMOG 35–55 peptide (30 μg/ml) for 20 hr. Intracellular production of T‐bet and GATA3 in CD4+ T cells was measured using flow cytometry. The dot plots are representative of three independent experiments. The histogram showed mean ± SEM from the three experiments. The gate was set on CD4+ T cells.
To rule out the possibility of direct binding between miR‐140‐5p and T‐bet, we explored three programs, including targetscan, miranda and mirwalk, to predict the binding sites between them. The results showed that T‐bet was not a predictive target of miR‐140‐5p (data not shown), which further implied a role of miR‐140‐5p–STAT1 signalling in Th1 differentiation.
miR‐140‐5p expression negatively correlates with the expression of IFN‐γ and STAT1
Because IFN‐γ is the key cytokine in activation of STAT1, we examined IFN‐γ production in the peripheral blood of patients with MS. We used a Bio‐plex cytokine assay to detect IFN‐γ and 26 other cytokines in 10 patients with MS of remitting stage and controls. We successfully detected IFN‐γ and found that patients with MS had significantly higher concentrations of IFN‐γ than the controls (Fig. 7a). We further analysed the correlation between the expression of miR‐140‐5p, STAT1 and IFN‐γ. The results showed a negative correlation between the expression of miR‐140‐5p and STAT1, a negative correlation between miR‐140‐5p and IFN‐γ, and a positive correlation between STAT1 and IFN‐γ (Fig. 7b). These results provided further evidence that miR‐140‐5p can regulate the IFN‐γ–STAT1 signalling pathway, and regulate T‐bet expression and Th1 differentiation in patients with MS.
Figure 7.
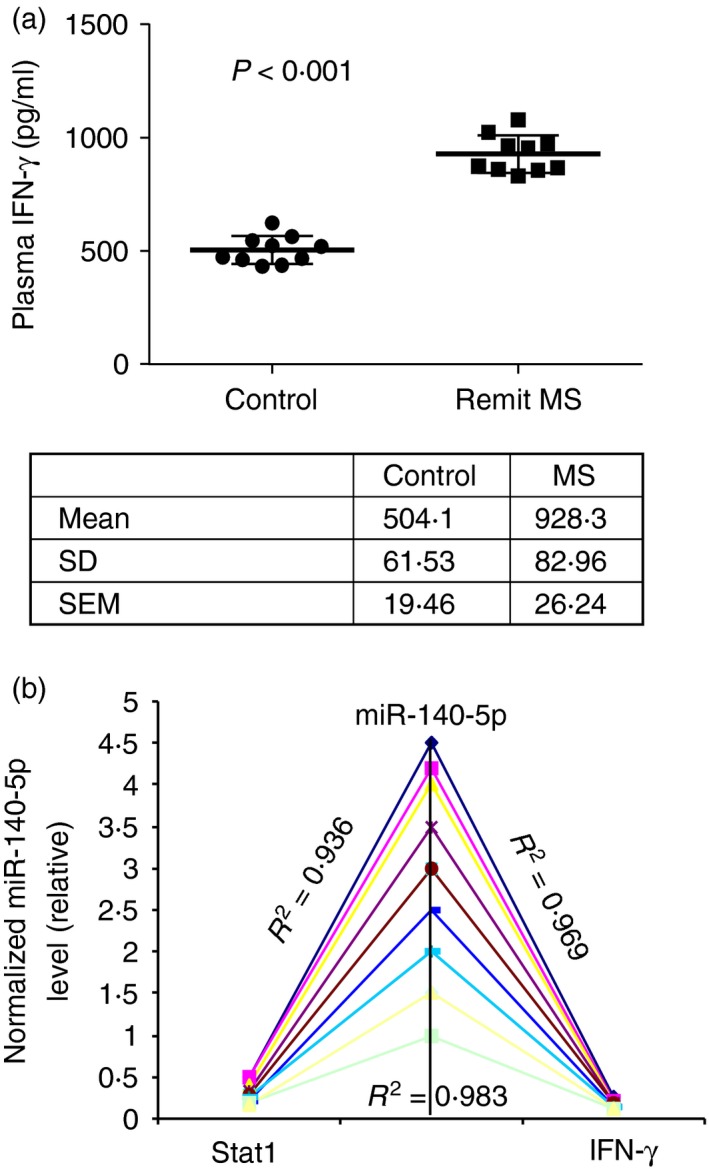
Expression of miR‐140‐5p is negatively correlated with production of interferon‐γ (IFN‐γ) and expression of signal transducer and activator of transcription 1 (STAT1). (a) Production of IFN‐γ in the plasma of patients with remitting MS and controls (n = 10) was detected using the Bio‐Plex assay. The scatter plots represent the concentration of each sample and the chart shows the mean, standard deviation and standard error of the mean. (b) Correlation between miR‐140‐5p, STAT1 and IFN‐γ. The transcript level of miR‐140‐5p, the density of STAT1, and the concentration of IFN‐γ from patients with MS were normalized to the controls (MS/ctrl) (n = 10 for each). Pearson correlation analysis was performed between miR‐140‐5p and STAT1, miR‐140‐5p and IFN‐γ, STAT1 and IFN‐γ. The results showed a reverse correlation between miR‐140‐5p and STAT1 (R 2 = 0·936), a reverse correlation between miR‐140‐5p and IFN‐γ (R 2 = 0·969), a positive correlation between STAT1 and IFN‐γ (R 2 = 0·983).
Meanwhile, we were able to detect some other cytokines using a Bio‐plex assay (Fig. 8). We found that the production of IL‐10 and IL‐13 in the plasma was significantly lower in these patients than in the controls; the production of tumour necrosis factor‐α, IL‐6, IL‐1β, IL‐12p70, IL‐8 and granulocyte–macrophage colony‐stimulating factor was significantly higher in patients with MS than in the controls; the production of IL‐4 and IL‐5 was similar in both patients with MS and the controls (Fig. 8); however, IL‐17 was not detectable in almost every participant including patients with MS and controls (data not shown). IL‐10 and IL‐13 are the functional targets of let‐7e in EAE.32 The increased expression of let‐7e and decreased production of IL‐10 and IL‐13 in patients with MS suggested an active role for let‐7e in the pathogenesis of MS.
Figure 8.

Production of cytokines in plasma of patients with remitting multiple sclerosis (MS). Cytokine production in the plasma of patients with remitting MS and controls was detected using a Bio‐Plex assay and expressed as the mean ± SEM from 10 patients with MS or controls (ctrl). *P < 0·05 between patients with MS and controls (ctrl); **P < 0·01 between patients with MS and controls (ctrl); ns: no significance between patients with MS and controls (ctrl).
Discussion
Diagnosing and treating MS poses a significant challenge. In the early stages of MS, the symptoms can be non‐specific and suggestive of many other disorders of the central nervous system. Currently, there is no single specific laboratory test that can identify or rule out MS. Hence, new biomarkers of the disease are highly sought after. Moreover, clinically, there are many forms of MS. Of these, the relapsing–remitting MS is the most common, affecting ~85% of people with MS. As indicated by the name, people with relapsing–remitting MS have temporary periods of relapses, flare‐ups or exacerbations. Most of these people transit into secondary‐progressive MS with symptoms worsening steadily over time with or without the occurrence of relapsing and remitting disease. In contrast, people can have another form called primary‐progressive MS, affecting about 10% of people with MS, which is characterized by gradual worsening symptoms from onset, with no relapse or remission. Lastly, a small proportion (~5%) of patients develop progressive‐relapsing MS, in which there is steady worsening of disease from onset, with acute relapses but no remission, with or without recovery. Again, it is not clear why this autoimmune disease shows such variations in pathogenesis. Clearly, additional studies are necessary to understand the mechanisms of pathogenesis and potential biomarkers that can predict the course of the disease.
Research on microRNAs has opened up new avenues to understand the MS disease process. The identification of new members of the microRNA family associated with the pathogenesis of MS could facilitate early diagnosis and treatment. Th1 cells are critically associated with the pathogenesis of MS.1, 2 In the current study, we noted that the microRNA miR‐140‐5p can regulate Th1 differentiation. The expression of miR‐140‐5p was predominant in CD4+ T cells compared with CD8+ T cells and non‐T cells, and correlated with remitting and relapsing disease. The down‐regulation of miR‐140‐5p led to enhanced development of Th1 cells and disease severity. By replenishing miR‐140‐5p, differentiation of Th1 cells could be significantly suppressed. Based on these findings, we propose that miR‐140‐5p is associated with the pathogenesis of MS.
There is growing interest in the contribution of microRNAs in the gene regulation of MS. New medicines could be developed that modulate expression of specific microRNAs and subsequent gene activity involved in proliferation and activation of the effector cells. For example, treatment with natalizumab resulted in differential expression of two clusters, miR‐17‐92 and miR‐106b‐25, in patients with MS, and affected CD4+ T‐cell activation and proliferation.34, 35, 36 Several microRNAs (such as miR‐326 and miR‐26a) have been reported to be associated with the pathogenesis of MS as a regulator of B‐cell, T‐cell and monocyte development.23, 37 The precise role of microRNAs in the regulation of the pathogenesis of MS is not completely clear. miR‐326 and miR‐26a were reported to regulate Th17 cell differentiation in MS. miR‐155 and let‐7e were reported to regulate Th1 cell differentiation in a mouse model of MS.24, 25, 32 The miR‐132–Surtuin‐1 axis was reported to regulate B‐cell cytokine production in MS.38 Our study demonstrates for the first time that miR‐140‐5p could be a Th1 regulator, and therefore is associated with the pathogenesis of MS.
miR‐140‐5p was originally found in cartilage.39 It has been linked more specifically to osteoarthritis;39, 40, 41 miR‐140‐5p inhibits expression of genes known to play detrimental roles in osteoarthritis. Expression of miR‐140‐5p is significantly decreased in human osteoarthritis chondrocytes, so favouring an increased expression of its targeted genes and consequently a role in cartilage degradation.40, 41 The role of miR‐140‐5p has recently been revealed in other clinical disorders. For example, miR‐140‐5p can functionally inhibit osteogenic lineage commitment in undifferentiated human mesenchymal stem cells,42 and participate in human palatogenesis, inasmuch as loss of miR‐140‐5p leads to palatal clefting in embryonic development.43 In accordance with the negative regulatory role of this microRNA in osteoarthritis and organ development, miR‐140‐5p is also considered a tumour‐suppressing microRNA, which suppresses tumour growth and metastasis.44, 45
The STAT1 and T‐bet signalling pathways have been well characterized in Th1 cell differentiation. STAT1 negatively regulates IL‐4 production,33, 46 whereas T‐bet regulates the fate of Th1 and Th17 lymphocytes in autoimmunity.47 In the present study, we demonstrated that STAT1 is a functional downstream target of miR‐140‐5p, as evidenced by the following findings: (i) miR‐140‐5p directly binds to the 3′‐UTR of STAT1; over‐expression of miR‐140‐5p reduced the activity of a luciferase reporter containing the wild‐type 3′‐UTR of STAT1 mRNA, but had no effect on the luciferase reporter containing the scrambled STAT1 3′‐UTR; (ii) over‐expression of miR‐140‐5p significantly reduced STAT1 protein levels in PBMCs of patients with MS; (iii) over‐expression of miR‐140‐5p significantly reduced the expression of downstream target of STAT1, T‐bet. Together, these data strongly suggested that miR‐140‐5p inhibits Th1 differentiation through down‐regulation of STAT1.
It has been reported that miR‐155 and miR‐326 affected the development of encephalitogenic Th1, Th2 and Th17 cells.23, 24, 25, 48, 49 We previously reported that microRNA let‐7e was associated with the development of murine EAE, as the up‐regulated let‐7e could enhance Th1 cell development and exacerbate the disease.32 In the present study, we also confirmed an up‐regulated let‐7e expression in peripheral CD4+ T cells of patients with MS compared with the controls. We found that let‐7e was predominantly expressed in CD4+ T cells and its expression positively correlated with disease severity. Both IL‐10 and IL‐13 are functional targets of let‐7e.32 We found that the increased let‐7e correlated with significantly suppressed production of IL‐10 and IL‐13 in the plasma of patients with MS. These results suggested that miR‐140‐5p and let‐7e are both associated with the development of MS. Indeed, several reports have found that multiple microRNAs are significantly changed in MS.24, 27, 50 Therefore, the pathogenesis of MS may not be regulated by a single microRNA, but rather by an array of microRNAs.
In this study, we found very few Th2 cells but large numbers of Th1 cells in patients with MS. Accordingly, we found very few GATA3+ CD4+ T cells but a larger proportion of Tbet+ CD4+ T cells. However, there was also a large proportion of GATA3+ Tbet+ CD4+ T cells. With the restoration of miR‐140‐5p, both GATA3+ CD4+ T cells and GATA3+ Tbet+ CD4+ T cells were significantly increased but Th2 cells remained unchanged. These results indicated that miR‐140‐5p could not drive the plasticity of CD4+ T cells towards a Th2 lineage even though it regulated Th1 differentiation. This suggested that other mechanisms were needed to synchronize the effect of miR‐140‐5p in order to switch a Th1‐biased immune response to a Th2‐biased immune response; multiple microRNAs might be involved in the regulation of the differentiation of encephalitogenic T cells and the pathogenesis of MS. It has been reported that miR‐140‐5p and let‐7e may together regulate skeletal development.51 Based on our current results, we hypothesize that miR‐140‐5p and let‐7e simultaneously regulate the differentiation of encephalitogenic T cells and the pathogenesis of MS. It was interesting to find out that restoration of miR‐140‐5p in PBMCs of patients with remitting MS could decrease expression of let‐7e simultaneously (Fig. 4c). Hence, regulating the expression of both microRNAs might be a more effective way to trigger immunosuppression in the treatment of MS than interfering with the expression of miR‐140‐5p or let‐7e, alone.
Author contributions
HG, PSN and MN designed the experiments; HG, UPS and NPS performed the experiments; DM and SS provided samples; HH performed the microRNA array; HG, RR, EEZ, PSN and MN analysed the data and HG, PSN and MN wrote the paper.
Disclosures
The authors declare no financial or commercial conflict of interest.
Acknowledgements
This work was supported in part by National Institutes of Health grants P01AT003961, R01AT006888, R01ES019313, R01MH094755 and P20GM103641 to PN and MN as well as by Veterans Affairs Merit Award BX001357 to MN, and the Research Development Fund from University of South Carolina to HG.
References
- 1. Compston A, Coles A. Multiple sclerosis. Lancet 2008; 372:1502–17. [DOI] [PubMed] [Google Scholar]
- 2. Goverman J. Autoimmune T cell responses in the central nervous system. Nat Rev Immunol 2009; 9:393–407. [DOI] [PMC free article] [PubMed] [Google Scholar]
- 3. Kasper LH, Shoemaker J. Multiple sclerosis immunology: the healthy immune system vs the MS immune system. Neurology 2010; 74(Suppl. 1):S2–8. [DOI] [PubMed] [Google Scholar]
- 4. Cao Y, Goods BA, Raddassi K, Nepom GT, Kwok WW, Love JC, et al Functional inflammatory profiles distinguish myelin‐reactive T cells from patients with multiple sclerosis. Sci Transl Med 2015; 7:287ra74. [DOI] [PMC free article] [PubMed] [Google Scholar]
- 5. Rasouli J, Ciric B, Imitola J, Gonnella P, Hwang D, Mahajan K, et al Expression of GM‐CSF in T cells is increased in multiple sclerosis and suppressed by IFN‐β therapy. J Immunol 2015; 194:5085–93. [DOI] [PMC free article] [PubMed] [Google Scholar]
- 6. Schmitt N. Role of T follicular helper cells in multiple sclerosis. J Nat Sci 2015; 1:e139. [PMC free article] [PubMed] [Google Scholar]
- 7. Tao Y, Zhang X, Chopra M, Kim MJ, Buch KR, Kong D, et al The role of endogenous IFN‐β in the regulation of Th17 responses in patients with relapsing–remitting multiple sclerosis. J Immunol 2014; 192:5610–7. [DOI] [PubMed] [Google Scholar]
- 8. Dai H, Ciric B, Zhang GX, Rostami A. Interleukin‐10 plays a crucial role in suppression of experimental autoimmune encephalomyelitis by Bowman–Birk inhibitor. J Neuroimmunol 2012; 245:1–7. [DOI] [PMC free article] [PubMed] [Google Scholar]
- 9. Zhang L, Yuan S, Cheng G, Guo B. Type I IFN promotes IL‐10 production from T cells to suppress Th17 cells and Th17‐associated autoimmune inflammation. PLoS ONE 2011; 6:e28432. [DOI] [PMC free article] [PubMed] [Google Scholar]
- 10. Bettelli E, Nicholson LB, Kuchroo VK. IL‐10, a key effector regulatory cytokine in experimental autoimmune encephalomyelitis. J Autoimmun 2003; 20:265–7. [DOI] [PubMed] [Google Scholar]
- 11. O'Connor RA, Anderton SM. Foxp3+ regulatory T cells in the control of experimental CNS autoimmune disease. J Neuroimmunol 2008; 193:1–11. [DOI] [PubMed] [Google Scholar]
- 12. Ray A, Basu S, Miller NM, Chan AM, Dittel BN. An increase in tolerogenic dendritic cell and natural regulatory T cell numbers during experimental autoimmune encephalomyelitis in Rras−/− mice results in attenuated disease. J Immunol 2014; 192:5109–17. [DOI] [PMC free article] [PubMed] [Google Scholar]
- 13. Jager A, Dardalhon V, Sobel RA, Bettelli E, Kuchroo VK. Th1, Th17, and Th9 effector cells induce experimental autoimmune encephalomyelitis with different pathological phenotypes. J Immunol 2009; 183:7169–77. [DOI] [PMC free article] [PubMed] [Google Scholar]
- 14. O'Connor RA, Prendergast CT, Sabatos CA, Lau CW, Leech MD, Wraith DC, et al Cutting edge: Th1 cells facilitate the entry of Th17 cells to the central nervous system during experimental autoimmune encephalomyelitis. J Immunol 2008; 181:3750–4. [DOI] [PMC free article] [PubMed] [Google Scholar]
- 15. Aharoni R, Teitelbaum D, Leitner O, Meshorer A, Sela M, Arnon R. Specific Th2 cells accumulate in the central nervous system of mice protected against experimental autoimmune encephalomyelitis by copolymer 1. Proc Natl Acad Sci U S A 2000; 97:11472–7. [DOI] [PMC free article] [PubMed] [Google Scholar]
- 16. Bettelli E, Korn T, Oukka M, Kuchroo VK. Induction and effector functions of TH17 cells. Nature 2008; 453:1051–7. [DOI] [PMC free article] [PubMed] [Google Scholar]
- 17. Ma X, Zhou J, Zhong Y, Jiang L, Mu P, Li Y, et al Expression, regulation and function of microRNAs in multiple sclerosis. Int J Med Sci 2014; 11:810–8. [DOI] [PMC free article] [PubMed] [Google Scholar]
- 18. Coolen M, Bally‐Cuif L. MicroRNAs in brain development and physiology. Curr Opin Neurobiol 2009; 19:461–70. [DOI] [PubMed] [Google Scholar]
- 19. Lodish HF, Zhou B, Liu G, Chen CZ. Micromanagement of the immune system by microRNAs. Nat Rev Immunol 2008; 8:120–30. [DOI] [PubMed] [Google Scholar]
- 20. Taganov KD, Boldin MP, Baltimore D. MicroRNAs and immunity: tiny players in a big field. Immunity 2007; 26:133–7. [DOI] [PubMed] [Google Scholar]
- 21. Mattes J, Collison A, Foster PS. Emerging role of microRNAs in disease pathogenesis and strategies for therapeutic modulation. Curr Opin Mol Ther 2008; 10:150–7. [PubMed] [Google Scholar]
- 22. Gandhi R, Healy B, Gholipour T, Egorova S, Musallam A, Hussain MS, et al Circulating microRNAs as biomarkers for disease staging in multiple sclerosis. Ann Neurol 2013; 73:729–40. [DOI] [PubMed] [Google Scholar]
- 23. Du C, Liu C, Kang J, Zhao G, Ye Z, Huang S, et al MicroRNA miR‐326 regulates TH‐17 differentiation and is associated with the pathogenesis of multiple sclerosis. Nat Immunol 2009; 10:1252–9. [DOI] [PubMed] [Google Scholar]
- 24. Junker A. Pathophysiology of translational regulation by microRNAs in multiple sclerosis. FEBS Lett 2011; 585:3738–46. [DOI] [PubMed] [Google Scholar]
- 25. O'Connell RM, Kahn D, Gibson WS, Round JL, Scholz RL, Chaudhuri AA, et al MicroRNA‐155 promotes autoimmune inflammation by enhancing inflammatory T cell development. Immunity 2010; 33:607–19. [DOI] [PMC free article] [PubMed] [Google Scholar]
- 26. Danborg PB, Simonsen AH, Waldemar G, Heegaard NH. The potential of microRNAs as biofluid markers of neurodegenerative diseases – a systematic review. Biomarkers 2014; 19:259–68. [DOI] [PubMed] [Google Scholar]
- 27. Sondergaard HB, Hesse D, Krakauer M, Sorensen PS, Sellebjerg F. Differential microRNA expression in blood in multiple sclerosis. Mult Scler 2013; 19:1849–57. [DOI] [PubMed] [Google Scholar]
- 28. Maciotta S, Meregalli M, Torrente Y. The involvement of microRNAs in neurodegenerative diseases. Front Cell Neurosci 2013; 7:265. [DOI] [PMC free article] [PubMed] [Google Scholar]
- 29. Roshan R, Ghosh T, Scaria V, Pillai B. MicroRNAs: novel therapeutic targets in neurodegenerative diseases. Drug Discov Today 2009; 14:1123–9. [DOI] [PubMed] [Google Scholar]
- 30. Keller A, Leidinger P, Steinmeyer F, Stahler C, Franke A, Hemmrich‐Stanisak G, et al Comprehensive analysis of microRNA profiles in multiple sclerosis including next‐generation sequencing. Mult Scler 2014; 20:295–303. [DOI] [PubMed] [Google Scholar]
- 31. Guan H, Nagarkatti PS, Nagarkatti M. CD44 reciprocally regulates the differentiation of encephalitogenic Th1/Th17 and Th2/regulatory T cells through epigenetic modulation involving DNA methylation of cytokine gene promoters, thereby controlling the development of experimental autoimmune encephalomyelitis. J Immunol 2011; 186:6955–64. [DOI] [PMC free article] [PubMed] [Google Scholar]
- 32. Guan H, Fan D, Mrelashvili D, Hao H, Singh NP, Singh UP, et al MicroRNA let‐7e is associated with the pathogenesis of experimental autoimmune encephalomyelitis. Eur J Immunol 2013; 43:104–14. [DOI] [PMC free article] [PubMed] [Google Scholar]
- 33. Afkarian M, Sedy JR, Yang J, Jacobson NG, Cereb N, Yang SY, et al T‐bet is a STAT1‐induced regulator of IL‐12R expression in naive CD4+ T cells. Nat Immunol 2002; 3:549–57. [DOI] [PubMed] [Google Scholar]
- 34. Derfuss T, Kuhle J, Lindberg R, Kappos L. Natalizumab therapy for multiple sclerosis. Semin Neurol 2013; 33:26–36. [DOI] [PubMed] [Google Scholar]
- 35. Iaffaldano P, Lucchese G, Trojano M. Treating multiple sclerosis with natalizumab. Expert Rev Neurother 2011; 11:1683–92. [DOI] [PubMed] [Google Scholar]
- 36. Meira M, Sievers C, Hoffmann F, Rasenack M, Kuhle J, Derfuss T, et al Unraveling natalizumab effects on deregulated miR‐17 expression in CD4+ T cells of patients with relapsing–remitting multiple sclerosis. J Immunol Res 2014; 2014:897249. [DOI] [PMC free article] [PubMed] [Google Scholar]
- 37. Honardoost MA, Kiani‐Esfahani A, Ghaedi K, Etemadifar M, Salehi M. miR‐326 and miR‐26a, two potential markers for diagnosis of relapse and remission phases in patient with relapsing–remitting multiple sclerosis. Gene 2014; 544:128–33. [DOI] [PubMed] [Google Scholar]
- 38. Miyazaki Y, Li R, Rezk A, Misirliyan H, Moore C, Farooqi N, et al A novel MicroRNA‐132‐surtuin‐1 axis underlies aberrant B‐cell cytokine regulation in patients with relapsing–remitting multiple sclerosis. PLoS ONE 2014; 9:e105421. [DOI] [PMC free article] [PubMed] [Google Scholar]
- 39. Tuddenham L, Wheeler G, Ntounia‐Fousara S, Waters J, Hajihosseini MK, Clark I, et al The cartilage specific microRNA‐140 targets histone deacetylase 4 in mouse cells. FEBS Lett 2006; 580:4214–7. [DOI] [PubMed] [Google Scholar]
- 40. Miyaki S, Nakasa T, Otsuki S, Grogan SP, Higashiyama R, Inoue A, et al MicroRNA‐140 is expressed in differentiated human articular chondrocytes and modulates interleukin‐1 responses. Arthritis Rheum 2009; 60:2723–30. [DOI] [PMC free article] [PubMed] [Google Scholar]
- 41. Tardif G, Hum D, Pelletier JP, Duval N, Martel‐Pelletier J. Regulation of the IGFBP‐5 and MMP‐13 genes by the microRNAs miR‐140 and miR‐27a in human osteoarthritic chondrocytes. BMC Musculoskelet Disord 2009; 10:148. [DOI] [PMC free article] [PubMed] [Google Scholar]
- 42. Hwang S, Park SK, Lee HY, Kim SW, Lee JS, Choi EK, et al miR‐140‐5p suppresses BMP2‐mediated osteogenesis in undifferentiated human mesenchymal stem cells. FEBS Lett 2014; 588:2957–63. [DOI] [PubMed] [Google Scholar]
- 43. Eberhart JK, He X, Swartz ME, Yan YL, Song H, Boling TC, et al MicroRNA Mirn140 modulates Pdgf signaling during palatogenesis. Nat Genet 2008; 40:290–8. [DOI] [PMC free article] [PubMed] [Google Scholar]
- 44. Li W, He F. Monocyte to macrophage differentiation‐associated (MMD) targeted by miR‐140‐5p regulates tumor growth in non‐small cell lung cancer. Biochem Biophys Res Commun 2014; 450:844–50. [DOI] [PubMed] [Google Scholar]
- 45. Takata A, Otsuka M, Yoshikawa T, Kishikawa T, Hikiba Y, Obi S, et al MicroRNA‐140 acts as a liver tumor suppressor by controlling NF‐κB activity by directly targeting DNA methyltransferase 1 (Dnmt1) expression. Hepatology 2013; 57:162–70. [DOI] [PMC free article] [PubMed] [Google Scholar]
- 46. Moore ML, Newcomb DC, Parekh VV, Van Kaer L, Collins RD, Zhou W, et al STAT1 negatively regulates lung basophil IL‐4 expression induced by respiratory syncytial virus infection. J Immunol 2009; 183:2016–26. [DOI] [PMC free article] [PubMed] [Google Scholar]
- 47. Gocke AR, Cravens PD, Ben LH, Hussain RZ, Northrop SC, Racke MK, et al T‐bet regulates the fate of Th1 and Th17 lymphocytes in autoimmunity. J Immunol 2007; 178:1341–8. [DOI] [PubMed] [Google Scholar]
- 48. Thai TH, Calado DP, Casola S, Ansel KM, Xiao C, Xue Y, et al Regulation of the germinal center response by microRNA‐155. Science 2007; 316:604–8. [DOI] [PubMed] [Google Scholar]
- 49. Rodriguez A, Vigorito E, Clare S, Warren MV, Couttet P, Soond DR, et al Requirement of bic/microRNA‐155 for normal immune function. Science 2007; 316:608–11. [DOI] [PMC free article] [PubMed] [Google Scholar]
- 50. Otaegui D, Baranzini SE, Armananzas R, Calvo B, Munoz‐Culla M, Khankhanian P, et al Differential micro RNA expression in PBMC from multiple sclerosis patients. PLoS ONE 2009; 4:e6309. [DOI] [PMC free article] [PubMed] [Google Scholar]
- 51. Papaioannou G, Inloes JB, Nakamura Y, Paltrinieri E, Kobayashi T. let‐7 and miR‐140 microRNAs coordinately regulate skeletal development. Proc Natl Acad Sci U S A 2013; 110:E3291–300. [DOI] [PMC free article] [PubMed] [Google Scholar]