

Abstract
Objective
To examine self‐reported financial strain in relation to pharmacy utilization adherence data.
Data Sources/Study Setting
Survey, administrative, and electronic medical data from Kaiser Permanente Northern California.
Study Design
Retrospective cohort design (2006, n = 7,773).
Data Collection/Extraction Methods
We compared survey self‐reports of general and medication‐specific financial strain to three adherence outcomes from pharmacy records, specifying adjusted generalized linear regression models.
Principal Findings
Eight percent and 9 percent reported general and medication‐specific financial strain. In adjusted models, general strain was significantly associated with primary nonadherence (RR = 1.37; 95 percent CI: 1.04–1.81) and refilling late (RR = 1.34; 95 percent CI: 1.07–1.66); and medication‐specific strain was associated with primary nonadherence (RR = 1.42, 95 percent CI: 1.09–1.84).
Conclusions
Simple, minimally intrusive questions could be used to identify patients at risk of poor adherence due to financial barriers.
Keywords: Adherence, diabetes, managed care, cost of care
Financial strain is defined as the inability to afford necessary items, such as food, clothing, and rent. It is common in the United States, with 14 percent of respondents in 2008 stating that they could not afford all of their essential expenses (Organisation for Economic Cooperation and Development, 2008). Financial strain may force individuals to choose among competing demands, such as skipping meals to pay for medicines or delaying health care visits to pay for utilities. While most common among the poor, financial strain may occur across a wide range of income levels depending on other household expenses.
Similarly, medication costs can be substantial, especially for patients with chronic illness. On a recent national survey, 27 percent of adults reported not filling a prescription due to costs (The Commonwealth Fund, 2012). Specific to diabetes patients, 19 percent of older diabetes patients reported cutting back on medications to save money (Piette, Heisler, and Wagner 2004a,b), 14 percent of insured diabetes patients in integrated health care delivery systems reported cost‐related medication underuse (Tseng et al. 2008), and 23 percent of all diabetes patients faced an out‐of‐pocket cost burden that was >10 percent of the total family budget (Li et al. 2014). Patients with lower incomes, higher out‐of‐pocket costs, younger age, poorer physical/mental health status, and lower ratings of the patient–provider relationship are significantly more likely to report cost‐related medication nonadherence (Mojtabai and Olfson 2003; Briesacher, Gurwitz, and Soumerai 2007). Reports of cost‐related medication nonadherence have been linked to poorer health outcomes, including declines in health status, increased hospitalizations, and incident depression among older adults (Heisler et al. 2004, 2010).
Many studies have examined income in relation to self‐reported medication adherence. However, both variables are potentially problematic. Some respondents are unwilling to report their income, resulting in large amounts of missing data (Kim et al. 2007), and income assessments can be less valid among older adults (such as many individuals with diabetes) who have retired from the workforce (National Council on Aging, 2012). Moreover, the impact on income on financial strain is highly dependent on expenditures, which can be highly variable. In addition, self‐reported medication adherence may be biased due to social desirability (Adams et al. 1999).
We conducted a study of financial strain and medication adherence using the Diabetes Study of Northern California (DISTANCE) cohort, which includes diabetes patients at Kaiser Permanente Northern California (Kaiser). The current study makes improvements over previous research. First, we assess two measures of financial strain that may be more informative and more readily assessed than income: general financial strain (i.e., not being able to afford necessary items like food or clothing) and medication‐specific financial strain (i.e., not being able to afford medications due to cost). We hypothesize that while both measures of financial strain will predict poor medication adherence, the strongest associations will occur for medication‐specific financial strain. Third, we assess adherence to diabetes medications using objective pharmacy utilization data that are less subject to self‐report bias. Finally, we differentiated three aspects of nonadherence using a “new prescription cohort design” (Karter et al. 2009) to examine adherence from initiation to continuation.
Methods
In 2005–2006, we surveyed a racially/ethnically stratified sample of diabetes patients aged 30–75 from the Kaiser Diabetes Registry, using written, web, or computer‐assisted telephone interviews (CATIs). This DISTANCE cohort had an overall response rate of 62 percent (n = 20,188). The questionnaire was offered in five languages and captured demographics, social/psychological characteristics, and health‐related information. These survey data were then linked to each respondent's electronic health record, including visit and pharmacy utilization. Further details about the DISTANCE methodology have been published elsewhere (Moffet et al. 2008). Individuals in this cohort were taking an average of 4–5 chronic medications in total.
For this analysis, we included new electronic prescriptions for any cardiometabolic medication (i.e., glucose, blood pressure, or lipid‐lowering drugs) ordered in 2006. Each individual patient could start more than one new medication during the study period. To ensure that these were orders for new medications, we excluded medications for which there were prior prescriptions or refills in the previous 24 months. For each new prescription, we tracked refill information using the pharmacy utilization database for the subsequent 180 days from the date the provider submitted the new, electronic prescription order. Because days' supply provided at each fill may impact adherence, we limited comparisons to prescriptions for a 100‐day supply of medication—the standard supply dispensed in Kaiser. Prior analyses have demonstrated that the 96 percent of Kaiser patients with pharmacy benefits fill virtually all of the medications within the Kaiser pharmacy system (Karter et al. 2009).
Outcomes
Adherence was measured in several ways subsequent to a new prescription (see Figure 1). First, we examined “primary nonadherence,” meaning an individual never filled the new prescription. Next, among patients who were primary adherent, we assessed “early stage nonpersistence,” or individuals who never refilled the prescription. Finally, among patients who were both primary adherent and early stage persistent, we identified individuals whose second dispensing was “refilled late,” which we defined as more than 125 days from the first dispensing (i.e., only had the new medication available for 100 of 125 days, or 80 percent of the time with medication supply). This is comparable to the new prescription medication gap adherence calculation that has been validated against measures of physiological risk factor control using administrative pharmacy data (Karter et al. 2009). Our approach therefore did not allow for potential stockpiling of pills by patients.
Figure 1.
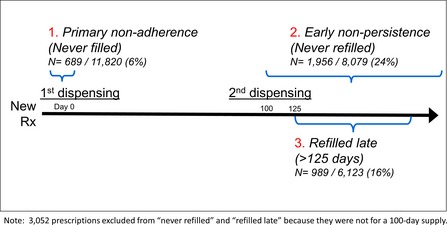
Cohort Assessments and Outcome Definitions
Financial Strain
We examined two primary exposures. First, we examined general financial strain using the single survey item: “During the past 12 months, how often did it happen that you did not have enough money to buy food, clothes or other things you needed?” Because responses were highly skewed, they were dichotomized as never versus not very/fairly/very often. Second, we examined medication‐specific financial strain using the item: “In the past 12 months, did you use less medication than was prescribed because of cost?” (yes vs. no). This second measure of financial strain is conceptually distinct from overall patient reports of nonadherence, as it is specific to cost as the reason for nonuse.
Covariates
We examined several variables that the literature suggested might confound the association between financial strain and nonadherence (Piette et al. 2006; Zivin et al. 2010). These covariates included age, gender, income (<$25,000, $25,000–$49,999, $50,000–$79,999, and $80,000 or more), educational attainment (classified as <high school, high school graduate/GED, and ≥some college), race/ethnicity (white, black, Latino, East Asian [primarily Chinese American], Filipino, or Other), self‐reported health status (fair/poor vs. good/very good/excellent), Charlson comorbidity score (Charlson et al. 1994) (an overall assessment of the number and severity of other health conditions), medication type (diabetes, blood pressure, or cholesterol), total number of chronic medications (pulled from the electronic health record), total copay burden (summed across all medications), and the specific cardiometabolic medication copay amount (in dollars). We examined all classes of cardiometabolic medications with the exception of insulin; insulin adherence cannot be accurately assessed from pharmacy records because flexible dosing of this medication does not allow calculation of days' supply.
Statistical Analyses
We first examined the crude relationship between the two financial strain measures using a chi‐squared test and correlation coefficient. We also examined financial strain in relation to patient demographic and health characteristics, using t‐test and chi‐squared tests. All of these analyses were conducted at the patient level.
Next, analyzing at the prescription level, we reported the unadjusted proportions of primary nonadherence, early stage nonpersistence, and refilling late, comparing those reporting versus not reporting both general and medication‐specific financial strain using chi‐squared tests. For our final unadjusted examination (also using a chi‐squared test), we compared the nonadherence outcomes by a joint indicator of reporting none, general strain only, medication strain only, or both types of financial strain.
Finally, we completed a series of adjusted regression models. We examined two‐level hierarchical regression models at the prescription level, clustering multiple prescriptions by patient. We examined each financial strain predictor in separate regression models. We specified a generalized linear regression model with a logit link and Poisson family and robust standard errors (Zou 2004) to estimate relative risks (RR) of for each type of nonadherence because odds ratios from logistic regression models may generate biased effect sizes for a common outcome. We also conducted two sensitivity analyses where we repeated the analyses, (1) further adjusting for income and (2) adjusting for both measures of financial strain simultaneously.
Results
There were 11,820 new prescriptions among 7,773 respondents. The average age was 59 years; 51 percent were male, 19 percent were white, and 17 percent had less than a high school education. The majority of patients (86 percent, n = 5,583) reported no financial strain (of either kind), while 5 percent reported only general strain (n = 336), 6 percent only medication‐specific strain (n = 403), and 2 percent experienced both (n = 145) (Table 1). General and medication‐specific financial strain were weakly correlated, r = 0.22 (p < .01). Those with either type of reported financial strain were younger, less educated, and in poorer health (Table 2). While those reporting general financial strain had lower average copayments for their cardiometabolic medication compared to those not reporting general financial strain, those reporting medication‐specific financial strain had higher average copays. Overall, 5 percent of the sample had no copays and 5 percent faced copays higher than $35 for a single refill of one medication. Finally, when examining the distribution of income by the financial strain measures, the highest reports of financial strain were among those with the lowest income; however, even among those with annual incomes over $50,000, 12 percent reported general financial strain and 29 percent reported medication‐specific financial strain—indicating that financial strain was not limited to lower income levels.
Table 1.
Relationship of General Financial Strain and Medication‐Specific Financial Strain
| General Strain | Medication‐Specific Strain | Total | |
|---|---|---|---|
| No | Yes | ||
| No | 5,583 (86) | 403 (6) | 5,986 (93) |
| Yes | 336 (5) | 145 (2) | 481 (7) |
| Total | 5,919 (92) | 548 (8) | 6,467 |
Note. Sample sizes represent individuals.
Table 2.
Sample Characteristics
| Financial Strain | Medication‐Specific Financial Strain | |||||
|---|---|---|---|---|---|---|
| No (N = 7,164) | Yes (N = 609) | p‐value | No (N = 6,018) | Yes (N = 566) | p‐value | |
| Mean age (SD) | 59.1 (10.0) | 55.7 (10.5) | <.01 | 59.1 (9.9) | 57.5 (10.6) | <.01 |
| % Male | 3,731 (52) | 223 (37) | <.01 | 3,071 (51) | 270 (48) | .13 |
| % Education | ||||||
| <High school | 1,131 (16) | 150 (25) | <.01 | 893 (15) | 114 (21) | <.01 |
| High school | 1,904 (27) | 174 (29) | 1,540 (26) | 148 (27) | ||
| Some college | 1,789 (25) | 187 (31) | 1,560 (26) | 178 (32) | ||
| College grad+ | 2,209 (31) | 88 (15) | 1,897 (32) | 112 (20) | ||
| % Race/ethnicity | ||||||
| White | 1,316 (19) | 150 (25) | <.01 | 1,142 (19) | 107 (19) | <.01 |
| Black | 1,316 (19) | 150 (25) | 1,036 (17) | 134 (24) | ||
| Latino | 1,687 (24) | 75 (13) | 1,483 (25) | 117 (21) | ||
| Asian | 806 (11) | 26 (4) | 668 (11) | 31 (6) | ||
| Filipino | 901 (13) | 77 (13) | 777 (13) | 63 (11) | ||
| Other | 1,077 (15) | 122 (20) | 849 (14) | 108 (19) | ||
| % Income | ||||||
| <$25,000 | 1,077 (17) | 290 (51) | <.01 | 888 (16) | 187 (36) | <.01 |
| $25,000– $49,999 | 1,847 (28) | 204 (36) | 1,555 (29) | 185 (35) | ||
| $50,000– $79,999 | 1,680 (26) | 53 (9) | 1,373 (25) | 111 (21) | ||
| $80,000 or more | 1,897 (29) | 19 (3) | 1,588 (29) | 41 (8) | ||
| Avg. copayment (SD) | $14.74 (20) | $12.47 (18) | <.01 | $14.28 (20) | $18.99 (27) | <.01 |
| Avg. total number of chronic medications (SD) | 5.4 (3.2) | 5.6 (3.6) | .23 | 5.5 (3.2) | 5.6 (3.6) | .76 |
| Avg. total medication copay burden (SD) | $113.76 (157) | $91.48 (115) | <.01 | $109.98 (147) | $149.58 (168) | <.01 |
| % Fair/poor health | 2,179 (35) | 299 (58) | <.01 | 2,121 (35) | 290 (52) | <.01 |
| Mean Charlson comorbidity score (SD) | 1.78 (1.4) | 1.99 (1.5) | <.01 | 1.79 (1.4) | 1.93 (1.4) | .03 |
Note. Sample sizes represent individuals.
A total of 6 percent of patients were primary nonadherent for the new cardiometabolic prescription, 24 percent were early stage nonpersistent, and 16 percent refilled late (Figure 1). There were significant, unadjusted associations between the two financial strain measures and each of the three adherence measures (Table 3). Those reporting general financial strain versus not were significantly more likely to be primary nonadherent (8 percent vs. 6 percent), early stage nonpersistent (28 percent vs. 23 percent), and late refillers (23 percent vs. 16 percent). Those reporting medication‐specific financial strain versus not were also significantly more likely to be primary nonadherent (8 percent vs. 5 percent), early stage nonpersistent (30 percent vs. 23 percent), and late refillers (20 percent vs. 15 percent). When examining both types of strain jointly, those reporting both types of financial strain had even higher rates of primary nonadherence (10 percent), early stage nonpersistence (35 percent), and refilling late (26 percent).
Table 3.
Unadjusted Proportions of Nonadherence
| Proportion with Primary Nonadherence | Proportion with Early Stage Nonpersistence | Proportion Who Refilled Late | |
|---|---|---|---|
| General financial strain | |||
| No | 609 (6)a | 1,766 (23)a | 883 (16)a |
| Yes | 80 (8) | 190 (28) | 106 (23) |
| Medication‐specific financial strain | |||
| No | 469 (5)a | 1,450 (23)a | 755 (15)a |
| Yes | 73 (8) | 165 (30) | 77 (20) |
| Both measures | |||
| No strain | 425 (5)a | 1,321 (23)a | 678 (15)a |
| General strain | 41 (8) | 100 (27) | 63 (24) |
| Medication strain | 47 (8) | 104 (28) | 51 (19) |
| Both types of strain | 23 (10) | 53 (35) | 26 (26) |
Sample sizes represent prescriptions, not individuals.
p < .05 for all comparisons.
In adjusted models (Table 4), those reporting general financial strain were significantly more likely to be primary nonadherent (RR = 1.37; 95 percent CI: 1.04–1.81) and refill late (RR = 1.34, 95 percent CI: 1.07–1.66) compared to those without general financial strain. Those reporting medication‐specific strain were significantly more likely to be primary nonadherent (RR = 1.42; 95 percent CI: 1.09–1.84) compared to those without medication‐specific financial strain.
Table 4.
Relative Risk Regression Models for Nonadherence
| Adjusted Models without Income | Adjusted Models with Income | |
|---|---|---|
| RR (95% CI) | RR (95% CI) | |
| Primary nonadherencea | ||
| General strain (n = 9,189) | 1.37 (1.04, 1.81)d | 1.27 (0.96 1.68) |
| Medication strain (n = 8,777) | 1.42 (1.09, 1.84)d | 1.32 (1.01, 1.73)d |
| Early stage nonpersistenceb | ||
| General strain (n = 6,287) | 1.08 (0.92, 1.27) | 1.01 (0.85, 1.19) |
| Medication strain (n = 6,007) | 1.16 (0.99, 1.35) | 1.10 (0.94, 1.28) |
| Refilled latec | ||
| General strain (n = 4,781) | 1.34 (1.07, 1.66)d | 1.40 (1.11, 1.75)d |
| Medication strain (n = 4,590) | 1.24 (0.98, 1.57) | 1.26 (0.98, 1.60) |
Sample sizes represent prescriptions, not individuals.
Two separate regression models for general and medication‐specific financial strain, both adjusting for age, sex, education, race/ethnicity, fair/poor health status, Charlson comorbidity score, total medications, total medication costs, and drug type.
Two separate regression models for general and medication‐specific financial strain, both adjusting for age, sex, education, race/ethnicity, fair/poor health status, Charlson comorbidity score, total medications, total medication costs, first dispensing copayment amount, and drug type.
Two separate regression models for general and medication‐specific financial strain, both adjusting for age, sex, education, race/ethnicity, fair/poor health status, Charlson comorbidity score, total medications, total medication costs, second dispensing copayment amount, and drug type.
p < .05.
When additionally adjusting for income, the associations between medication‐specific financial strain and primary nonadherence and general financial strain and refilling late persisted (Table 4). In these models, those with lower levels of income (i.e., <$25,000, $25,000–$49,999, and $50,000–$79,999) remained significantly more likely to be both primary nonadherent and early stage nonpersistent compared to those with the highest income (<$80,000), although the effect size did not trend across levels of income (data not shown).
In the final sensitivity analysis adjusting for financial and medication‐specific strain simultaneously (data not shown), the findings were very similar, with the associations between medication‐specific strain and primary nonadherence as well as general financial strain and refilling late persisting.
Discussion
We found that financial strain—both general financial strain and medication‐specific financial strain—were associated with medication nonadherence assessed from electronic prescribing and pharmacy utilization datasets in Kaiser. Those reporting both types of strain had the highest proportions of nonadherence. In fully adjusted models, general financial strain was associated with primary nonadherence and refilling late, and medication‐specific strain was associated with all three adherence outcomes. These findings have real‐world implications, as diabetes patients in this population were taking an average of 4–5 chronic cardiometabolic medications each. As such, the cumulative effect of financial strain on poor adherence across all these medications over time (i.e., beyond the first two dispensings examined here) is likely substantial and could have cumulative detrimental health effects.
These findings are consistent with previous literature that found associations between medication‐specific financial strain and self‐reported assessments of poor adherence (Mojtabai and Olfson 2003; Piette, Heisler, and Wagner 2004a,b; Elliott et al. 2007). Furthermore, our findings are particularly relevant in light of evidence about copays and adherence. A recent randomized trial has suggested that eliminating copays can improve adherence (Choudhry et al. 2011) and reduce racial/ethnic disparities in care (Choudhry et al. 2014), and a larger body of observational and quasi‐experimental studies have shown that increases in copays can affect medication refilling behaviors (Soumerai et al. 1987; Goldman, Joyce, and Zheng 2007). In particular, there is growing evidence that removing financial barriers for medications with the largest clinical benefit (sometimes referred to as value‐based insurance design) can be most influential for improving adherence (Fendrick et al. 2001; Wagner, Heisler, and Piette 2008; Chernew and Fendrick 2009).
As risk stratifiers, both general and medication‐specific financial strain may better predict a broader spectrum of poor adherence than income alone—as several of the associations between the financial strain indicators and adherence remained significant even after adjusting for income. Patients may be more reluctant to self‐report income compared to reporting the presence of financial strain. It is important to note that previous studies have found that patient reports of medication‐related financial strain may actually reflect nonfinancial barriers to adherence: including patient's perceptions about the need for the medication (i.e., lack of confidence that the medication is efficacious) and potential side effects (Piette, Heisler, and Wagner 2006; Piette 2009; Piette et al. 2011).
Some study limitations should be noted. Our assessment was restricted to the Kaiser diabetes population, and therefore our findings may not be generalizable to other settings or populations. Because all patients were fully insured and had uniform access to integrated care, our findings may underestimate the association between financial strain and nonadherence when compared with other population‐based assessments or those in underinsured populations. Kaiser maintains a closed pharmacy system (i.e., pharmacy benefits are only honored at Kaiser Pharmacies), which incentivizes patients to use Kaiser pharmacies. While the capture of medication utilization has been shown to be quite high (Karter et al. 2009), those with no pharmacy benefits or very high copays are more likely to fill prescriptions in non‐Kaiser pharmacies in which case utilization would not be captured. While our sample was diverse with respect to income levels (as well as educational attainment, race/ethnicity, and medication copays), patients at the highest and lowest extremes of income are underrepresented in Kaiser. Moreover, consistent with previous studies, the prevalence of financial strain remained relatively high in this study across the spectrum of income (Piette et al. 2011). Finally, we did not assess other nonfinancial barriers to adherence such as patient beliefs (Aikens and Piette 2009; Piette et al. 2011), social support and mental health (Gellad, Grenard, and Marcum 2011), and patient–provider interpersonal communication and trust (Piette et al. 2005; Ratanawongsa et al. 2013; Bauer et al. 2014).
We found that patients reporting financial strain had difficulty with adherence, suggesting that some patients may face tough financial choices that can impact their health. In future survey research on diabetes self‐management, measuring both general and medication‐specific financial barriers should be a priority. Moreover, our findings may also have implications for how providers communicate and counsel patients about adherence and medication costs and tradeoffs (Tseng et al. 2010). Although nonadherence is a multifactorial issue that should be addressed with all patients, financial strain may represent an efficient and less intimidating way to identify and/or stratify patients at high risk of cost‐related nonadherence. Because they can be assessed with single items, financial strain could also be useful as part of periodic assessments by providers or care managers who are positioned to assist patients at risk, to start the discussion on (1) the importance of taking their medications as prescribed and (2) ways to reduce the financial burden associated with pharmacy expenditures (e.g., seeking financial assistance, switching to lower cost alternatives).
Supporting information
Appendix SA1: Author Matrix.
Acknowledgments
Joint Acknowledgment/Disclosure Statement: The DISTANCE Study was funded by NIH (R01 DK065664, R01 HD46113, R01 DK080726, and R01 DK081796). Courtney Lyles is supported by a career development award from AHRQ (K99 HS022408). NIDDK's Centers for Diabetes Translational Research provided additional support for John Piette (P30 DK092926), and Andrew Karter and Dean Schillinger (P30 DK092924).
Disclosures: None.
Disclaimers: None.
References
- Adams, A. S. , Soumerai S. B., Lomas J., and Ross‐Degnan D.. 1999. “Evidence of Self‐Report Bias in Assessing Adherence to Guidelines.” International Journal for Quality in Health Care: Journal of the International Society for Quality in Health Care/ISQua 11 (3): 187–92. [DOI] [PubMed] [Google Scholar]
- Aikens, J. E. , and Piette J. D.. 2009. “Diabetic Patients' Medication Underuse, Illness Outcomes, and Beliefs about Antihyperglycemic and Antihypertensive Treatments.” Diabetes Care 32 (1): 19–24. [DOI] [PMC free article] [PubMed] [Google Scholar]
- Bauer, A. M. , Parker M. M., Schillinger D., Katon W., Adler N., Adams A. S., Moffet H. H., and Karter A. J.. 2014. “Associations between Antidepressant Adherence and Shared Decision‐Making, Patient‐Provider Trust, and Communication among Adults with Diabetes: Diabetes Study of Northern California (DISTANCE).” Journal of General Internal Medicine 29 (8): 1139–47. [DOI] [PMC free article] [PubMed] [Google Scholar]
- Briesacher, B. A. , Gurwitz J. H., and Soumerai S. B.. 2007. “Patients At‐Risk for Cost‐Related Medication Nonadherence: A Review of the Literature.” Journal of General Internal Medicine 22 (6): 864–71. [DOI] [PMC free article] [PubMed] [Google Scholar]
- Charlson, M. , Szatrowski T. P., Peterson J., and Gold J.. 1994. “Validation of a Combined Comorbidity Index.” Journal of Clinical Epidemiology 47 (11): 1245–51. [DOI] [PubMed] [Google Scholar]
- Chernew, M. , and Fendrick M.. 2009. “Clinically Sensitive Cost‐Sharing for Prescription Drugs: Thinking Beyond the Silos.” Medical Care 47 (5): 505–7. [DOI] [PubMed] [Google Scholar]
- Choudhry, N. K. , Avorn J., Glynn R. J., Antman E. M., Schneeweiss S., Toscano M., Reisman L., Fernandes J., Spettell C., Lee J. L., Levin R., Brennan T., and Shrank W. H.. 2011. “Full Coverage for Preventive Medications after Myocardial Infarction.” New England Journal of Medicine 365 (22): 2088–97. [DOI] [PubMed] [Google Scholar]
- Choudhry, N. K. , Bykov K., Shrank W. H., Toscano M., Rawlins W. S., Reisman L., Brennan T. A., and Franklin J. M.. 2014. “Eliminating Medication Copayments Reduces Disparities in Cardiovascular Care.” Health Affairs (Millwood) 33 (5): 863–70. [DOI] [PubMed] [Google Scholar]
- Elliott, R. A. , Ross‐Degnan D., Adams A. S., Safran D. G., and Soumerai S. B.. 2007. “Strategies for Coping in a Complex World: Adherence Behavior among Older Adults with Chronic Illness.” Journal of General Internal Medicine 22 (6): 805–10. [DOI] [PMC free article] [PubMed] [Google Scholar]
- Fendrick, A. M. , Smith D. G., Chernew M. E., and Shah S. N.. 2001. “A Benefit‐Based Copay for Prescription Drugs: Patient Contribution Based on Total Benefits, Not Drug Acquisition Cost.” American Journal of Managed Care 7 (9): 861–7. [PubMed] [Google Scholar]
- Gellad, W. F. , Grenard J. L., and Marcum Z. A.. 2011. “A Systematic Review of Barriers to Medication Adherence in the Elderly: Looking Beyond Cost and Regimen Complexity.” American Journal of Geriatric Pharmacotherapy 9 (1): 11–23. [DOI] [PMC free article] [PubMed] [Google Scholar]
- Goldman, D. P. , Joyce G. F., and Zheng Y.. 2007. “Prescription Drug Cost Sharing: Associations with Medication and Medical Utilization and Spending and Health.” Journal of the American Medical Association 298 (1): 61–9. [DOI] [PMC free article] [PubMed] [Google Scholar]
- Heisler, M. , Langa K. M., Eby E. L., Fendrick A. M., Kabeto M. U., and Piette J. D.. 2004. “The Health Effects of Restricting Prescription Medication Use Because of Cost.” Medical Care 42 (7): 626–34. [DOI] [PubMed] [Google Scholar]
- Heisler, M. , Choi H., Rosen A. B., Vijan S., Kabeto M., Langa K. M., and Piette J. D.. 2010. “Hospitalizations and Deaths among Adults with Cardiovascular Disease Who Underuse Medications Because of Cost: A Longitudinal Analysis.” Medical Care 48 (2): 87–94. [DOI] [PMC free article] [PubMed] [Google Scholar]
- Karter, A. J. , Parker M. M., Moffet H. H., Ahmed A. T., Schmittdiel J. A., and Selby J. V.. 2009. “New Prescription Medication Gaps: A Comprehensive Measure of Adherence to New Prescriptions.” Health Services Research 44 (5 Pt 1): 1640–61. [DOI] [PMC free article] [PubMed] [Google Scholar]
- Kim, S. , Egerter S., Cubbin C., Takahashi E. R., and Braveman P.. 2007. “Potential Implications of Missing Income Data in Population‐Based Surveys: An Example from a Postpartum Survey in California.” Public Health Reports 122 (6): 753–63. [DOI] [PMC free article] [PubMed] [Google Scholar]
- Li, R. , Barker L. E., Shrestha S., Zhang P., Duru O. K., Pearson‐Clarke T., and Gregg E. W.. 2014. “Changes over Time in High Out‐of‐Pocket Health Care Burden in U.S. Adults with Diabetes, 2001‐2011.” Diabetes Care 37 (6): 1629–35. [DOI] [PMC free article] [PubMed] [Google Scholar]
- Moffet, H. H. , Adler N., Schillinger D., Ahmed A. T., Laraia B., Selby J. V., Neugebauer R., Liu J. Y., Parker M. M., Warton M., and Karter A. J.. 2008. “Cohort Profile: The Diabetes Study of Northern California (DISTANCE)–Objectives and Design of a Survey Follow‐Up Study of Social Health Disparities in a Managed Care Population.” International Journal of Epidemiology 38 (1): 38–47. [DOI] [PMC free article] [PubMed] [Google Scholar]
- Mojtabai, R. , and Olfson M.. 2003. “Medication Costs, Adherence, and Health Outcomes among Medicare Beneficiaries.” Health Affairs 22 (4): 220–9. [DOI] [PubMed] [Google Scholar]
- National Council on Aging . 2012. “Economic Security for Seniors” [accessed on October 23, 2013]. Available at http://www.ncoa.org/press-room/fact-sheets/economic-security-for.html
- Organisation for Economic Cooperation and Development . 2008. Growing Unequal? Income Distribution and Poverty in OECD Countries. Paris, France: Organisation for Economic Cooperation and Development; [accessed on July 30, 2014]. Available at http://www.oecd.org/social/soc/growingunequalincomedistributionandpovertyinoecdcountries.htm [Google Scholar]
- Piette, J. D. 2009. “Cost‐Related Medication Underuse: A Window into Patients' Medication‐Related Concerns.” Diabetes Spectrum 22 (2): 77–9. [Google Scholar]
- Piette, J. D. , Heisler M., and Wagner T. H.. 2004a. “Cost‐Related Medication Underuse among Chronically Ill Adults: The Treatments People Forgo, How Often, and Who Is at Risk.” American Journal of Public Health 94 (10): 1782–7. [DOI] [PMC free article] [PubMed] [Google Scholar]
- Piette, J. D. , Heisler M., and Wagner T. H.. 2004b. “Problems Paying Out‐of‐Pocket Medication Costs among Older Adults with Diabetes.” Diabetes Care 27 (2): 384–91. [DOI] [PubMed] [Google Scholar]
- Piette, J. D. , Heisler M., and Wagner T. H.. 2006. “Medication Characteristics beyond Cost Alone Influence Decisions to Underuse Pharmacotherapy in Response to Financial Pressures.” Journal of Clinical Epidemiology 59 (7): 739–46. [DOI] [PubMed] [Google Scholar]
- Piette, J. D. , Heisler M., Krein S., and Kerr E. A.. 2005. “The Role of Patient‐Physician Trust in Moderating Medication Nonadherence Due to Cost Pressures.” Archives of Internal Medicine 165 (15): 1749–55. [DOI] [PubMed] [Google Scholar]
- Piette, J. D. , Heisler M., Horne R., and Caleb Alexander G.. 2006. “A Conceptually Based Approach to Understanding Chronically Ill Patients' Responses to Medication Cost Pressures.” Social Science & Medicine 62 (4): 846–57. [DOI] [PubMed] [Google Scholar]
- Piette, J. D. , Beard A., Rosland A. M., and McHorney C. A.. 2011. “Beliefs That Influence Cost‐Related Medication non‐Adherence among the “Haves” and “Have Nots” with Chronic Diseases.” Patient Prefer Adherence 5: 389–96. [DOI] [PMC free article] [PubMed] [Google Scholar]
- Ratanawongsa, N. , Karter A. J., Parker M. M., Lyles C. R., Heisler M., Moffet H. H., Adler N., Warton E. M., and Schillinger D.. 2013. “Communication and Medication Refill Adherence: The Diabetes Study of Northern California.” Journal of the American Medical Association Internal Medicine 173 (3): 210–8. [DOI] [PMC free article] [PubMed] [Google Scholar]
- Soumerai, S. B. , Avorn J., Ross‐Degnan D., and Gortmaker S.. 1987. “Payment Restrictions for Prescription Drugs under Medicaid. Effects on Therapy, Cost, and Equity.” New England Journal of Medicine 317 (9): 550–6. [DOI] [PubMed] [Google Scholar]
- The Commonwealth Fund . 2012. Commonwealth Fund Biennial Health Insurance Survey, Chartpack. New York: The Commonwealth Fund; [accessed on July 30, 2014]. Available at http://www.commonwealthfund.org/~/media/files/publications/fund-report/2013/apr/pdf_collins_insuring_future_biennial_survey_2012_exhibits.pdf [Google Scholar]
- Tseng, C. W. , Tierney E. F., Gerzoff R. B., Dudley R. A., Waitzfelder B., Ackermann R. T., Karter A. J., Piette J., Crosson J. C., Ngo‐Metzger Q., Chung R., and Mangione C. M.. 2008. “Race/Ethnicity and Economic Differences in Cost‐Related Medication Underuse among Insured Adults with Diabetes: The Translating Research into Action for Diabetes Study.” Diabetes Care 31 (2): 261–6. [DOI] [PubMed] [Google Scholar]
- Tseng, C. W. , Waitzfelder B. E., Tierney E. F., Gerzoff R. B., Marrero D. G., Piette J. D., Karter A. J., Curb J. D., Chung R., Mangione C. M., Crosson J. C., and Dudley R. A.. 2010. “Patients' Willingness to Discuss Trade‐Offs to Lower Their Out‐of‐Pocket Drug Costs.” Archives of Internal Medicine 170 (16): 1502–4. [DOI] [PMC free article] [PubMed] [Google Scholar]
- Wagner, T. H. , Heisler M., and Piette J. D.. 2008. “Prescription Drug Co‐Payments and Cost‐Related Medication Underuse.” Health Economics, Policy, and law 3 (Pt 1): 51–67. [DOI] [PubMed] [Google Scholar]
- Zivin, K. , Ratliff S., Heisler M. M., Langa K. M., and Piette J. D.. 2010. “Factors Influencing Cost‐Related Nonadherence to Medication in Older Adults: A Conceptually Based Approach.” Value in Health: The Journal of the International Society for Pharmacoeconomics and Outcomes Research 13 (4): 338–45. [DOI] [PMC free article] [PubMed] [Google Scholar]
- Zou, G. 2004. “A Modified Poisson Regression Approach to Prospective Studies with Binary Data.” American Journal of Epidemiology 159 (7): 702–6. [DOI] [PubMed] [Google Scholar]
Associated Data
This section collects any data citations, data availability statements, or supplementary materials included in this article.
Supplementary Materials
Appendix SA1: Author Matrix.