

Abstract
Aim
In cases of paracetamol (acetaminophen, APAP) overdose, an accurate estimate of tissue‐specific paracetamol pharmacokinetics (PK) and ingested dose can offer health care providers important information for the individualized treatment and follow‐up of affected patients. Here a novel methodology is presented to make such estimates using a standard serum paracetamol measurement and a computational framework.
Methods
The core component of the computational framework was a physiologically‐based pharmacokinetic (PBPK) model developed and evaluated using an extensive set of human PK data. Bayesian inference was used for parameter and dose estimation, allowing the incorporation of inter‐study variability, and facilitating the calculation of uncertainty in model outputs.
Results
Simulations of paracetamol time course concentrations in the blood were in close agreement with experimental data under a wide range of dosing conditions. Also, predictions of administered dose showed good agreement with a large collection of clinical and emergency setting PK data over a broad dose range. In addition to dose estimation, the platform was applied for the determination of optimal blood sampling times for dose reconstruction and quantitation of the potential role of paracetamol conjugate measurement on dose estimation.
Conclusions
Current therapies for paracetamol overdose rely on a generic methodology involving the use of a clinical nomogram. By using the computational framework developed in this study, serum sample data, and the individual patient's anthropometric and physiological information, personalized serum and liver pharmacokinetic profiles and dose estimate could be generated to help inform an individualized overdose treatment and follow‐up plan.
Keywords: acetaminophen, Bayesian, overdose, paracetamol, PBPK, pharmacokinetic
What is Already Known About This Subject
Many of the pharmacokinetic measures used to characterize paracetamol overdoses were derived from therapeutic dosing studies.
Current assessment and treatment plans for paracetamol overdose cases generally rely on a generic methodology involving the use of a clinical nomogram.
Self‐reported dose alone is a poor predictor of risk following paracetamol overdose, and lack of accurate knowledge of the ingested dose may hamper the effective long term management of these cases.
What This Study Adds
It provides a well‐validated paracetamol PBPK model for humans under overdose conditions and a clinically‐useful methodology for paracetamol dose estimation.
It elucidates the effect of blood sampling time and additional biomarker measurements on dose reconstruction.
It demonstrates a means to generate personalized serum and liver pharmacokinetic profiles and a dose estimate that should prove useful in developing an individualized overdose treatment and follow‐up plan.
Introduction
Paracetamol (acetaminophen, N‐acetyl‐para‐aminophenol, APAP) is one of the most widely used analgesic and antipyretics in the world. It is metabolized primarily through glucuronidation by conjugation of uridine diphosphate glucuronic acid (UDPGA), and sulfation through conjugation with the 3′‐phosphoadenosine‐5′‐phosphosulfate (PAPS) cofactor. However, paracetamol can also undergo cytochrome P450‐mediated bioactivation to the glutathione depleting, putative hepatotoxicant N‐acetyl‐p‐benzoquinone imine (NAPQI) 1, 2, 3. Owing to its ubiquitous usage, paracetamol is the principle cause of acute liver failure in both the United Kingdom 4, 5 and United States 5, 6. Moreover, ingestion of this drug is the most common, non‐opioid poisoning that results in admission to the hospital in the US, with the majority of these ingestions involving self‐harm attempts 4, 7.
The current standard for evaluating acute paracetamol overdose begins with risk stratification using the Rumack−Matthew nomogram 8. To use the nomogram, parent paracetamol is measured in the serum, plotted against the time of ingestion, and compared with the ‘150 μg ml−1’ line. If the concentration falls above the line, the patient is considered at risk for liver injury and treatment with N‐acetylcysteine (NAC) is indicated 9. There are several commonly used NAC treatment protocols, including the 21 h intravenous protocol, the 72 h oral protocol, and ‘patient tailored’ protocols where treatment is continued until laboratory and clinical endpoints are met.
While treatment for paracetamol overdose in an emergency setting does not absolutely require knowledge of the ingested dose, this information can be important for long term, individualized management of patients. Occasionally, a patient may claim to have ingested a therapeutic dose, while the serum concentration suggests overdose 10, 11. However, the pharmacokinetic parameters that have been used to calculate the dose were derived from studies of therapeutic dosing, which may not accurately portray paracetamol pharmacokinetics in an overdose scenario. Similarly, there are currently no methods for validation of history for case reports claiming paracetamol toxicity following therapeutic dosing. Recent studies 11, 12 noted that, while there is an overall correlation between reported dose and serum concentration, some patients reported ingesting doses that were not consistent with the measured concentrations based the standard pharmacokinetic parameters for paracetamol. Moreover, a retrospective study of over 1200 paracetamol overdose patients 13 concluded that self‐reported dose alone was a poor assessment tool in determining the need for overdose treatment. In summary, knowledge of the ingested paracetamol dose following self‐harm poisoning could help inform treatment plans, aid in validating the history in reports of toxicity, and identify patients who have overdosed, but have provided inaccurate dosing histories.
Here we propose a method for estimating administered dose using paracetamol serum concentration and a computational method based on physiologically‐based pharmacokinetic (PBPK) modelling. PBPK modelling is commonly used to predict time course tissue‐specific concentrations of species based on a specified input dose or exposure 14, 15. This mode of utilizing the model is often called concentration prediction (or forward dosimetry). In contrast, for dose estimation (also known as dose reconstruction or reverse dosimetry), measured levels of the biomarker of interest (e.g. concentration of the parent drug in the blood) are specified as the known quantities and the ingested dose is treated as the unknown. By using Bayesian inference to compute model parameters, inter‐study and inter‐subject variability can be included in the specified data, and uncertainties in model outputs can be quantified 16, 17. Bayesian approaches have been used previously in a few similar contexts, with PBPK models to calculate exposures to environmental toxicants 18, 19, 20 and with compartmental models to incorporate estimates of the veracity of the patients' dosing history to estimate the dose of a drug 21.
In this study, we extended our PBPK model created previously for therapeutic doses of paracetamol 22 to overdoses and developed a Bayesian inferential framework for the two distinct modes of analyses described below (Figure 1). Specifically, we first used the framework in concentration prediction mode to (i) predict parent paracetamol and metabolite concentrations in plasma and compare these predictions to data from clinical measurements over a range of dosing conditions and (ii) relate predicted paracetamol concentrations in the plasma and liver over time. We then employed the computational tool in dose estimation mode to (i) determine the optimal time for blood sampling to minimize the error in a dose estimate, (ii) quantify the potential role of inclusion of metabolite concentration on dose estimates and (iii) predict paracetamol doses and compare them with patient data collected in an emergency setting.
Figure 1.
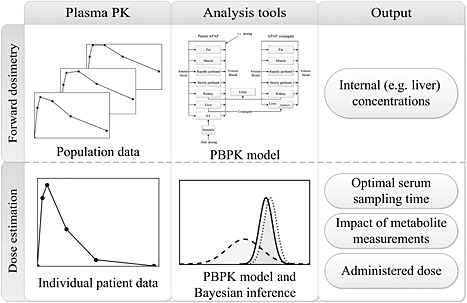
Overview of the analysis framework. The horizontal rows represent the two different modes of analysis, with the input data, analysis tools and simulation output portrayed in the left‐hand, centre and right‐hand panels, respectively. In particular, the upper row represents the methodology for the concentration prediction studies. Here, pharmacokinetic data from multiple studies are used to determine relevant parameter distributions in the PBPK model. Using the model, internal concentrations in the tissue of interest can be estimated and population variability characterized. The lower row illustrates the approach used for the dose estimation studies. Here, a blood sample from an individual patient is obtained. Using the calibrated PBPK model and Bayesian inference, the administered dose, along with optimal sampling times and measurable biomarkers, can be determined
Methods
Physiologically‐based pharmacokinetic modelling
Paracetamol overdose data
We utilized human pharmacokinetic data from a number of high dose (23 to 41 g) studies 23, 24, 25, 26 and a comprehensive set of therapeutic level (250 mg to 5.5 g) studies 22 to re‐parameterize the model from Zurlinden & Reisfeld 22, allowing the resulting model to have applicability over a wide range of doses. The data were divided into two distinct sets: (i) a training set, used for model parameter estimation and (ii) a test set, reserved for evaluation and comparison with model predictions. A summary of the data sets used in the analyses is contained in Table S1 of the supplementary materials.
Additionally, paracetamol overdose data from the Rocky Mountain Poison and Drug Center 27 were used for model verification and comparison with predicted dose estimates. These data were collected from patients admitted to the hospital for overdose treatment following an acute ingestion of paracetamol. Because the doses were self‐reported and the time of ingestion was not precisely known, these data were held out of the training set. These self‐reported doses ranged from 9 to 100 g of orally administered paracetamol and served as realistic case studies for model testing.
Model formulation
The PBPK model structure used in this study (Figure 2) and most of the model equations were the same as those developed previously for therapeutic dosing 22. The full set of governing equations is available in Table S2 of the supplementary material. The differences are related to the mechanistic and mathematical description of paracetamol absorption and the estimated parameters associated with the model equations (Table 1). As confirmed previously 22, under therapeutic conditions, absorption following oral administration of paracetamol is well described using the ‘averaged model’ (i.e. a well‐stirred compartmental model) from Levitt 28. However, under overdose conditions, there is a significant delay in t max 29 that cannot be accounted for with this model. A biologically‐plausible mathematical description for paracetamol absorption that accounts for this lag consists of terms accounting for drug dissolution in the stomach, first order gastric emptying to the gastrointestinal tract, and passive diffusion over the gut lumen 30:
| (1) |
Figure 2.
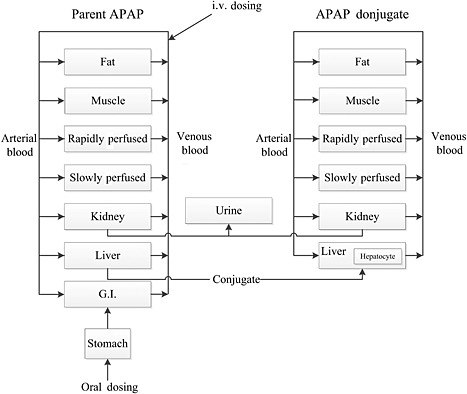
Structure of the PBPK model
Table 1.
Model parameters, N(a,b) denotes a normal distribution with a mean, a, and a coefficient of variation, b; U(a, b) denotes a uniform distribution with minimum and maximum values a and b, respectively. When a prior was not available in the literature (indicated by a dash in the reference column), a broad distribution was used to bound the likely parameter value
| Description | Parameter(units) | Prior | Posterior | Reference |
|---|---|---|---|---|
| Absorption | ||||
| drug dissolution rate | a o (1 h–1) | U(1, 10) | N(4.82, 0.26) | [28] |
| body weight absorption scaling factor | α (unitless) | U(1E‐3, 1) | N(0.16, 0.71) | [25] |
| gastric emptying time constant (fasted state) | t G‐fast (h) | N(0.23, 0.5) | N(0.15, 0.20) | [25] |
| gastric emptying time constant (fed state) | t G‐fed (h) | ‐ | 1 | [31] |
| Phase I metabolism | ||||
| cytochrome P450 KM | (μm) | N(130, 1) | N(125,0.21) | [42] |
| cytochrome P450 Vmax | (μmol h–1‐BW0.75) | U(0.14, 2900) | N(3.68,0.76) | – |
| Phase II metabolism: sulfation | ||||
| sulfation pathway KM | (μm) | N(300, 1) | N(460,0.22) | [38] |
| sulfation pathway substrate inhibition Ki | (μm) | N(526, 1) | N(498,0.21) | [43] |
| sulfation pathway PAPS KM | (unitless) | N(0.5, 0.5) | N(0.37,0.25) | – |
| sulfation pathway Vmax | (μmol h–1‐BW0.75) | U(1, 3.26E6) | N(224,0.25) | – |
| Phase I metabolism: glucuronidation | ||||
| glucuronidation pathway KM | (μm) | N(6.0E4, 1) | N(6.57E3,0.19) | [38] |
| glucuronidation pathway substrate inhibition Ki | (μm) | N(5.8E4, 0.25) | N(5.25E4,0.22) | [44] |
| glucuronidation pathway GA KM | (unitless) | N(0.5, 0.5) | N(0.36,0.24) | – |
| glucuronidation pathway Vmax | (μmol h–1‐BW0.75) | U(1, 3.26E6) | N(5.21E3,0.17) | – |
| Active hepatic transporters | ||||
| APAP‐G hepatic transporter KM | (μm) | N(1.99E4, 0.3) | N(1.57E4,0.23) | [45] |
| APAP‐G hepatic transporter VM | (μmol h–1) | U(1.09E3, 3.26E6) | N(1.02E5,0.51) | – |
| APAP‐S hepatic transporter KM | (μm) | N(2.29E4, 0.22) | N(2.01E4,0.22) | [45] |
| APAP‐S hepatic transporter VM | (μmol h–1) | U(1.09E3, 3.26E6) | N(1.03E7,1.23) | – |
| Cofactor synthesis | ||||
| UDPGA synthesis | (1 h–1) | U(1, 4.43E5) | N(5.32E4,0.55) | – |
| PAPS synthesis | (1 h–1) | U(1, 4.43E5) | N(3.14E3,0.45) | – |
| Renal elimination | ||||
| clearance | (l h–1‐BW0.75) | U(2.48E‐3, 2.718) | N(0.012,0.27) | – |
| glucuronide clearance | (l h–1‐BW0.75) | U(2.48E‐3, 2.718) | N(0.13,0.17) | – |
| sulfate clearance | (l h–1‐BW0.75) | U(2.48E‐3, 2.718) | N(0.16,0.19) | – |
Here, and represent the amount of paracetamol in the stomach in solid and aqueous phases, respectively, I(t) is the initial rate of dosing to the stomach and t G is the gastric emptying time. The function k(t) is the time‐dependent rate of paracetamol dissolution, which was extensively studied in vitro by Özkan et al. 31 who found that dissolution rates were best described using the Hixson–Crowell (HC) model 32, 33:
| (2) |
with , where D is the ingested paracetamol dose, BW is the body weight of the subject, and a0 and α are constants that were fitted in this study to available data 23, 25, 26. This specification for drug dissolution describes the release rate of a drug with a constantly changing surface area. For a large amount of drug in the stomach, this dissolution rate will be governed by the surface area exposed to the aqueous solution and will be proportional to the cubed‐root of the initial mass. In addition, drug formulation will impact the rate of dissolution, and in this study, only immediate release (IR) paracetamol formulations were considered. The amount of paracetamol in the gut compartment, , is described through a simple gut‐to‐blood perfusion description using a blood flow rate, QG, arterial blood concentration, , and venous gut concentration, . The venous gut concentration is determined using the gut : blood partition coefficient, where . This tissue : blood partitioning ratio assumes that equilibrium has been reached between the venous blood and tissue. Equipartitioning of species between the serum and red blood cells was assumed and the effect of clotting factors and protein binding in the blood were neglected. Finally, by adjusting the gastric emptying time, t G, simulations for fasted and fed states could be conducted. Because paracetamol pharmacokinetic studies generally occur when the patient is in a fasted state, t G under those conditions was determined through the Bayesian calibration methodology, while that for the fed state was assumed to be 1 h 34.
Parameter estimation
Parameters for the PBPK model were determined using a hierarchical Bayesian model utilizing a Markov chain Monte Carlo sampling procedure 19, 22, 35, 36, which facilitates quantitation of inter‐study and inter‐subject variability. The specific prior and posterior parameter distributions are presented in Table 1. Five Markov chains were run for 100 000 iterations per chain. Posterior parameter distributions were determined by combining the final 30 000 iterations of each chain. Convergence was assessed using a Gelman–Rubin reduction factor 37 with a maximum threshold of R = 1.05.
Dose estimation studies
Similar to previous exposure estimation studies 18, 19, 20, paracetamol dose reconstruction was cast into the form of a parameter estimation problem. In this scenario, rather than determining population distributions for PBPK model parameters such as enzyme V max or drug clearance rate constants, the Bayesian methodology was used to determine a posterior distribution for the ingested paracetamol dose, given a biomarker concentration, such as paracetamol concentration measured in the serum. Paracetamol dose reconstruction was investigated for two applications: (i) determining the optimal sampling time for dose reconstruction with and without paracetamol conjugate measurements and (ii) reconstructing paracetamol doses based on measured serum concentrations and comparing them with known or self‐reported dose values from patients.
Optimal sampling time
As represented in Figure 3, the procedure for determining optimal sampling time for dose reconstruction was as follows. Following verification and evaluation, the PBPK model was used to simulate time course serum concentrations for the parent drug and two metabolites, N‐acetyl‐para‐aminophenol glucuronide (APAP‐G) and N‐acetyl‐para‐aminophenol sulfate (APAP‐S), following a single oral 400 mg kg–1 dose in a 70 kg person. These simulation results were aggregated to create a set of well‐characterized ‘synthetic data’ to be used subsequently. Next, serum concentrations were numerically sampled from these synthetic data and used to reconstruct a probability distribution for the initial dose. For a given time point, serum paracetamol was either sampled alone or in combination with APAP‐G and/or APAP‐S. This represents a scenario in which a single blood sample is taken and analyzed for parent paracetamol alone or with either or both of the conjugates. Lastly, the reconstructed probability distribution for paracetamol dose was compared with the known initial dose to generate a measure of reconstruction accuracy. This method is similar to studies in which results from a population PBPK model are sampled numerous times to determine an optimal blood sampling time for PBPK model parameter estimation 38, 39, 40. However, rather than comparing a predicted pharmacokinetic endpoint, such as area under the curve or C max, the resulting dose prediction was compared with a known ingested dose.
Figure 3.
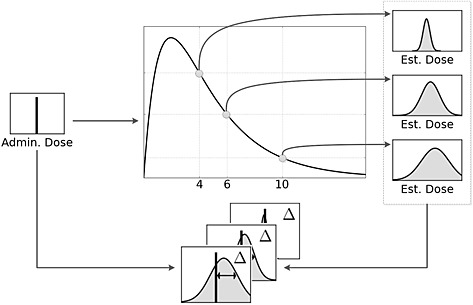
Overview of the dose reconstruction methodology
In addition to blood sampling at a single time point, this methodology was also used to investigate how utilizing multiple blood samples would impact on the error in the paracetamol dose prediction. In this scenario, two time points comprised the data for the Bayesian inference. In this series of simulations, a serum sample taken at 4 h served as the initial point, and a second sample was taken at a variable time interval after that. As in the previous study, the effect of sampling metabolites in addition to the parent paracetamol was systematically investigated.
Determining the administered dose
The final aspect of this study involved estimating the ingested paracetamol dose based on measurements from therapeutic/supratherapeutic trials 22, well‐controlled clinical overdose studies 25, and an emergency setting 27. The dataset from the emergency setting included many cases where the patient did not know the quantity of paracetamol ingested. However, in a substantial number of the cases (n = 61), the patient could approximate the amount of paracetamol ingested and these values could be compared with those from the computational dose reconstruction.
Statistical analysis
The Bayesian inference method results in a posterior probability distribution for the administered dose prediction. However, the true initial dose is a single point parameter. We used the mean square error (MSE), Δ, as a measure of the difference between the predicted probability distribution and the ‘true dose’,
| (3) |
where represents the distribution of predicted doses, i represents an iteration of the posterior chain, N is the number of values comprising the distribution and D is the actual dose taken by the patient. Based on the MSE, Δ quantifies the uncertainty in the dose prediction by accounting for the variance in the resulting dose distribution 40. In this study, the MSE was used principally to help identify optimal blood sampling times. For this optimization application, the MSE was preferable to measures such as the mean absolute error because of its favourable mathematical and computational properties, such as its continuity and differentiability.
Software and computing platform
Concentration prediction and dose estimation simulations were conducted using MCSim v5.4 16, an open source package for the solution of statistical and dynamic models, Monte Carlo stochastic simulations and Bayesian inference simulations. Processing, analysis and visualization of data and simulations results were carried out using scripts written in Python v.2.7.2 41, utilizing the numpy 42, scipy 43, and matplotlib 44 packages. All calculations were performed on a compute cluster running the 64 bit CentOS Linux operating system on six gigabit‐linked Dell 2950 servers, each containing two quad‐core 2.5 GHz Xeon processors and 64 GB of RAM.
Results
Concentration prediction studies
To assess the accuracy of the PBPK model, predictions of plasma concentrations, C PL, of parent paracetamol and two major metabolites, APAP‐G and APAP‐S, were compared with serum concentration data acquired in clinical studies. Figure 4 displays the comparison at 20 mg kg–1 (therapeutic), 80 mg kg–1 (supratherapeutic) and 400 mg kg–1 (overdose) for a 70 kg adult human, including the uncertainty in the model predictions. Within the PBPK model, serum and plasma concentrations were assumed to be identical (see the Methods section).
Figure 4.
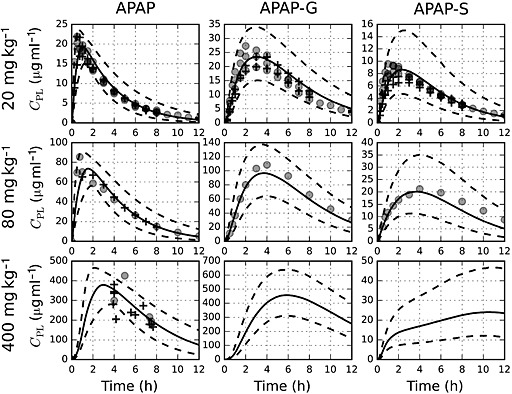
Comparison of model simulations to serum concentration data following a single oral dose of paracetamol administered to an adult patient weighing 70 kg. The solid and dashed lines represent mean and 95% prediction interval simulation results, respectively. Data from the training set are represented by filled circles (o), while data from the test set are denoted by the plus sign (+). Metabolite data were not available for doses greater than 80 mg kg–1
Because a 4 h paracetamol serum sample is the most widely used for assessing potential paracetamol overdose 8, simulations were conducted and results compared with clinical and emergency setting data available across three orders of magnitude of doses at this time point (Figure 5).
Figure 5.
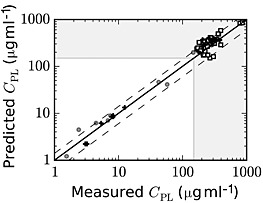
Comparison of model predictions and experimental data for paracetamol serum concentrations at 4 h post‐dosing, where paracetamol overdose is demarcated with the dashed lines at 150 μg ml–1, with concentrations in the shaded area representing potential overdoses. Data from the training and test set are represented as filled circles (o) and plus signs (+), respectively. Open squares (□) represent data from the self‐reported overdose data set
Finally, one of the primary attributes of the PBPK methodology is the ability to predict and characterize tissue‐specific concentrations of species of interest. Using the PBPK model, time course simulations for paracetamol concentrations in both the liver and serum were conducted over the range of doses presented in Figure 4. Figure 6 depicts the dose–response curve for the ratio of liver : plasma paracetamol concentrations, Φ = Cliver/Cplasma, at several times following paracetamol administration.
Figure 6.
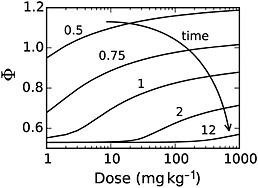
Model simulation results quantifying the ratio of liver : plasma paracetamol concentrations as a function of the paracetamol dose
Dose estimation studies
Optimal sampling time
The first dose estimation study concentrated on quantifying the effect of sampling time and choice of analytes on the accuracy of the paracetamol dose estimation. To estimate the optimal time at which to draw a blood sample, doses were reconstructed by computationally sampling APAP and/or APAP‐G and APAP‐S at a single time point or at two time points. When two time points were used, the first was fixed at 4 h and the second was sampled at a specified time point after that, with a range for the second time point of 4.5 to 11 h post‐dosing. Results from these reconstructions are shown in Figure 7. Here, 400 mg kg–1 served as the known dose, and a smaller mean squared error, Δ, represents less error in the reconstructed dose. APAP‐S results were not included, as they did not alter the error for the reconstructions. Through a large set of additional simulation studies, it was found that the overall pattern for these results did not change when the initial dose was varied.
Figure 7.
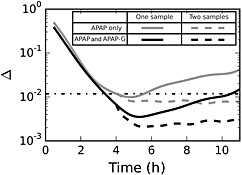
Accuracy of dose reconstruction as a function of time at which the blood is sampled. Light grey lines represent samples where only parent paracetamol is measured, while black lines represent both paracetamol and APAP‐G being used for dose reconstruction. Solid lines represent the dose reconstruction for a single time point and dashed lines represent reconstructions where two serum time points are used, one at 4 h and one at some time later time. The dot‐dashed line represents the estimated mean squared error for the standard sample protocol (paracetamol alone measured at 4 h post‐dosing)
Determining the administered dose
The second dose estimation study focused on dose estimation using data from both a well‐controlled clinical environment and an emergency setting. As discussed previously, the current protocol for treating paracetamol overdose involves measuring paracetamol concentrations in the serum at 4 h post‐dosing. Figure 8 shows the comparison between the reported paracetamol dose and the mean predicted dose using the computational model. These comparisons included data from well‐controlled clinical studies and self‐reported doses from an emergency room setting.
Figure 8.
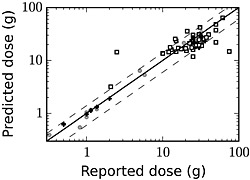
Predicted ingested dose and self‐reported patient dose at 4 h post‐dosing. Data from the training set are represented by filled circles (o), data from the test set are denoted by the plus sign (+), and values from self‐reported paracetamol overdose cases are represented by open squares (□)
Discussion
Two significant objectives were achieved in this study that have potential applications to clinical pharmacology and therapeutics. First, a PBPK model was developed and evaluated to predict paracetamol pharmacokinetics in humans under overdose conditions and second, this model was utilized as part of a methodology to estimate ingested dose and its uncertainty based on the measured concentration of paracetamol and/or its metabolites in a serum sample.
Concentration prediction studies
Because the PBPK model was calibrated using an extensive set of human pharmacokinetic data and incorporated mechanistically‐based descriptions of physiological processes, it was capable of providing accurate simulations of paracetamol pharmacokinetics over a large range of ingested doses. This is demonstrated in Figure 4, in which model predictions for paracetamol pharmacokinetics show good agreement with data from not only the training (calibration) data set, but also a large independent test set.
In addition to parent paracetamol, the model was used to make time course predictions for two significant metabolites, APAP‐G and APAP‐S. At the 20 mg kg–1 and 80 mg kg–1 paracetamol dosing levels, model predictions agreed well with measured values for the metabolite concentrations. At 400 mg kg–1, no metabolite data were available. However, owing to the metabolism mechanism implemented in the model 22, which included bi‐substrate enzyme kinetics coupled with cofactor depletion and synthesis, model predictions show that APAP‐S concentrations do not decrease at later times. This reduction in the rate of APAP‐S formation is in accord with results from experimental studies 45, 46 and is consistent with the depletion of the PAPS cofactor seen in paracetamol dosing studies in rodents 47, 48.
As noted above, when assessing potential paracetamol toxicity, a 4 h serum paracetamol concentration conventionally serves as the biomarker for hepatotoxicity risk. Thus, verification of model predictions at this time point is critical for establishing the clinical utility of the model. Figure 5 illustrates the accuracy of the model in predicting parent paracetamol concentrations for a wide range of doses at this time point, demonstrating reasonable‐to‐very good agreement over three orders of magnitude of paracetamol doses.
Although paracetamol serum concentration is useful as an indicator of hepatotoxicity risk, a more appropriate measure would be the concentration at the site of action. Thus, the PBPK model was employed to make liver‐specific pharmacokinetic predictions, where parent paracetamol was used as a surrogate for the putative toxicant NAPQI. Figure 6 shows the ratio of liver : plasma paracetamol concentration, Φ, as a function of administered dose. Unlike a first order kinetic model where Φ would remain constant at each time point, non‐linearities in the metabolism and absorption mechanisms, coupled with non‐equilibrium conditions embodied in the PBPK model led to a consistent increase in Φ as a function of dose, especially during the absorption phase. At relatively long times, absorption is no longer significant and dose‐dependence is seen only at overdose conditions. Importantly, these results indicate that predictions of hepatotoxicity risk based on pharmacokinetic parameters derived under therapeutic dosing conditions can be misleading and may grossly underestimate the relative liver : plasma concentration ratio of paracetamol, especially at early time points.
Dose estimation studies
Optimal sampling time
The first dose estimation study concentrated on quantifying the effect of sampling time and choice of analytes on the accuracy of the paracetamol dose estimation. Figure 7 depicts results from this study and illustrates several significant findings. First, measuring both the parent paracetamol and APAP‐G conjugate concentrations in a sample can significantly reduce the error for dose reconstruction compared with that for paracetamol concentration alone. One of the principal reasons for this is that following high, acute paracetamol doses, the APAP‐S pathway becomes saturated and paracetamol metabolism shifts toward APAP‐G production 26, 49. By including the APAP‐G conjugate in the measurement, the total amount of the paracetamol dose accounted for increases from 7% (paracetamol alone) to 77% (paracetamol and APAP‐G). Second, for the purposes of dose estimation, blood should be sampled at about 4.5 h (paracetamol only) or 5 h (APAP and APAP‐G), which is somewhat later than that specified in the standard overdose assessment protocol. Third, if a second blood sample is taken after the initial sample at 4 h, error is reduced, but this error does not depend on when the second measurement occurs. In addition, as in the single sample case, measuring both paracetamol and APAP‐G substantially decreases the error in the reconstructed dose relative to that when only parent paracetamol is measured. Finally, knowledge of APAP‐S concentration does not help inform dose reconstruction for overdose cases because, as noted earlier, the APAP‐S metabolism pathway becomes saturated at large paracetamol doses, reducing the sensitivity of APAP‐S concentration to administered dose.
Determining the administered dose
The second dose estimation study focused on dose estimation using data from both a well‐controlled clinical environment and an emergency setting. As seen in Figure 8, the dose reconstruction method accurately predicted the administered paracetamol dose for the test and training set data from the clinical studies. However, for the data acquired in the emergency setting, the agreement between model predictions and self‐reported dose range was not as consistent and was much poorer in several cases. This inconsistency is likely attributable to uncertainty in the patients' self‐reported dose and the difficulty in establishing a reliable estimate of the time of paracetamol ingestion. In some instances, such a discrepancy could indicate a case where the patient intentionally reported an inaccurate dose or dosing time.
Implications for paracetamol overdose treatment
As noted earlier, knowledge of the ingested paracetamol dose can have significant implications for managing a patient following an overdose. In this study, we demonstrated that a paracetamol dose can be estimated using this computational framework and a single serum paracetamol measurement. We also found that incorporating knowledge of the APAP‐G concentration in that same blood sample would reduce the error in that prediction.
Current assessment and treatment plans for paracetamol overdose cases generally rely on a generic methodology involving the use of a clinical nomogram. By using the computational framework developed in this study, serum sample data, and the individual patient's anthropometric and physiological information, it would be possible to quickly generate personalized serum and liver pharmacokinetic profiles and a dose estimate that should prove useful in developing an individualized overdose treatment and follow‐up plan.
Finally, the PBPK model from this study is expected to provide a more accurate description of internal concentrations in the liver compared with previous models derived using therapeutic dosing data 50, 51, 52. This information is essential in estimating further predictors of toxicity, such as levels of NAPQI and rates of glutathione depletion in the liver. Thus, if properly integrated, the present model has the potential to enhance the predictive capability of existing pharmacodynamic models used to predict and assess paracetamol toxicity 51, 52, 53, 54.
It is worth noting that although the focus of this work concerns paracetamol overdoses, we expect that the general methodology and framework could be applied to overdoses for a broad range of drugs and toxicants, provided that relevant biomarkers of exposure can be measured and an appropriate PBPK model developed and evaluated.
Competing Interests
All authors have completed the Unified Competing Interest form at www.icmje.org/coi_disclosure.pdf (available on request from the corresponding author) and declare no support from any organization for the submitted work. KH has received research funding from McNeil Consumer Healthcare for unrelated paracetamol research and royalties from Up‐To‐Date for unrelated paracetamol poisoning studies in the previous 3 years. There are no other relationships or activities that could appear to have influenced the submitted work.
Author Contributions
TZ: Conducted the literature search, developed the model and analytical tools, and contributed to the writing of the manuscript. KH: Provided much of the paracetamol overdose data and contributed to the writing of the manuscript. BR: Developed the model and analytical tools and contributed to the writing of the manuscript.
We thank Drs Jedd Wolchok and Paul Chapman for providing data from clinical trials, and Professor Jean Opsomer and consultants at the Colorado State University Statistics Laboratory for valuable discussions regarding the statistical treatment of certain simulation outputs. KH has received research funding from McNeil Consumer Healthcare for paracetamol research and royalties from Up‐To‐Date for paracetamol poisoning studies.
Supporting information
Table S1: Pharmacokinetic data used in the analyses.
Table S2: System of governing equations for the overdose APAP PBPK model.
supportingInfo_Item
Zurlinden, T. J. , Heard, K. , and Reisfeld, B. (2016) A novel approach for estimating ingested dose associated with paracetamol overdose. Br J Clin Pharmacol, 81: 634–645. doi: 10.1111/bcp.12796.
References
- 1. Chan MT, Anderson PJ, Chan JC, Lau GS, Critchley JA. Single‐dose pharmacokinetics of paracetamol and its conjugates in chinese non‐insulin‐dependent diabetic patients with renal impairment. Eur J Clin Pharmacol 1997; 52: 285–8. [DOI] [PubMed] [Google Scholar]
- 2. Critchley JA, Critchley LA, Anderson PJ, Tomlinson B. Differences in the single‐oral‐dose pharmacokinetics and urinary excretion of paracetamol and its conjugates between hong kong chinese and caucasian subjects. J Clin Pharm Ther 2005; 30: 179–84. [DOI] [PubMed] [Google Scholar]
- 3. Critchley JA, Nimmo GR, Gregson CA, Woolhouse NM, Prescott LF. Inter‐subject and ethnic differences in paracetamol metabolism. Br J Clin Pharmacol 1986; 22: 649–57. [DOI] [PMC free article] [PubMed] [Google Scholar]
- 4. Hawkins LC, Edwards JN, Dargan PI. Impact of restricting paracetamol pack sizes on paracetamol poisoning in the United Kingdom: A review of the literature. Drug Saf 2007; 30: 465–79. [DOI] [PubMed] [Google Scholar]
- 5. Chun LJ, Tong MJ, Busuttil RW, Hiatt JR. Acetaminophen hepatotoxicity and acute liver failure. J Clin Gastroenterol 2009; 43: 342–9. [DOI] [PubMed] [Google Scholar]
- 6. Perkins JD. Acetaminophen sets records in the United States: Number 1 analgesic and number 1 cause of acute liver failure. Liver Transpl 2006; 12: 682–3. [DOI] [PubMed] [Google Scholar]
- 7. Hawton K, Harriss L. Deliberate self‐harm in young people: characteristics and subsequent mortality in a 20‐year cohort of patients presenting to hospital. J Clin Psychiatry 2007; 68: 1574–83. [PubMed] [Google Scholar]
- 8. Rumack BH. Acetaminophen hepatotoxicity: the first 35 years. J Toxicol Clin Toxicol 2002; 40: 3–20. [DOI] [PubMed] [Google Scholar]
- 9. Mohamed AB, Zaibi G, Kachouri A. Implementation of RC5 and RC6 block ciphers on digital images. Int. Multi‐Conference Syst. Signals Devices, SSD'11 ‐ Summ. Proc. 2011.
- 10. Hartington K, Hartley J, Clancy M. Measuring plasma paracetamol concentrations in all patients with drug overdoses; development of a clinical decision rule and clinicians willingness to use it. Emerg Med J 2002; 19: 408–11. [DOI] [PMC free article] [PubMed] [Google Scholar]
- 11. Kaysen GA, Pond SM, Roper MH, Menke DJ, Marrama MA. Combined hepatic and renal injury in alcoholics during therapeutic use of acetaminophen. Arch Intern Med 1985; 145: 2019–23. [PubMed] [Google Scholar]
- 12. Heard K, Bui A, Mlynarchek SL, Green JL, Bond GR, Clark RF, Kozer E, Koff RS, Dart RC. Toxicity from repeated doses of acetaminophen in children: assessment of causality and dose in reported cases. Am J Ther 2012; 21: 1. [DOI] [PMC free article] [PubMed] [Google Scholar]
- 13. Leang Y, Taylor DM, Dargan PI, Wood DM, Greene SL. Reported ingested dose of paracetamol as a predictor of risk following paracetamol overdose. Eur J Clin Pharmacol 2014; 70: 1513–8. [DOI] [PubMed] [Google Scholar]
- 14. Peters SA. Physiologically‐Based Pharmacokinetic (PBPK) Modeling and Simulations: Principles, Methods, and Applications in the Pharmaceutical Industry. Hoboken, New Jersey: Wiley, 2012. [DOI] [PMC free article] [PubMed] [Google Scholar]
- 15. Reisfeld B, Mayeno AN, Lyons MA, Yang RSH. In: Computational Toxicology, ed Ekins S. Hoboken, NJ, USA: John Wiley & Sons, Inc., 2007. [Google Scholar]
- 16. Bois FY. GNU MCSim: Bayesian statistical inference for SBML‐coded systems biology models. Bioinformatics 2009; 25: 1453–4. [DOI] [PubMed] [Google Scholar]
- 17. Krauss M, Burghaus R, Lippert J, Niemi M, Neuvonen P, Schuppert A, Willmann S, Kuepfer L, Görlitz L. Using Bayesian‐PBPK modeling for assessment of inter‐individual variability and subgroup stratification. Silico Pharmacol 2013; 1: 6. [DOI] [PMC free article] [PubMed] [Google Scholar]
- 18. Georgopoulos PG, Sasso AF, Isukapalli SS, Lioy PJ, Vallero DA, Okino M, Reiter L. Reconstructing population exposures to environmental chemicals from biomarkers: challenges and opportunities. J Expo Sci Environ Epidemiol 2009; 19: 149–71. [DOI] [PMC free article] [PubMed] [Google Scholar]
- 19. Lyons MA, Yang RSH, Mayeno AN, Reisfeld B. Computational toxicology of chloroform: reverse dosimetry using Bayesian inference, Markov chain Monte Carlo simulation, and human biomonitoring data. Environ Health Perspect 2008; 116: 1040–6. [DOI] [PMC free article] [PubMed] [Google Scholar]
- 20. Reisfeld B, Ivy JH, Lyons MA, Wright JM, Rogers JL, Mayeno AN. DoseSim: a tool for pharmacokinetic/pharmacodynamic analysis and dose reconstruction. Bioinformatics 2013; 29: 400–1. [DOI] [PubMed] [Google Scholar]
- 21. Friberg LE, Isbister GK, Hackett LP, Duffull SB. The population pharmacokinetics of citalopram after deliberate self‐poisoning: a Bayesian approach. J Pharmacokinet Pharmacodyn 2005; 32: 571–605. [DOI] [PubMed] [Google Scholar]
- 22. Zurlinden TJ, Reisfeld B. Physiologically based modeling of the pharmacokinetics of acetaminophen and its major metabolites in humans using a Bayesian population approach. Eur J Drug Metab Pharmacokinet 2015. DOI: 10.1007/s13318-015-0253-x. [DOI] [PubMed] [Google Scholar]
- 23. Halcomb SE, Sivilotti ML, Goklaney A, Mullins ME. Pharmacokinetic effects of diphenhydramine or oxycodone in simulated acetaminophen overdose. Acad Emerg Med 2005; 12: 169–72. [DOI] [PubMed] [Google Scholar]
- 24. Tan C, Graudins A. Comparative pharmacokinetics of Panadol extend and immediate‐release paracetamol in a simulated overdose model. EMA ‐ Emerg Med Australas 2006; 18: 398–403. [DOI] [PubMed] [Google Scholar]
- 25. Wolchok JD, Williams L, Pinto JT, Fleisher M, Krown SE, Hwu W‐J, Livingston PO, Chang C, Chapman PB. Phase I trial of high dose paracetamol and carmustine in patients with metastatic melanoma. Melanoma Res 2003; 13: 189–96. [DOI] [PubMed] [Google Scholar]
- 26. Chiew A, Day P, Salonikas C, Naidoo D, Graudins A, Thomas R. The comparative pharmacokinetics of modified‐release and immediate‐release paracetamol in a simulated overdose model. Emerg Med Australas 2010; 22: 548–55. [DOI] [PubMed] [Google Scholar]
- 27. Heard K, Rumack BH, Green JL, Bucher‐Bartelson B, Heard S, Bronstein AC, Dart RC. A single‐arm clinical trial of a 48‐h intravenous N‐acetylcysteine protocol for treatment of acetaminophen poisoning. Clin Toxicol (Phila) 2014; 52: 512–8. [DOI] [PubMed] [Google Scholar]
- 28. Levitt DG. Quantitation of small intestinal permeability during normal human drug absorption. BMC Pharmacol Toxicol 2013; 14: 34. [DOI] [PMC free article] [PubMed] [Google Scholar]
- 29. Rawlins MD, Henderson DB, Hijab AR. Pharmacokinetics of paracetamol (acetaminophen) after intravenous and oral administration. Eur J Clin Pharmacol 1977; 11: 283–6. [DOI] [PubMed] [Google Scholar]
- 30. Raffa RB, Pergolizzi JV, Taylor R, Decker JF, Patrick JT. Acetaminophen (paracetamol) oral absorption and clinical influences. Pain Pract 2014; 14: 668–77. [DOI] [PubMed] [Google Scholar]
- 31. Özkan Y, Özalp Y, Savaşer A, Özkan SA. Comparative dissolution testing of paracetamol commercial tablet dosage forms. Acta Pol Pharm ‐ Drug Res 2000; 57: 33–41. [PubMed] [Google Scholar]
- 32. Hixson AW, Crowell JH. Dependence of reaction velocity upon surface and agitation. Ind Eng Chem 1931; 23: 923–31. [Google Scholar]
- 33. Cupera J. Mathematical models of dissolution. Brno, Czech Republic: Masarykova Univerzita, 2009. [Google Scholar]
- 34. Kelly K, O'Mahony B, Lindsay B, Jones T, Grattan TJ, Rostami‐Hodjegan A, Stevens HNE, Wilson CG. Comparison of the rates of disintegration, gastric emptying, and drug absorption following administration of a new and a conventional paracetamol formulation, Using γ scintigraphy. Pharm Res 2003; 20: 1668–73. [DOI] [PubMed] [Google Scholar]
- 35. Chiu WA, Okino MS, Evans MV. Characterizing uncertainty and population variability in the toxicokinetics of trichloroethylene and metabolites in mice, rats, and humans using an updated database, physiologically based pharmacokinetic (PBPK) model, and Bayesian approach. Toxicol Appl Pharmacol. Elsevier B.V. 2009; 241: 36–60. [DOI] [PubMed] [Google Scholar]
- 36. Tsamandouras N, Rostami‐Hodjegan A, Aarons L. Combining the ‘bottom‐up’ and ‘top‐down’ approaches in pharmacokinetic modelling: fitting PBPK models to observed clinical data. Br J Clin Pharmacol 2015; 79: 48–55. [DOI] [PMC free article] [PubMed] [Google Scholar]
- 37. Gelman A, Shirley K. Inference from Simulations and Monitoring Convergence In: Handb. Markov Chain Monte Carlo, eds Brooks S, Gelman A, Jones GL, Meng X‐L. New York, NY: Chapman and Hall, 2011; 163–74. [Google Scholar]
- 38. Perera V, Bies RR, Mo G, Dolton MJ, Carr VJ, McLachlan AJ, Day RO, Polasek TM, Forrest A. Optimal sampling of antipsychotic medicines: a pharmacometric approach for clinical practice. Br J Clin Pharmacol 2014; 78: 1–36. [DOI] [PMC free article] [PubMed] [Google Scholar]
- 39. Verner MA, McDougall R, Johanson G. Using population physiologically based pharmacokinetic modeling to determine optimal sampling times and to interpret biological exposure markers: the example of occupational exposure to styrene. Toxicol Lett 2012; 213: 299–304. [DOI] [PubMed] [Google Scholar]
- 40. Chenel M, Bouzom F, Aarons L, Ogungbenro K. Drug‐drug interaction predictions with PBPK models and optimal multiresponse sampling time designs: application to midazolam and a phase 1 compound. Part 1: comparison of uniresponse and multiresponse designs using PopDes. J Pharmacokinet Pharmacodyn 2008; 35: 635–59. [DOI] [PubMed] [Google Scholar]
- 41. Python Software Foundation . Python Language Reference, version 2.7. Available at http://www.python.org (last accessed 1 July 2015).
- 42. Van der Walt S, Colbert SC, Varoquaux G. The NumPy array: a structure for efficient numerical computation. Comput Sci Eng 2011; 13: 22–30. [Google Scholar]
- 43. Jones E, Oliphant TE, Peterson P. SciPy: Open source scientific tools for Python. 2001; http://www.scipy.org/ (last accessed 1 July 2015).
- 44. Hunter JD. Matplotlib: a 2D graphics environment. Comput Sci Eng 2007; 9: 90–5. [Google Scholar]
- 45. Lin JH. Dose‐dependent pharmacokinetics: experimental observations and theoretical considerations. Biopharm Drug Dispos 1994; 15: 1–31. [DOI] [PubMed] [Google Scholar]
- 46. Riches Z, Bloomer J, Patel A, Nolan A, Coughtrie M. Assessment of cryopreserved human hepatocytes as a model system to investigate sulfation and glucuronidation and to evaluate inhibitors of drug conjugation. Xenobiotica 2009; 39: 374–81. [DOI] [PubMed] [Google Scholar]
- 47. Kim HJ, Rozman P, Madhu C, Klaassen CD. Homeostasis of sulfate and 3′‐phosphoadenosine 5'‐phosphosulfate in rats after acetaminophen administration. J Pharmacol Exp Ther 1992; 261: 1015–21. [PubMed] [Google Scholar]
- 48. Hjelle JJ, Hazelton GA, Klaassen CD. Acetaminophen decreases adenosine 3′‐phosphate 5'‐phosphosulfate and uridine diphosphoglucuronic acid in rat liver. Drug Metab Dispos 1985; 13: 35–41. [PubMed] [Google Scholar]
- 49. Prescott LF. Kinetics and metabolism of paracetamol and phenacetin. Br J Clin Pharmacol 1980; 10 (Suppl 2:291S – 298S). [DOI] [PMC free article] [PubMed] [Google Scholar]
- 50. Ben‐Shachar R, Chen Y, Luo S, Hartman C, Reed M, Nijhout HF. The biochemistry of acetaminophen hepatotoxicity and rescue: a mathematical model. Theor Biol Med Model 2012; 9: 55. [DOI] [PMC free article] [PubMed] [Google Scholar]
- 51. Péry ARR, Brochot C, Zeman FA, Mombelli E, Desmots S, Pavan M, Fioravanzo E, Zaldívar J‐M. Prediction of dose‐hepatotoxic response in humans based on toxicokinetic/toxicodynamic modeling with or without in vivo data: a case study with acetaminophen. Toxicol Lett 2013; 220: 26–34. [DOI] [PubMed] [Google Scholar]
- 52. Howell BA, Yang Y, Kumar R, Woodhead JL, Harrill AH, Clewell HJ, Andersen ME, Siler SQ, Watkins PB. In vitro to in vivo extrapolation and species response comparisons for drug‐induced liver injury (DILI) using DILIsym™: a mechanistic, mathematical model of DILI. J Pharmacokinet Pharmacodyn 2012; 39: 527–41. [DOI] [PubMed] [Google Scholar]
- 53. Navid A, Ng DM, Stewart BJ, Wong SE, Lightstone FC. Quantitative in silico analysis of transient metabolism of acetaminophen and associated causes of hepatotoxicity in humans. Silico Pharmacol 2013; 1: 14. [Google Scholar]
- 54. Geenen S, Yates JWT, Kenna JG, Bois FY, Wilson ID, Westerhoff HV. Multiscale modelling approach combining a kinetic model of glutathione metabolism with PBPK models of paracetamol and the potential glutathione‐depletion biomarkers ophthalmic acid and 5‐oxoproline in humans and rats. Integr Biol (Camb) 2013; 5: 877–88. [DOI] [PubMed] [Google Scholar]
Associated Data
This section collects any data citations, data availability statements, or supplementary materials included in this article.
Supplementary Materials
Table S1: Pharmacokinetic data used in the analyses.
Table S2: System of governing equations for the overdose APAP PBPK model.
supportingInfo_Item