

Abstract
Regulation of mitochondrial biogenesis and respiration is a complex process that involves several signaling pathways and transcription factors as well as communication between the nuclear and mitochondrial genomes. Here we show that decreased expression of histones or a defect in nucleosome assembly in the yeast Saccharomyces cerevisiae results in increased mitochondrial DNA (mtDNA) copy numbers, oxygen consumption, ATP synthesis, and expression of genes encoding enzymes of the tricarboxylic acid (TCA) cycle and oxidative phosphorylation (OXPHOS). The metabolic shift from fermentation to respiration induced by altered chromatin structure is associated with the induction of the retrograde (RTG) pathway and requires the activity of the Hap2/3/4/5p complex as well as the transport and metabolism of pyruvate in mitochondria. Together, our data indicate that altered chromatin structure relieves glucose repression of mitochondrial respiration by inducing transcription of the TCA cycle and OXPHOS genes carried by both nuclear and mitochondrial DNA.
INTRODUCTION
Mitochondria are essential and multifunctional organelles of eukaryotic cells. They contain enzymes of the tricarboxylic acid (TCA) cycle, β-oxidation, and oxidative phosphorylation (OXPHOS) and are thus responsible for the majority of ATP synthesis. Mitochondria also generate precursors for anabolic processes, including the synthesis of nucleotides, fatty acids, steroids, and amino acids. In addition, mitochondria are key players in metabolic regulation and are central to a number of physiological and pathophysiological processes such as apoptosis, cancer, degenerative diseases, and aging (1, 2). Mitochondrial biogenesis is a complex process that requires the replication of mitochondrial DNA (mtDNA) as well as the synthesis and assembly of mitochondrial proteins and lipids in preexisting mitochondrial structures. The control of this process requires the coordinated transcription of a large number of nuclear and mitochondrial genes (2).
The preferred sources of carbon and energy for the yeast Saccharomyces cerevisiae are fermentable sugars such as glucose (3–5). When yeast cells are grown in liquid cultures in rich media containing glucose under aerobic conditions, the cells metabolize glucose predominantly by glycolysis, producing pyruvate. The majority of this pyruvate is converted to acetaldehyde and subsequently to ethanol in the cytosol; only a small fraction of acetaldehyde is converted to acetate (6–8). This acetate is subsequently converted to acetyl coenzyme A (acetyl-CoA) by nucleocytosolic acetyl-CoA synthetase 2 (Acs2p) (9). Since glucose represses the TCA cycle and respiration in S. cerevisiae, only a small fraction of glycolytically produced pyruvate is translocated into mitochondria and converted to acetyl-CoA by the pyruvate dehydrogenase complex (6, 7).
After glucose is exhausted, yeast cells switch metabolism from fermentation to respiration during the diauxic shift and utilize ethanol as a carbon source (10–13). Yeast mitochondria respond to these changes in nutritional conditions. The abundance and activity of mitochondria increase, and mitochondria enlarge during the diauxic shift (14, 15). Mitochondrial biogenesis and activity are controlled by the protein kinase A (PKA), TOR, Sch9p, Snf1p, and Mec1p/Rad53p signaling pathways (11, 16–19). The transition from fermentation to oxidative metabolism and the upregulation of mitochondrial biogenesis and activity require several transcription factors, including Hap2/3/4/5p, Cat8p, Rtg1/3p, and Hcm1p (19–23). However, despite the central position of mitochondria in cell metabolism and physiology, the signaling mechanisms and coordinated transcriptional regulation by which mitochondrial abundance and activity are aligned with nutritional and environmental conditions are not well understood.
Mitochondrial function is monitored by the retrograde (RTG) signaling pathway. RTG signaling is triggered by mitochondrial dysfunction; however, it is also required for the activation of mitochondrial metabolism when cells are grown in nonfermentable carbon sources (21). The key event in the RTG pathway is the translocation of the Rtg1/3p transcription factor from the cytoplasm to the nucleus, with concomitant activation of the first four genes of the TCA cycle (19). Upregulation of peroxisomal citrate synthase, encoded by the CIT2 gene, is a hallmark of RTG signaling activation (24).
Recent evidence revealed that metabolism and chromatin structure are tightly linked and that histones act as metabolic sensors of acetyl-CoA (25–27). On the other hand, histone acetylation and chromatin structure regulate the expression of metabolic genes (28, 29). In this study, we demonstrate that a decreased expression of histones or altered nucleosome structure of chromatin in budding yeast results in the upregulation of mitochondrial activity, redirection of metabolism from fermentation to respiration, and significantly increased ATP synthesis.
MATERIALS AND METHODS
Yeast strains and media.
All yeast strains used in this study are listed in Table 1. Standard genetic techniques were used to manipulate yeast strains and to introduce mutations from non-W303 strains into the W303 background (42). Cells were grown at 28°C in YEP medium (1% yeast extract, 2% Bacto peptone) containing 5% glucose or under selection in synthetic complete (SC) medium containing 5% glucose and, when appropriate, lacking specific nutrients in order to select for a particular genotype.
TABLE 1.
Yeast strains used in this study
| Strain | Genotype | Source or reference |
|---|---|---|
| W303-1a | MATa ade2-1 his3-11,15 leu2-3,112 trp1-1 ura3-1 ssd1-d2 can1-100 | R. Rothstein |
| W303-1α | MATα ade2-1 his3-11,15 leu2-3,112 trp1-1 ura3-1 ssd1-d2 can1-100 | R. Rothstein |
| W303 | MATa/MATα ade2-1/ade2-1 his3-11,15/his3-11,15 leu2-3,112/leu2-3,112 trp1-1/trp1-1ura3-1/ura3-1 can1-100/can1-100 | R. Rothstein |
| JHY200 | MATa leu2-3,112 trp1-1 can1-100 ura3-1 ade2-1 his3-11,15 hta1-htb1::Nat hta2-htb2::HPH hht1-hhf1::KAN hht2-hhf2::KAN pJH33[URA3 CEN ARS HTA1-HTB1 HHT2-HHF2] | 30 |
| LG329 | MATa ade2-1 his3-11,15 leu2-3,112 trp1-1 ura3-1 ssd1-d2 can1-100 hta1-htb1::Nat hta2-htb2::HPH hht1-hhf1::KAN hht2-hhf2::KAN pQQ18[CEN LEU2 HTA1-HTB1 HHT2-HHF2] | 31 |
| LG341 | MATa ade2-1 his3-11,15 leu2-3,112 trp1-1 ura3-1 ssd1-d2 can1-100 hta1-htb1::Nat hta2-htb2::HPH hht1-hhf1::KAN hht2-hhf2::KAN pQQ18[HTA1-HTB1 HHT2(K9R K14R K18R)-HHF2] | 31 |
| LG345 | MATa ade2-1 his3-11,15 leu2-3,112 trp1-1 ura3-1 ssd1-d2 can1-100 hta1-htb1::Nat hta2-htb2::HPH hht1-hhf1::KAN hht2-hhf2::KAN pQQ18 [HTA1-HTB1 HHT2-HHF2(K5R K8R K12R)] | 31 |
| YJL127C | MATa his3Δ0 leu2Δ0 met15Δ0 ura3Δ0 spt10::KAN | Open Biosystems |
| MZ672 | MATa ade2-1 his3-11,15 leu2-3,112 trp1-1 ura3-1 ssd1-d2 can1-100 spt10::KAN | 31 |
| DY5780 | MATa ade2-1 his3-11,15 leu2-3,112 trp1-1 ura3-1 ssd1-d2 can1-100 swi6::TRP1 | 32 |
| BY108 | MATα TRP1 ura3 leu2 lys2 ade2 swi4::HIS3 | 33 |
| MZ544 | MATa ade2-1 his3-11,15 leu2-3,112 trp1-1 ura3-1 ssd1-d2 can1-100 swi4::HIS3 | This study |
| DY2348 | MATa ade2-1 his3-11,15 leu2-3,112 trp1-1 ura3-1 ssd1-d2 can1-100 swi2::HIS3 | 32 |
| NWY009 | MATα ade2-1 his3-11,15 leu2-3,112 trp1-1 ura3-1 ssd1-d2 can1-100 asf1::HIS bar1::LEU2 cac2::KAN | 34 |
| MZ576 | MATa ade2-1 his3-11,15 leu2-3,112 trp1-1 ura3-1 ssd1-d2 can1-100 asf1::HIS3 | This study |
| YNL206C | MATa his3Δ0 leu2Δ0 met15Δ0 ura3Δ0 rtt106::KAN | Open Biosystems |
| MZ642 | MATa ade2-1 his3-11,15 leu2-3,112 trp1-1 ura3-1 ssd1-d2 can1-100 rtt106::KAN | This study |
| YLL002W | MATa his3Δ0 leu2Δ0 met15Δ0 ura3Δ0 rtt109::KAN | Open Biosystems |
| MZ655 | MATa ade2-1 his3-11,15 leu2-3,112 trp1-1 ura3-1 ssd1-d2 can1-100 rtt109::KAN | This study |
| YJB8420 | MATa ade2-1 can1-100 his3-11,15 leu2-3,112 trp1-1 ura3-1 cac1::LEU2 | 35 |
| JWC113 | MATa ade2-1 his3-11,15 leu2-3,112 trp1-1 ura3-1 ssd1-d2 can1-100 cac1::LEU2 | This study |
| SY577 | MATa ade2-1 his3-11,15 leu2-3,112 trp1-1 ura3-1 ssd1-d2 can1-100 asf1::URA3 hir1::HIS3 | 36 |
| MZ700 | MATa ade2-1 his3-11,15 leu2-3,112 trp1-1 ura3-1 ssd1-d2 can1-100 hir1::HIS3 | This study |
| BY551 | MATa ura3-52 lys2-801a ade2-1070 his3Δ200 leu2-Δ1 SCB-lacZ mbp1::TRP1 | 37 |
| AD016 | MATa ade2-1 his3-11,15 leu2-3,112 trp1-1 ura3-1 ssd1-d2 can1-100 mbp1::TRP1 | This study |
| JFY006 | MATa ade2-1 his3-11,15 leu2-3,112 trp1-1 ura3-1 ssd1-d2 can1-100 hht1-hhf1::LEU2 hht2-hhf2::kanMX3trp1::hht1-K56R HHF1::TRP1 asf1::his5+ | 38 |
| LG635 | MATa ade2-1 his3-11,15 leu2-3,112 trp1-1 ura3-1 ssd1-d2 can1-100 hht1-hhf1::LEU2 hht2-hhf2::kanMX3 trp1::hht1-K56R HHF1::TRP1 | This study |
| YEF473A | MATa trp1-63 leu2-1 ura3-52 his3-200 lys2-801 | 39 |
| DCB200.1 | MATa trp1-63 leu2-1 ura3-52 his3-200 lys2-801 HHT1::TRP1 KAN-GAL1p-HHT2 | 39 |
| DY7250 | MATα ade2-1 his3-11,15 leu2-3,112 trp1-1 ura3-1 ssd1-d2 can1-100 GALp::CDC20::ADE2 SPT15-HA3::URA3 | 40 |
| LG564 | MATa ade2-1 his3-11,15 leu2-3,112 trp1-1 ura3-1 ssd1-d2 can1-100 swi6::TRP1 hir1::HIS3 | This study |
| LG658 | MATa ade2-1 his3-11,15 leu2-3,112 trp1-1 ura3-1 ssd1-d2 can1-100 hht1-hhf1::LEU2 hht2-hhf2::TRP1 hht1-K56R HHF1::TRP1 hir1::HIS3 | This study |
| YKL109W | MATa his3Δ0 leu2Δ0 met15Δ0 ura3Δ0 hap4::KAN | Open Biosystems |
| LG579 | MATa ade2-1 his3-11,15 leu2-3,112 trp1-1 ura3-1 ssd1-d2 can1-100 hap4::KAN | This study |
| LG625 | MATa ade2-1 his3-11,15 leu2-3,112 trp1-1 ura3-1 ssd1-d2 can1-100 spt10::KAN hap4::KAN | This study |
| LG633 | MATa ade2-1 his3-11,15 leu2-3,112 trp1-1 ura3-1 ssd1-d2 can1-100 swi6::TRP1 hap4::KAN | This study |
| LG576 | MATa ade2-1 his3-11,15 leu2-3,112 trp1-1 ura3-1 ssd1-d2 can1-100 asf1::HIS3 hap4::KAN | This study |
| YOL067C | MATa his3Δ0 leu2Δ0 met15Δ0 ura3Δ0 rtg1::KAN | Open Biosystems |
| FY2191 | MATa his3Δ200 leu2Δ1 ura3-52 lys2-128δ spt10Δ201::HIS3 pFW217[URA3 CEN ARS SPT10] | 41 |
| TZ299 | MATa ade2-1 his3-11,15 leu2-3,112 trp1-1 ura3-1 ssd1-d2 can1-100 rtg1::KAN | This study |
| LG693 | MATa ade2-1 his3-11,15 leu2-3,112 trp1-1 ura3-1 ssd1-d2 can1-100 spt10::HIS3 rtg1::KAN | This study |
| TZ441 | MATa ade2-1 his3-11,15 leu2-3,112 trp1-1 ura3-1 ssd1-d2 can1-100 swi6::TRP1 rtg1::KAN | This study |
| TZ371 | MATa ade2-1 his3-11,15 leu2-3,112 trp1-1 ura3-1 ssd1-d2 can1-100 asf1::HIS3 rtg1::KAN | This study |
| YER178W | MATa his3Δ0 leu2Δ0 met15Δ0 ura3Δ0 pda1::KAN | Open Biosystems |
| TZ354 | MATa ade2-1 his3-11,15 leu2-3,112 trp1-1 ura3-1 ssd1-d2 can1-100 pda1::KAN | This study |
| LG699 | MATa ade2-1 his3-11,15 leu2-3,112 trp1-1 ura3-1 ssd1-d2 can1-100 spt10::HIS3 pda1::KAN | This study |
| TZ438 | MATa ade2-1 his3-11,15 leu2-3,112 trp1-1 ura3-1 ssd1-d2 can1-100 swi6::TRP1 pda1::KAN | This study |
| TZ401 | MATa ade2-1 his3-11,15 leu2-3,112 trp1-1 ura3-1 ssd1-d2 can1-100 asf1::HIS3 pda1::KAN | This study |
| YGL080W | MATa his3Δ0 leu2Δ0 met15Δ0 ura3Δ0 mpc1::KAN | Open Biosystems |
| TZ341 | MATa ade2-1 his3-11,15 leu2-3,112 trp1-1 ura3-1 ssd1-d2 can1-100 mpc1::KAN | This study |
| LG696 | MATa ade2-1 his3-11,15 leu2-3,112 trp1-1 ura3-1 ssd1-d2 can1-100 spt10::HIS3 mpc1::KAN | This study |
| TZ435 | MATa ade2-1 his3-11,15 leu2-3,112 trp1-1 ura3-1 ssd1-d2 can1-100 swi6::TRP1 mpc1::KAN | This study |
| TZ412 | MATa ade2-1 his3-11,15 leu2-3,112 trp1-1 ura3-1 ssd1-d2 can1-100 asf1::HIS3 mpc1::KAN | This study |
| YOR065W | MATa his3Δ0 leu2Δ0 met15Δ0 ura3Δ0 cyt1::KAN | Open Biosystems |
| LG533 | MATa ade2-1 his3-11,15 leu2-3,112 trp1-1 ura3-1 ssd1-d2 can1-100 cyt1::KAN | This study |
| LG580 | MATa ade2-1 his3-11,15 leu2-3,112 trp1-1 ura3-1 ssd1-d2 can1-100 spt10::Kan cyt1::KAN | This study |
| LG567 | MATa ade2-1 his3-11,15 leu2-3,112 trp1-1 ura3-1 ssd1-d2 can1-100 swi6::TRP1 cyt1::KAN | This study |
| LG570 | MATa ade2-1 his3-11,15 leu2-3,112 trp1-1 ura3-1 ssd1-d2 can1-100 asf1::HIS3 cyt1::KAN | This study |
mtDNA isolation and quantification.
Cells were grown to an A600 of 0.6 in YEP medium containing either 5% glucose or an alternative carbon source. Cells were harvested by centrifugation and lysed in a buffer containing 2% Triton X-100, 1% SDS, 100 mM NaCl, 10 mM Tris-HCl (pH 8.0), and 1 mM EDTA with prechilled glass beads. The lysate was extracted with phenol and chloroform. RNA was digested with RNase, and total DNA was purified by phenol and chloroform. Relative mtDNA was quantified by real-time PCR using primers for COX1 (5′CAACAAATGCAAAAGATATTGCAG-3′ and 5′-AATATTGTGAACCAGGTGCAGC-3′). The results were normalized with primers for ACT1 (5′-TATGTGTAAAGCCGGTTTTGC-3′ and 5′-GACAATACCGTGTTCAATTGGG-3′).
Oxygen consumption.
Cells were grown to an A600 of 0.6 in YEP medium containing either 5% glucose or an alternative carbon source, and 9 × 10⁶ cells were harvested by centrifugation. Cells were resuspended in a buffer containing 10 mM HEPES and 25 mM K2HPO4 (pH 7.0) and incubated at 30°C in an oxygen consumption chamber (Instech Laboratories, Inc.) connected to a NeoFOX fluorescence-sensing detector using NeoFOX software (Ocean Optics, Inc.). Results were calculated as picomoles of O2 per 106 cells per second and expressed as a percentage of values for wild-type cells.
ATP, glucose, and ethanol assays.
For ATP assays, cells were grown to an A600 of 0.6 in YEP medium containing either 5% glucose or an alternative carbon source, and 9 × 10⁷ cells were harvested by centrifugation and lysed in 5% trichloroacetic acid with prechilled glass beads. The cell lysate was neutralized to pH 7.5 with 10 M KOH and 2 M Tris-HCl (pH 7.5). ATP levels were measured by using an Enliten ATP assay (catalog number FF2000; Promega) according to the manufacturer's instructions and normalized by the number of cells. Glucose and ethanol concentrations were assayed in culture supernatants by using a glucose (HK) assay kit (catalog number GAHK-20; Sigma) and an ethanol assay kit (catalog number MAK076; Sigma), respectively.
Real-time RT-PCR.
Real-time reverse transcription-PCR (RT-PCR) was performed as described previously (43), using primers for ACT1 (5′-TATGTGTAAAGCCGGTTTTGC-3′ and 5′-GACAATACCG TGTTCAATTGGG-3′), CIT1 (5′-CAGCGATATTATCAACAACTAGCA-3′ and 5′-TAGTGGCGAGCATTCAATAGTG-3′), ACO1 (5′-TGTTCGTGGTCTTGCGACA-3′ and 5′-CGTTTCCACATTCTGCTTGTAGT-3′), IDH1 (5′-TGCTTAACAGAACAATTGCTAAGAG-3′ and 5′-AACACCGTCACCAGGTATCAA-3′), IDH2 (5′-GGCTACTGTAAAGCAACCTTCAATC-3′ and 5′-GGAAATTTCAGGTCCGATACCA-3′), KGD1 (5′-AACCTGCCGGTATAGTTCAAGA-3′ and 5′-CCCTCTTCCGACAATTTTGA-3′), LSC1 (5′-ACCGTTTCAAAAGCTTCTCTCA-3′ and 5′-AAAGATCACCTTGGTGTCCTTG-3′), SDH1 (5′-CTCCAAGTTGACTTTGCTCAGAA-3′ and 5′-ACGCGGAACCGTTTACAGA-3′), FUM1 (5′-CAGAACTGAAACCGATGCATT-3′ and 5′-CGCCACCAATCTTGAAGTTT-3′), MDH1 (5′-TAAACGTGCGTTTTCCTCTACAG-3′ and 5′-GAAGCAAAGACAATGGTTGTCC-3′), COR1 (5′-CTAACCAGTTCAAGAGGTCTTTGG-3′ and 5′-TGTGTGAGCGGAAGGATTATG-3′), QCR7 (5′-ACGTCTATTGCGAGAATTGGTG-3′ and 5′-AGCCCTAACTTCTTGTAACCTGC-3′), CYT1 (5′-TCAAAGGACCCTCTCGAAAAGT-3′ and 5′-AGCAACACCCGCTGTAACG-3′), COX1 (5′-CAACAAATGCAAAAGATATTGCAG-3′ and 5′-AATATTGTGAACCAGGTGCAGC-3′), CIT2 (5′-AGAGATTTAGCGAAATCTACCCC-3′ and 5′-CCTCTCATACCACCATATACCTGTT-3′), HAP4 (5′-CCGCAAAGACTTTTCTACACAGG-3′ and 5′-TGTTATGATGGTTGGTATTTGGG-3′), RTG1 (5′-GCAAGCGCAGAGATAAGATCA-3′ and 5′-TTGCTACCAGAATTGCCGTAA-3′), RPO41 (5′-AACATCCCTGTTACAAAGACGG-3′ and 5′-TGTTACAAGGGGGTCTTCAGAT-3′), MTF1 (5′-CTTGACCTCTACCCTGGTGTTG-3′ and 5′-GACCCTTCGAATTTTGCATTC-3′), COX2 (5′-GTGGTGAAACTGTTGAATTTGAATC-3′ and 5′-CATCAGCAGCTGTTACAACGAA-3′), and COX3 (5′-AGACATCAACAACATCCATTTCAT-3′ and 5′-CCATGCATTGTTAATGCTAGTGA-3′).
Western blotting.
Cells were grown in YEP medium containing 5% glucose to an A600 of 0.6. Four A600 units (one A600 unit is equal to ∼3 × 10⁷ cells) were harvested and boiled immediately in SDS sample buffer. Denatured proteins were separated on a 15% denaturing polyacrylamide gel. Western blotting with anti-histone H3 polyclonal antibody (catalog number ab1791; Abcam) at a dilution of 1:1,000, anti-histone H4 polyclonal antibody (catalog number 2542; Cell Signaling) at a dilution of 1:750, anti-histone H2A polyclonal antibody (catalog number 07-146; Millipore) at a dilution of 1:750, and anti-histone H2B polyclonal antibody (catalog number 07-371; Millipore) at a dilution of 1:750 was carried out as described previously (43, 44). To confirm equivalent amounts of loaded proteins, the membranes were also probed with actin polyclonal antibody (catalog number A5060; Sigma) at a dilution of 1:500.
Statistical analysis.
The results represent data from at least three independent experiments. Numerical results are presented as means ± standard deviations (SD). Data were analyzed by using an InStat software package (GraphPad, San Diego, CA). Statistical significance was evaluated by one-way analysis of variance (ANOVA), and a P value of <0.05 was considered significant.
RESULTS
Decreased histone expression or defect in chromatin assembly increases mitochondrial respiration.
The diauxic shift is associated with extensive transcriptional reprogramming that includes the upregulation of genes involved in the TCA cycle and the OXPHOS pathway. Previously, we reported that a subset of the genes that are induced during the diauxic shift is also upregulated when chromatin histones are globally hypoacetylated (11, 31). One of the mechanisms that globally regulates the acetylation of chromatin histones is the nucleocytosolic concentration of acetyl-CoA available to histone acetyltransferases (9, 28, 45). To test whether histone acetylation is involved in the regulation of mitochondrial activity, we determined relative mitochondrial DNA (mtDNA) copy numbers and oxygen consumption in strains that express nonacetylatable versions of histones H3 and H4 (Fig. 1A). We used strains expressing histone H3 or H4 with mutations that change acetylatable lysine into nonacetylatable arginine residues within the N-terminal tails (H3-K9R/K14/R/K18R and H4-K5R/K8R/K12R); we refer to these histone mutants as H3-3KR and H4-3KR, respectively. The mtDNA copy number and oxygen consumption were slightly, but reproducibly, upregulated in these mutants, suggesting that global histone hypoacetylation increases the expression of mitochondrial genes and promotes mitochondrial respiration (Fig. 1A).
FIG 1.

Decreased histone expression or a defect in nucleosome assembly induces mitochondrial respiration. Unless indicated otherwise, cells were grown in YEP medium containing 5% glucose. (A) Relative mtDNA copy numbers of WT (LG329), H3-3KR (LG341), and H4-3KR (LG345) cells. (B to E) Relative mtDNA copy numbers (B), cellular oxygen consumption (C), cellular ATP levels (D), and levels of histone proteins (E) in the wild-type (WT) (W303-1a), spt10Δ (MZ672), swi6Δ (DY5780), swi4Δ (MZ544), swi2Δ (DY2348), asf1Δ (MZ576), rtt106Δ (MZ642), rtt109Δ (MZ655), cac1Δ (JWC113), hir1Δ (MZ700), mbp1Δ (AD016), and H3K56R (LG635) strains. For panels A to D, the experiments were repeated three times, and the results are shown as means ± SD. Values that are statistically different (P < 0.05) from those of wild-type cells are indicated by an asterisk. For panels A to C, the results are expressed relative to the value for the wild-type strain grown in 5% glucose. For panel E, Western blot analysis was performed three times, and representative results are shown.
We previously showed that one of the mechanisms by which global histone hypoacetylation in H3-3KR and H4-3KR affects gene expression is by altering nucleosome positioning and thus making regulatory regions of promoter DNA accessible to transcription factors (31). The set of genes that was upregulated in the H3-3KR and H4-3KR mutants was more significantly upregulated in spt10Δ cells (31). Spt10p is a transcription factor specific for histone genes, and spt10Δ cells display reduced expression of histones and globally altered chromatin structure (46, 47). To determine whether reduced expression of histone genes results in increased mitochondrial respiration, we measured mtDNA copy numbers, oxygen consumption, and cellular ATP levels in spt10Δ, swi6Δ, swi4Δ, mbp1Δ, and swi2Δ cells (Fig. 1B to D). Spt10p, Swi6p, Swi4p, Mbp1p, and Swi2p are transcription factors and regulators involved in the expression of histone genes (48, 49). We also included asf1Δ, rtt106Δ, rtt109Δ, cac1Δ, and H3K56R mutants in our analysis, since the corresponding genes and acetylation of lysine 56 of histone H3 are involved in chromatin assembly (50, 51). The data show that decreased expression levels of histone genes or altered chromatin assembly results in increased mtDNA levels, increased oxygen consumption, and elevated ATP levels (Fig. 1B to D). To ensure fully glucose-repressed conditions, the cells were grown in medium containing 5% glucose. The values for oxygen consumption and cellular ATP levels for most of the mutants grown in 5% glucose are comparable to the values for wild-type cells grown in glycerol.
Next, we compared the total levels of histone proteins in the mutants that display increased mitochondrial respiration. While the total levels of all four core histones were significantly decreased in spt10Δ, swi6Δ, and swi2Δ cells in comparison with wild-type cells, the levels of only some histones were slightly reduced in swi4Δ, asf1Δ, rtt109Δ, mbp1Δ, and H3K56R cells. We found no difference in the histone levels in rtt106Δ and cac1Δ cells and, as expected, increased histone levels in hir1Δ cells (Fig. 1E). Asf1p is a histone chaperone that stimulates the efficient acetylation of H3 on lysine 56 (H3K56) by Rtt109p. Acetylated H3K56 binds to Rtt106p, which interacts with Cac1p, the large subunit of chromatin assembly factor 1 (CAF-1) (50, 52). Since asf1Δ, rtt109Δ, rtt106Δ, and cac1Δ mutations result in defects in nucleosome assembly (50–52), it seems likely that the primary mechanism through which they induce mitochondrial respiration involves altered chromatin structure rather than decreased levels of histone proteins. The levels of histones H3 and H4 were slightly reduced in H3K56R cells (Fig. 1E), probably due to the reduced histone gene dosage in H3K56R cells (strain LG635). Thus, the increase in mitochondrial respiration in the H3K56R strain is likely due to the combined effect of the reduced histone gene dosage and the defect in nucleosome assembly.
In addition to the significantly elevated oxygen consumption and ATP synthesis, we also found increased expression levels of genes encoding enzymes of the TCA cycle and OXPHOS pathway in the spt10Δ, swi6Δ, and asf1Δ mutants (Fig. 2A). While the mtDNA copy numbers, oxygen consumption, and cellular ATP levels were comparable in spt10Δ, swi6Δ, and asf1Δ cells, spt10Δ cells displayed a significantly higher level of induction of the TCA cycle and OXPHOS pathway genes than did swi6Δ and asf1Δ cells (Fig. 2A). All the upregulated genes have predicted binding sites for the transcription complex Hap2/3/4/5p (22), and most of them are upregulated in a strain overexpressing HAP4 (53). Interestingly, the genes with the greatest changes in expression levels (CIT1, IDH1, IDH2, QCR7, and CIT2) are also regulated by the Rtg1/3p transcription factor (54–57). Moreover, a microarray analysis showed that the Hap2/3/4/5p complex also regulates the expression of RTG1 (55). It is possible that the altered chromatin structure in spt10Δ, swi6Δ, and asf1Δ cells also permits increased recruitment of the Hap2/3/4/5p complex to the RTG1 promoter, resulting in an increased transcription level of RTG1 and synergistic activation of the TCA cycle and OXPHOS pathway genes by the Hap2/3/4/5p and Rtg1/2p complexes. This notion is supported by the increased expression of CIT2 in spt10Δ, swi6Δ, and asf1Δ cells. CIT2 encodes the peroxisomal form of citrate synthase, and its induction is a hallmark of activation of the retrograde pathway (19). These results suggest that increased mitochondrial respiration in spt10Δ, swi6Δ, and asf1Δ cells is associated with the induction of the retrograde (RTG) pathway and are in contrast with the induction of mitochondrial respiration in wild-type cells grown on raffinose or galactose, which is not associated with increased CIT2 expression and the induction of the retrograde pathway (Fig. 2B).
FIG 2.

Derepression of the TCA cycle and OXPHOS genes. (A) Relative mRNA levels in the wild-type (WT) (W303-1a), spt10Δ (MZ672), swi6Δ (DY5780), and asf1Δ (MZ576) strains. (B) Wild-type (W303-1a) cells were grown in YEP medium containing the indicated carbon sources, and the relative mRNA levels were determined. The experiments were repeated three times, and the results are shown as means ± SD. Values that are statistically different (P < 0.05) from those of wild-type cells are indicated by an asterisk. The results are expressed relative to the value for the wild-type strain grown in 5% glucose.
The carbon source regulates oxygen consumption, cellular ATP levels, and expression of the TCA cycle and OXPHOS pathway genes in wild-type cells (Fig. 1C and D and 2B); however, it does not affect the mtDNA copy number in wild-type cells (Fig. 1B). In contrast, reduced expression of histones or a defect in chromatin assembly also elevate the mtDNA copy number (Fig. 1B).
mtDNA copy number and mitochondrial respiration are regulated by expression of histone genes.
To confirm that decreased histone expression elevates mtDNA copy numbers by a different approach, we used a strain in which the sole histone H3 gene is under the control of the GAL1 promoter (GAL-H3) (39). This allows transcription of histone H3 on galactose and its repression on glucose. After glucose was added to the GAL-H3 strain, the mtDNA copy number was significantly elevated (Fig. 3A), providing additional evidence that histone depletion results in increased mtDNA copy numbers. As the viability of GAL-H3 cells remained unchanged after glucose addition (Fig. 1B), the increased mtDNA copy number cannot be attributed to decreased cell viability. To eliminate the possibility that the increase in the mtDNA copy number is a consequence of the inactivation of an essential gene, we used a strain in which the CDC20 gene is under the control of the GAL1 promoter. CDC20 is an essential gene required for the activation of the anaphase-promoting complex/cyclosome and progression through mitosis (58). After the GAL-CDC20 strain was transferred to glucose, the mtDNA copy number did not increase, indicating that the increase of the mtDNA copy number in GAL-H3 cells is due to the depletion of histone H3 and is not a general response to a depletion of an essential protein (Fig. 3A).
FIG 3.

mtDNA copy number and mitochondrial respiration are regulated by expression of the histone genes. (A) Relative mtDNA copy numbers of the wild-type strain (WT) (W303-1a) (shown for comparison with previously reported results) and strains with the sole histone H3 gene (DCB200.1) or the CDC20 gene (DY7250) under the control of the GAL1 promoter. The DCB200.1 and DY7250 strains are shown as GAL-H3 and GAL-CDC20, respectively. Cells were grown in YEP medium containing 2% galactose to an A600 of 0.6 at 30°C. Each culture was split in two, glucose was added to half of each culture to a final concentration of 5%, and cells were grown for an additional 16 h. (B) Viability of the GAL-H3 strain is not affected by the addition of glucose. GAL-H3 cells were grown as described above for panel A. Cells were harvested and washed, and 10-fold serial dilutions of the cells were spotted onto YEP plates containing 2% galactose. The plates were incubated for 2 days at 30°C, and typical results from three independent experiments are shown. (C to F) Relative mtDNA copy numbers (C), cellular oxygen consumption (D), cellular ATP levels (E), and relative mRNA levels (F) of wild-type (W303-1a) and spt10Δ (MZ672) cells containing either the control plasmid or a high-copy-number plasmid expressing all four core histone genes (plasmid pFB1156) (38). The cells were pregrown under selection in SC medium, inoculated to an A600 of 0.1 into YEP medium containing 5% glucose, and grown for two generations at 30°C. (G and H) Relative mtDNA copy numbers (G) and cellular ATP levels (H) of the wild-type (W303-1a), hir1Δ (MZ700), swi6Δ (DY5780), swi6Δ hir1Δ (LG564), asf1Δ (MZ576), asf1Δ hir1Δ (SY577), H3K56R (LG635), and H3K56R hir1Δ (LG658) strains. For panels A and C to H, the experiments were repeated three times, and the results are shown as means ± SD. Values that are statistically different (P < 0.05) from each other are indicated by a bracket and an asterisk. For panels A, C, D, F, and G, the results are expressed relative to the value for the wild-type strain.
In addition, we tested whether the ectopic expression of extra histones could decrease the respiratory phenotype of spt10Δ cells. A high-copy-number plasmid encoding all four core histones significantly reduced the mtDNA copy numbers, oxygen consumption, ATP levels, and mRNA levels of several genes encoding enzymes of the TCA cycle and OXPHOS pathway in spt10Δ cells, restoring all values to near-wild-type levels (Fig. 3C to F). Accordingly, deletion of HIR1, encoding a subunit of the HIR complex that represses histone gene transcription (59, 60), in the swi6Δ, asf1Δ, and H3K56R mutants decreased the mtDNA copy numbers and ATP levels of the corresponding strains (Fig. 3G and H). The effect of the hir1Δ mutation on spt10Δ cells could not be tested, as hir1Δ and spt10Δ mutations are synthetically lethal. Deletion of HIR1 increases the expression of histone genes (61), and our results suggest that increasing the histone expression in swi6Δ, asf1Δ, and H3K56R cells by introducing the hir1Δ mutation suppresses both elevated mtDNA copy numbers and mitochondrial respiration, as indicated by lower ATP levels (Fig. 3G and H).
Altered chromatin structure in spt10Δ, swi6Δ, asf1Δ, and H3K56R cells results in a metabolic shift from fermentation to respiration.
An interesting feature of budding yeast metabolism is the conversion of glucose to ethanol and carbon dioxide under aerobic conditions, a phenomenon known as the Crabtree effect (62, 63). To find out how the altered chromatin structure in spt10Δ, swi6Δ, asf1Δ, and H3K56R cells affects metabolism, we measured growth rates, glucose consumption, and ethanol production in the corresponding strains. The doubling times of wild-type, spt10Δ, swi6Δ, asf1Δ, and H3K56R cells were 1.5, 4.6, 4.4, 1.9, and 2.1 h, respectively (Fig. 4A). As expected, wild-type cells rapidly converted glucose into ethanol and biomass during exponential growth (Fig. 4A to C). spt10Δ and swi6Δ cells displayed a severe growth defect, utilized glucose slowly, and produced significantly less ethanol (Fig. 4), while the corresponding phenotypes of asf1Δ and H3K56R cells were less severe (Fig. 4). Cumulatively, the results show that the altered chromatin structure, particularly in spt10Δ and swi6Δ cells, results in the highly efficient operation of mitochondrial respiration (Fig. 1 and 2), slower utilization of glucose (Fig. 4B), and decreased synthesis of ethanol (Fig. 4C and D).
FIG 4.

Altered chromatin structure in spt10Δ, swi6Δ, asf1Δ, and H3K56R cells results in a switch from fermentation to respiration. (A to C) Growth curve (A600) (A) and glucose (B) and ethanol (C) concentrations during growth of the wild-type (WT) (W303-1a), spt10Δ (MZ672), swi6Δ (DY5780), asf1Δ (MZ576), and H3K56R (LG635) strains. (D) Highest concentrations of ethanol in culture medium reached during growth. For panels A to C, the experiments were performed three times, and representative results are shown. For panel D, the experiments were repeated three times, and the results are shown as means ± SD. Values that are statistically different (P < 0.05) from those of wild-type cells are indicated by an asterisk.
Chromatin defect-induced mitochondrial respiration requires HAP4 and RTG1.
Expression of the TCA cycle and OXPHOS genes is regulated by glucose levels independently of PKA and SNF1 by the Hap2/3/4/5p transcription complex, suggesting that the Hap2/3/4/5p complex provides an additional mechanism of transcriptional regulation of mitochondrial respiration (5). The Hap2/3/4/5p complex binds to DNA through the Hap2, -3, and -5 subunits, which are constitutively expressed. The activation domain of the complex is contained within the Hap4p subunit (64). HAP4 expression increases upon glucose depletion (65), and overexpression of HAP4 induces respiration, even in a glucose-repressed state (53, 66). Since the induction of Hap2/3/4/5p complex-responsive genes is independent of SNF1 activity, we decided to test the possibility that decreased expression of histone genes induces HAP4 expression. We found that HAP4 expression levels are elevated 3.9- and 2.1-fold in spt10Δ and swi6Δ cells, respectively, in comparison to those in wild-type cells (Fig. 5A). As expected, deletion of HAP4 significantly reduced mtDNA copy numbers, oxygen consumption, and ATP levels in spt10Δ, swi6Δ, and asf1Δ cells (Fig. 5B to D). Interestingly, we found that the reduced respiration due to the hap4Δ mutation in spt10Δ, swi6Δ, and asf1Δ cells improved their slow growth (Fig. 5E). It is possible that the shunting of carbon metabolism from oxidative phosphorylation to glycolysis in hap4Δ mutants allows cells to use more pyruvate and other metabolic intermediates for biosynthetic purposes.
FIG 5.

Chromatin defect-induced mitochondrial respiration requires HAP4 and RTG1. (A) HAP4 and RTG1 relative mRNA levels in the wild-type (WT) (W303-1a), spt10Δ (MZ672), swi6Δ (DY5780), and asf1Δ (MZ576) strains. The experiment was repeated three times, and the results are shown as means ± SD. Values that are statistically different (P < 0.05) from those of wild-type cells are indicated by an asterisk. (B to E) Relative mtDNA copy numbers (B), cellular oxygen consumption (C), cellular ATP levels (D), and growth (E) of the wild-type (W303-1a), spt10Δ (MZ672), swi6Δ (DY5780), asf1Δ (MZ576), hap4Δ (LG579), spt10Δ hap4Δ (LG625), swi6Δ hap4Δ (LG633), asf1Δ hap4Δ (LG576), rtg1Δ (TZ299), spt10Δ rtg1Δ (LG693), swi6Δ rtg1Δ (TZ441), and asf1Δ rtg1Δ (TZ371) strains. For panels B to D, the experiments were repeated three times, and the results are shown as means ± SD. Values that are statistically different (P < 0.05) for the double mutants in comparison to the corresponding single mutants (spt10Δ, swi6Δ, and asf1Δ) are indicated by an asterisk. (E) Tenfold serial dilutions of cells were spotted onto yeast extract-peptone-dextrose plates and grown for 2 days at 30°C. Typical results from three independent experiments are shown.
Respiration is also regulated by RTG signaling. We found that CIT2 expression, the hallmark of activation of the RTG pathway, is increased in spt10Δ, swi6Δ, and asf1Δ cells (Fig. 2A), despite RTG1 expression being increased only in spt10Δ cells (Fig. 5A). Therefore, the activation of RTG signaling in spt10Δ, swi6Δ, and asf1Δ cells is likely due to both increased RTG1 expression (in spt10Δ cells) and increased translocation and/or DNA binding of the Rtg1/3p complex (in spt10Δ, swi6Δ, and asf1Δ cells). Similarly to HAP4, deletion of RTG1 significantly reduced mtDNA copy numbers, oxygen consumption, and ATP levels in spt10Δ, swi6Δ, and asf1Δ cells (Fig. 5B to D). Unlike hap4Δ cells, rtg1Δ cells grew more slowly than wild-type cells, and the rtg1Δ mutation did not suppress the slow growth of spt10Δ, swi6Δ, and asf1Δ cells (Fig. 5E). It is likely that the sets of transcriptional targets of the Hap2/3/4/5p and Rtg1/3p complexes are not identical and that the inactivation of the two complexes affects transcription and cellular physiology differently.
Chromatin defect-induced mitochondrial activity requires transport and metabolism of pyruvate.
To determine whether pyruvate transport or metabolism affects mitochondrial activity in spt10Δ, swi6Δ, and asf1Δ cells, we impaired the transport and metabolism of pyruvate in mitochondria by deleting the MPC1 and PDA1 genes. The pyruvate transporter Mpc1p is localized in the inner mitochondrial membrane, and mitochondria isolated from mpc1Δ cells have decreased pyruvate uptake (67, 68). Pda1p is a subunit of the pyruvate dehydrogenase complex that catalyzes the conversion of pyruvate to acetyl-CoA in mitochondria. As expected, introduction of the mpc1Δ or pda1Δ mutation into spt10Δ, swi6Δ, and asf1Δ cells reduced oxygen consumption and ATP synthesis to levels comparable to or lower than those of wild-type cells (Fig. 6A and B). mtDNA copy numbers were also significantly reduced in spt10Δ, swi6Δ, and asf1Δ cells in combination with the mpc1Δ or pda1Δ mutation (Fig. 6C). In a parallel experiment, we found that the increased oxygen consumption and ATP levels in spt10Δ, swi6Δ, and asf1Δ cells were reduced to levels lower than those in wild-type cells by a defect in the electron transport chain due to deletion of the cytochrome c1 subunit CYT1 (Fig. 6A and B). Interestingly, while the mpc1Δ, pda1Δ, or cyt1Δ mutation reduced oxygen consumption and ATP synthesis to levels comparable to or lower than those of wild-type cells, the mtDNA copy numbers in the double mutants remained higher than those in wild-type cells.
FIG 6.
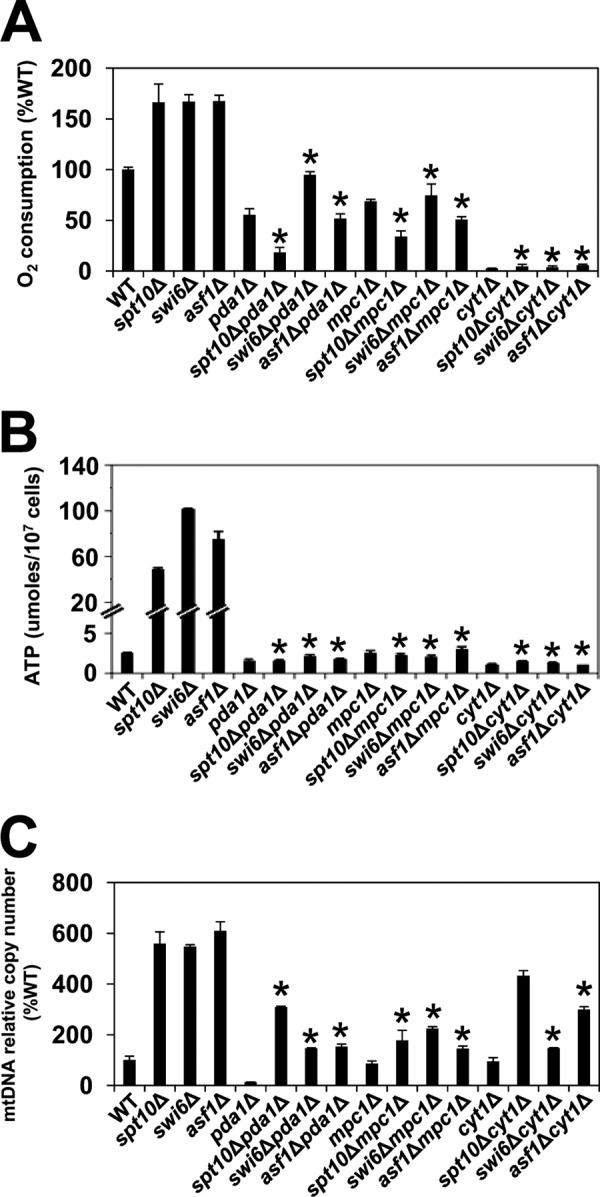
Chromatin defect-induced mitochondrial respiration requires transport and metabolism of pyruvate. (A to C) Cellular oxygen consumption (A), cellular ATP levels (B), and relative mtDNA copy numbers (C) of the wild-type (WT) (W303-1a), spt10Δ (MZ672), swi6Δ (DY5780), asf1Δ (MZ576), pda1Δ (TZ354), spt10Δ pda1Δ (LG699), swi6Δ pda1Δ (TZ438), asf1Δ pda1Δ (TZ401), mpc1Δ (TZ341), spt10Δ mpc1Δ (LG696), swi6Δ mpc1Δ (TZ435), asf1Δ mpc1Δ (TZ412), cyt1Δ (LG533), spt10Δ cyt1Δ (LG580), swi6Δ cyt1Δ (LG567), and asf1Δ asf1Δ (LG570) strains. The experiments were repeated three times, and the results are shown as means ± SD. Values that are statistically different (P < 0.05) for the double mutants in comparison to the corresponding single mutants (spt10Δ, swi6Δ, and asf1Δ mutants) are indicated by an asterisk.
Mitochondrial metabolism is required for expression of genes carried by both nuclear and mitochondrial DNA.
Coordination between the mitochondria and nucleus is required for the balanced production of proteins necessary for mitochondrial respiration. Disruptions in mitochondrial metabolism are known to regulate the nuclear genome through the activation of RTG signaling (19, 69). However, the mechanism by which the chromatin structure in the nucleus affects the expression of genes carried by mitochondrial DNA is less obvious. A major mechanism that regulates the activity of the mitochondrial RNA polymerase Rpo41p/Mtf1p in vitro is the concentration of ATP (70, 71). To test whether this mechanism regulates the transcription of COX1, COX2, and COX3, three genes carried by mitochondrial DNA, we measured the corresponding transcript levels in spt10Δ cells. As expected, the transcription of all three genes was significantly elevated in spt10Δ cells (Fig. 7A). Inactivation of PDA1, MPC1, HAP4, and RTG1 in spt10Δ cells results in reduced cellular ATP levels (Fig. 5D and 6B) and reduced transcription of COX1, COX2, and COX3 (Fig. 7A). However, despite the decreased transcription of COX1 in spt10Δ cyt1Δ cells, the transcription of COX2 and COX3 was increased in spt10Δ cyt1Δ cells in comparison to spt10Δ cells (Fig. 7A). Since the cyt1Δ mutation eliminates ATP synthesis in mitochondria and significantly reduces the cellular ATP level, these results suggest that the mitochondrial ATP level is not the major or the only mechanism regulating the transcription of COX1, COX2, and COX3 in spt10Δ cells. To explore other possible mechanisms that regulate the transcription of genes carried by mitochondrial DNA, we determined the expression levels of RPO41, MTF1, HAP4, and RTG1 in spt10Δ cells (Fig. 7B). RPO41 and MTF1 encode the mitochondrial RNA polymerase and its transcriptional factor, respectively (70). Expression of both RPO41 and MTF1 was significantly increased in spt10Δ cells, and the increased expression depended on HAP4, RTG1, PDA1, and MPC1 (Fig. 7B). Similarly to the expression of COX1, COX2, and COX3, the expression of RPO41, MTF1, and HAP4 was less affected by the cyt1Δ mutation (Fig. 7B). These results suggest that the increased expression levels of COX1, COX2, and COX3 in mitochondria are driven by higher levels of transcription of RPO41 and MTF1 in the nucleus, which depend on HAP4, RTG1, PDA1, and MPC1 (Fig. 7B). Expression of RPO41 and MTF1 is not known to be regulated by either the Hap2/3/4/5p or the Rtg1/3p complex. However, analysis of the database of predicted binding sites of yeast transcription factors (54) shows likely binding sites for the Hap2/3/4/5p complex in the promoter regions of both RPO41 and MTF1. Accordingly, the mechanism of increased RPO41 and MTF1 transcription in spt10Δ cells likely involves increased HAP4 transcription (Fig. 5A and 7B). The possibility that RPO41 and MTF1 are regulated by the Hap2/3/4/5p complex is supported by the decreased expression of RPO41 and MTF1 in spt10Δ hap4Δ cells (Fig. 7B).
FIG 7.

Mitochondrial metabolism is required for expression of genes carried by both nuclear and mitochondrial DNA. Shown are relative mRNA levels of the wild-type (WT) (W303-1a), spt10Δ (MZ672), pda1Δ (TZ354), spt10Δ pda1Δ (LG699), mpc1Δ (TZ341), spt10Δ mpc1Δ (LG696), cyt1Δ (LG533), spt10Δ cyt1Δ (LG580), hap4Δ (LG579), spt10Δ hap4Δ (LG625), rtg1Δ (TZ299), and spt10Δ rtg1Δ (LG693) strains. The experiments were repeated three times, and the results are shown as means ± SD. Values that are statistically different (P < 0.05) for the double mutants in comparison to the corresponding single mutants (spt10Δ, swi6Δ, and asf1Δ) are indicated by an asterisk.
The increased expression of HAP4 and RTG1 in spt10Δ cells is mutually interdependent: increased expression of HAP4 requires RTG1, and, conversely, increased expression of RTG1 requires HAP4. The requirement for HAP4 for the expression of RTG1 is supported by a microarray analysis that showed regulation of RTG1 by the Hap2/3/4/5p complex (55). However, the mechanism through which the Rtg1/3p complex regulates HAP4 transcription is likely indirect, as the HAP4 promoter does not contain an Rtg1/3p binding site. In addition, the increased expression of HAP4 and RTG1 in spt10Δ cells requires the transport and metabolism of pyruvate in mitochondria (Fig. 7B).
On the basis of these results, we propose a model in which chromatin defects in spt10Δ cells lead to increased expression of HAP4 and RTG1, which results in increased expression of nuclear genes encoding TCA cycle and OXPHOS enzymes (Fig. 7C) as well as increased expression of the mitochondrial RNA polymerase RPO41/MTF1 (Fig. 7B). The higher expression levels of RPO41 and MTF1 together with elevated mtDNA copy numbers (Fig. 1B) result in increased transcription of genes carried by mitochondrial DNA, COX1, COX2, and COX3 (Fig. 7A). The higher expression levels of HAP4 and RTG1 in spt10Δ cells require a mitochondrial metabolite derived from pyruvate. It is possible that this metabolite is heme, derived from succinyl-CoA, an intermediate of the TCA cycle (72, 73). Heme is required for the function of Hap1p as a transcriptional activator (72, 74, 75), and heme also stimulates the activity of the Hap2/3/4/5p complex (64, 76, 77). It is thus likely that mitochondrial metabolism regulates the transcription of genes carried by both nuclear and mitochondrial DNA through heme synthesis and the activity of Hap1p and Hap2/3/4/5p factors (Fig. 8).
FIG 8.

Model for the role of chromatin structure in the regulation of mitochondrial respiration.
DISCUSSION
Despite the central position of mitochondria in cell metabolism and physiology, the signaling mechanisms and the coordinated transcriptional regulation by which mitochondrial abundance and activity are aligned with nutritional and environmental conditions are not well understood. Mitochondrial biogenesis and activity are controlled by the PKA, TOR, Sch9p, Snf1p, and Mec1p/Rad53p signaling pathways (11, 16–19) and require several transcription factors, including Hap1p, Hap2/3/4/5p, Rtg1/3p, and Hcm1p (19–22, 76). Our results show that mitochondrial biogenesis and activity are also regulated by chromatin-mediated pathways.
From the perspective of nucleosomal chromatin architecture, yeast genes can be classified into two broad groups: growth genes and stress genes (78). Growth genes are typically expressed at high levels and feature a region depleted of nucleosomes upstream of the coding region, referred to as the nucleosome-free region. The nucleosome-free region exposes DNA, and transcription factors can bind there in an unobstructed way. The stress genes are generally expressed at lower levels, and their promoters are dominated by delocalized “fuzzy” nucleosomes rather than by the nucleosome-free region. Consequently, stress genes are regulated by factors that affect the structure of chromatin, including histone levels and acetylation. The respiratory genes in Saccharomyces cerevisiae belong to the stress category, unlike respiratory genes in yeast species with oxidative metabolism, such as Candida albicans, or in higher eukaryotes (79, 80). Our results demonstrate that the expression of genes required for mitochondrial respiration is upregulated by the decreased expression of histone genes (spt10Δ, swi6Δ, swi4Δ, or mbp1Δ) or by a defect in chromatin assembly (asf1Δ, rtt109Δ, or H3K56R). Our results are also in agreement with data from a recent study that showed that histone and nucleosome losses that occur during yeast replicative aging result in transcriptional induction of all yeast genes and particularly stress genes that contain the TATA box (81).
Decreased expression of histone genes or a defect in chromatin assembly results in increased mitochondrial respiration that differs from mitochondrial respiration in wild-type cells grown on raffinose or galactose in two important aspects. The increased mitochondrial activity in spt10Δ, swi6Δ, or asf1Δ cells is associated with the induction of the RTG pathway, as indicated by the increased expression of the RTG pathway target gene CIT2. This induction is more prominent in spt10Δ cells than in swi6Δ or asf1Δ cells. Wild-type cells grown on raffinose or galactose do not display a significant induction of the retrograde pathway (Fig. 2B). In addition, the cellular ATP levels in spt10Δ, swi6Δ, or asf1Δ cells are elevated 20- to 50-fold in comparison to those in wild-type cells grown on glucose and are higher than the ATP levels in wild-type cells grown on raffinose or galactose (Fig. 1D). A comparison of oxygen consumption and cellular ATP levels in spt10Δ, swi6Δ, or asf1Δ cells grown on glucose with those in wild-type cells grown on glycerol indicates that the altered chromatin structure in spt10Δ, swi6Δ, or asf1Δ cells changes transcriptional regulation in a way that results in the induction of mitochondrial respiration. In addition, unlike wild-type cells grown on galactose, raffinose, or glycerol, spt10Δ, swi6Δ, or asf1Δ cells display significantly increased mtDNA copy numbers (Fig. 1B).
The explanation for the increased transcription of nuclear genes required for mitochondrial respiration in cells with altered chromatin structure is fairly straightforward: decreased occupancy or delocalization of nucleosomes in the corresponding promoters likely allows for increased recruitment of Hap2/3/4/5p, Rtg1/3p, and perhaps other transcription factors to the corresponding promoters and increased transcription of genes required for mitochondrial respiration. However, how does a defect in the chromatin structure of nuclear genes affect the expression of genes carried by mitochondrial DNA? In vitro, the transcription of genes carried by mitochondrial DNA is regulated by the ATP concentration, and different genes carried by mitochondrial DNA differ in their responsiveness to the ATP level (70, 71). However, our results indicate that the increased expression of genes carried by mitochondrial DNA (COX1, COX2, and COX3) in spt10Δ cells requires the nuclear factors Hap4p and Rtg1p and is driven by the increased expression of the RPO41 and MTF1 genes, encoding mitochondrial RNA polymerase and its associated factor, respectively.
The Hap2/3/4/5p and Rtg1/3p complexes appear to be the key transcription factors involved in increased mitochondrial respiration in spt10Δ, swi6Δ, and asf1Δ cells. While the transcription of HAP4 is significantly increased in spt10Δ and swi6Δ cells, the transcription of RTG1 is increased only in spt10Δ cells. Despite increased mitochondrial respiration in asf1Δ cells, the expression of neither HAP4 nor RTG1 was elevated (Fig. 5A). This supports the notion that increased transcription of HAP4 and RTG1 is not a requirement for the induction of mitochondrial respiration in cells with altered chromatin structure. On the other hand, increased transcription of HAP4 and RTG1 in spt10Δ cells probably contributes to the robust induction of expression of genes encoding TCA cycle and OXPHOS enzymes (Fig. 2A). The main mechanism responsible for the induction of mitochondrial respiration in cells with altered chromatin structure is likely the increased recruitment of Hap2/3/4/5p, Rtg1/3p, and perhaps other transcription factors to the corresponding promoters, permitted by the increased delocalization of promoter nucleosomes.
Increased expression of both nuclear and mitochondrial DNA-carried genes required for mitochondrial respiration in spt10Δ cells requires HAP4, RTG1, and the transport and metabolism of pyruvate in mitochondria (Fig. 7). Interestingly, the increased expression of HAP4 and RTG1 themselves requires a product of mitochondrial carbon metabolism. It is possible that this carbon metabolite is heme. Heme biosynthesis is initiated in mitochondria and requires succinyl-CoA, an intermediate of the TCA cycle (73, 82). Heme is a cofactor of the transcriptional activator Hap1p and stimulates the activity of the Hap2/3/4/5p complex (76, 77). Both Hap1p and Hap2/3/4/5p are important for the expression of genes required for mitochondrial respiration. It is likely that a defect in the transport and metabolism of pyruvate in mitochondria results in the diminished synthesis of succinyl-CoA, 5-aminolevulinic acid (ALA), and, ultimately, heme, affecting the activity of Hap1p and Hap2/3/4/5p. Since the expression of HAP4 is decreased in pda1Δ and mpc1Δ cells and the HAP4 promoter features a binding site for the Hap2/3/4/5p complex (56), it is possible that heme activates the Hap2/3/4/5p complex, which results in increased transcription of HAP4 and other target genes of the Hap2/3/4/5p complex (Fig. 8). This mechanism could also explain the activation of the Hap2/3/4/5p complex during the diauxic shift. As glucose is depleted and mitochondria begin to utilize ethanol, levels of synthesis of succinyl-CoA, ALA, and heme probably increase, leading to the activation of the Hap2/3/4/5p complex and increased transcription of HAP4 and genes encoding enzymes of the TCA cycle and OXPHOS. Since many of the Hap2/3/4/5p complex-regulated genes are repressed by glucose independently of the protein kinase A and Snf1 pathways, this mechanism would explain the activation of the Hap2/3/4/5p complex and the increased transcription of the Hap2/3/4/5p complex-regulated TCA cycle and OXPHOS genes upon glucose depletion.
ACKNOWLEDGMENTS
We thank B. Andrews, J. G. Berman, K. Bloom, D. J. Clark, L. F. Pemberton, J. Rine, R. Sternglanz, D. J. Stillman, J. K. Tyler, and F. Winston for strains and plasmids and members of the Vancura laboratory and I. Vancurova for helpful comments.
REFERENCES
- 1.McBride HM, Neuspiel M, Wasiak S. 2006. Mitochondria: more than just a powerhouse. Curr Biol 16:R551–R560. doi: 10.1016/j.cub.2006.06.054. [DOI] [PubMed] [Google Scholar]
- 2.Hock MB, Kralli A. 2009. Transcriptional control of mitochondrial biogenesis and function. Annu Rev Physiol 71:177–203. doi: 10.1146/annurev.physiol.010908.163119. [DOI] [PubMed] [Google Scholar]
- 3.Gancedo JM. 1998. Yeast carbon catabolite repression. Microbiol Mol Biol Rev 62:334–361. [DOI] [PMC free article] [PubMed] [Google Scholar]
- 4.Santangelo GM. 2006. Glucose signaling in Saccharomyces cerevisiae. Microbiol Mol Biol Rev 70:253–282. doi: 10.1128/MMBR.70.1.253-282.2006. [DOI] [PMC free article] [PubMed] [Google Scholar]
- 5.Zaman S, Lippman SI, Schneper L, Slonim N, Broach JR. 2009. Glucose regulates transcription in yeast through a network of signaling pathways. Mol Syst Biol 5:245. doi: 10.1038/msb.2009.2. [DOI] [PMC free article] [PubMed] [Google Scholar]
- 6.Gombert AK, Moreira dos Santos M, Christensen B, Nielsen J. 2001. Network identification and flux quantification in the central metabolism of Saccharomyces cerevisiae under different conditions of glucose repression. J Bacteriol 183:1441–1451. doi: 10.1128/JB.183.4.1441-1451.2001. [DOI] [PMC free article] [PubMed] [Google Scholar]
- 7.Heyland J, Fu J, Blank LM. 2009. Correlation between TCA cycle flux and glucose uptake rate during respiro-fermentative growth of Saccharomyces cerevisiae. Microbiology 155:3827–3837. doi: 10.1099/mic.0.030213-0. [DOI] [PubMed] [Google Scholar]
- 8.Galdieri L, Zhang T, Rogerson D, Lleshi R, Vancura A. 2014. Protein acetylation and acetyl-CoA metabolism in budding yeast. Eukaryot Cell 13:1472–1483. doi: 10.1128/EC.00189-14. [DOI] [PMC free article] [PubMed] [Google Scholar]
- 9.Takahashi H, MacCaffery JM, Irizarry RA, Boeke JD. 2006. Nucleocytosolic acetyl-coenzyme A synthetase is required for histone acetylation and global transcription. Mol Cell 23:207–217. doi: 10.1016/j.molcel.2006.05.040. [DOI] [PubMed] [Google Scholar]
- 10.Zaman S, Lippman SI, Zhao X, Broach JR. 2008. How Saccharomyces responds to nutrients. Annu Rev Genet 42:27–81. doi: 10.1146/annurev.genet.41.110306.130206. [DOI] [PubMed] [Google Scholar]
- 11.Galdieri L, Mehrotra S, Yu S, Vancura A. 2010. Transcriptional regulation in yeast during diauxic shift and stationary phase. OMICS 14:629–638. doi: 10.1089/omi.2010.0069. [DOI] [PMC free article] [PubMed] [Google Scholar]
- 12.Broach JR. 2012. Nutritional control of growth and development in yeast. Genetics 192:73–105. doi: 10.1534/genetics.111.135731. [DOI] [PMC free article] [PubMed] [Google Scholar]
- 13.Conrad M, Schothorst J, Kankipati HN, Van Zeebroeck G, Rubio-Texeira M, Thevelein JM. 2014. Nutrient sensing and signaling in the yeast Saccharomyces cerevisiae. FEMS Microbiol Rev 38:254–299. doi: 10.1111/1574-6976.12065. [DOI] [PMC free article] [PubMed] [Google Scholar]
- 14.Ohlmeier S, Kastaniotis AJ, Hiltunen JK, Bergmann U. 2004. The yeast mitochondrial proteome, a study of fermentative and respiratory growth. J Biol Chem 279:3956–3979. [DOI] [PubMed] [Google Scholar]
- 15.Egner A, Jakobs S, Hell SW. 2002. Fast 100-nm resolution three-dimensional microscope reveals structural plasticity of mitochondria in live yeast. Proc Natl Acad Sci U S A 99:3370–3375. doi: 10.1073/pnas.052545099. [DOI] [PMC free article] [PubMed] [Google Scholar]
- 16.Leadsham JE, Gourlay CW. 2010. cAMP/PKA signaling balances respiratory activity with mitochondria dependent apoptosis via transcriptional regulation. BMC Cell Biol 11:92. doi: 10.1186/1471-2121-11-92. [DOI] [PMC free article] [PubMed] [Google Scholar]
- 17.Taylor SD, Zhang H, Eaton JS, Rodeheffer MS, Lebedeva MA, O'Rourke TW, Siede W, Shadel GS. 2005. The conserved Mec1/Rad53 nuclear checkpoint pathway regulates mitochondrial DNA copy number in Saccharomyces cerevisiae. Mol Biol Cell 16:3010–3018. doi: 10.1091/mbc.E05-01-0053. [DOI] [PMC free article] [PubMed] [Google Scholar]
- 18.Lavoie H, Whiteway M. 2008. Increased respiration in the sch9Δ mutant is required for increasing chronological life span but not replicative life span. Eukaryot Cell 7:1127–1135. doi: 10.1128/EC.00330-07. [DOI] [PMC free article] [PubMed] [Google Scholar]
- 19.Liu Z, Butow RA. 2006. Mitochondrial retrograde signaling. Annu Rev Genet 40:159–185. doi: 10.1146/annurev.genet.40.110405.090613. [DOI] [PubMed] [Google Scholar]
- 20.Dimmer KS, Fritz S, Fuchs F, Messerschmitt M, Weinbach N, Neupert W, Westermann B. 2002. Genetic basis of mitochondrial function and morphology in Saccharomyces cerevisiae. Mol Biol Cell 13:847–853. doi: 10.1091/mbc.01-12-0588. [DOI] [PMC free article] [PubMed] [Google Scholar]
- 21.Fendt SM, Sauer U. 2010. Transcriptional regulation of respiration in yeast metabolizing differently repressive carbon substrates. BMC Syst Biol 4:12. doi: 10.1186/1752-0509-4-12. [DOI] [PMC free article] [PubMed] [Google Scholar]
- 22.Bonander N, Ferndahl C, Mostad P, Wilks MDB, Chang C, Showe L, Gustafsson L, Larsson C, Bill RM. 2008. Transcriptome analysis of a respiratory Saccharomyces cerevisiae strain suggests the expression of its phenotype is glucose insensitive and predominantly controlled by Hap4, Cat8 and Mig1. BMC Genomics 9:365. doi: 10.1186/1471-2164-9-365. [DOI] [PMC free article] [PubMed] [Google Scholar]
- 23.Rodriguez-Colman MJ, Reverter-Branchat G, Sorolla MA, Tamarit J, Ros J, Cabiscol E. 2010. The forkhead transcription factor Hcm1 promotes mitochondrial biogenesis and stress resistance in yeast. J Biol Chem 285:37092–37101. doi: 10.1074/jbc.M110.174763. [DOI] [PMC free article] [PubMed] [Google Scholar]
- 24.Liao XS, Small WC, Srere PA, Butow RA. 1991. Intramitochondrial functions regulate nonmitochondrial citrate synthase (CIT2) expression in Saccharomyces cerevisiae. Mol Cell Biol 11:38–46. doi: 10.1128/MCB.11.1.38. [DOI] [PMC free article] [PubMed] [Google Scholar]
- 25.Katada S, Imhof A, Sassone-Corsi P. 2012. Connecting threads: epigenetics and metabolism. Cell 148:24–28. doi: 10.1016/j.cell.2012.01.001. [DOI] [PubMed] [Google Scholar]
- 26.Wellen KE, Thompson CB. 2012. A two-way street: reciprocal regulation of metabolism and signaling. Nat Rev Mol Cell Biol 13:270–276. doi: 10.1038/nrm3305. [DOI] [PubMed] [Google Scholar]
- 27.Pietrocola F, Galluzzi L, Bravo-San Pedro JM, Madeo F, Kroemer G. 2015. Acetyl-CoA: a central metabolite and second messenger. Cell Metab 21:805–821. doi: 10.1016/j.cmet.2015.05.014. [DOI] [PubMed] [Google Scholar]
- 28.Cai L, Sutter BM, Li B, Tu BP. 2011. Acetyl-CoA induces cell growth and proliferation by promoting the acetylation of histones at growth genes. Mol Cell 42:426–437. doi: 10.1016/j.molcel.2011.05.004. [DOI] [PMC free article] [PubMed] [Google Scholar]
- 29.Shi L, Tu BP. 2015. Acetyl-CoA and the regulation of metabolism: mechanisms and consequences. Curr Opin Cell Biol 33:125–131. doi: 10.1016/j.ceb.2015.02.003. [DOI] [PMC free article] [PubMed] [Google Scholar]
- 30.Blackwell JS, Wilkinson ST, Mosammaparast N, Pemberton LF. 2007. Mutational analysis of H3 and H4 N termini reveals distinct roles in nuclear import. J Biol Chem 282:20142–20150. doi: 10.1074/jbc.M701989200. [DOI] [PubMed] [Google Scholar]
- 31.Mehrotra S, Galdieri L, Zhang T, Zhang M, Pemberton LF, Vancura A. 2014. Histone hypoacetylation-activated genes are repressed by acetyl-CoA- and chromatin-mediated mechanism. Biochim Biophys Acta 1839:751–763. doi: 10.1016/j.bbagrm.2014.05.029. [DOI] [PMC free article] [PubMed] [Google Scholar]
- 32.Yu Y, Eriksson P, Stillman DJ. 2000. Architectural transcription factors and the SAGA complex function in parallel pathways to activate transcription. Mol Cell Biol 20:2350–2357. doi: 10.1128/MCB.20.7.2350-2357.2000. [DOI] [PMC free article] [PubMed] [Google Scholar]
- 33.Macpherson N, Measday V, Moore L, Andrews B. 2000. A yeast taf17 mutant requires the Swi6 transcriptional activator for viability and shows defects in cell cycle-regulated transcription. Genetics 154:1561–1576. [DOI] [PMC free article] [PubMed] [Google Scholar]
- 34.Adkins MW, Tyler JK. 2004. The histone chaperone Asf1p mediates global chromatin disassembly in vivo. J Biol Chem 279:52069–52074. doi: 10.1074/jbc.M406113200. [DOI] [PubMed] [Google Scholar]
- 35.Glowczewski L, Waterborg JH, Berman JG. 2004. Yeast chromatin assembly complex 1protein excludes nonacetylatable forms of histone H4 from chromatin and the nucleus. Mol Cell Biol 24:10180–10192. doi: 10.1128/MCB.24.23.10180-10192.2004. [DOI] [PMC free article] [PubMed] [Google Scholar]
- 36.Sutton A, Bucaria J, Osley MA, Sternglanz R. 2001. Yeast ASF1 protein is required for cell cycle regulation of histone gene transcription. Genetics 158:587–596. [DOI] [PMC free article] [PubMed] [Google Scholar]
- 37.Ho Y, Mason S, Kobayashi R, Hoekstra M, Andrews B. 1997. Role of the casein kinase I isoform, Hrr25, and the cell cycle-regulatory transcription factor, SBF, in the transcriptional response to DNA damage in Saccharomyces cerevisiae. Proc Natl Acad Sci U S A 94:581–586. doi: 10.1073/pnas.94.2.581. [DOI] [PMC free article] [PubMed] [Google Scholar]
- 38.Feser J, Truong D, Das C, Carson JJ, Kieft J, Harkness T, Tyler JK. 2010. Elevated histone expression promotes life span extension. Mol Cell 39:724–735. doi: 10.1016/j.molcel.2010.08.015. [DOI] [PMC free article] [PubMed] [Google Scholar]
- 39.Bouck DC, Bloom K. 2007. Pericentric chromatin is an elastic component of the mitotic spindle. Curr Biol 17:741–748. doi: 10.1016/j.cub.2007.03.033. [DOI] [PMC free article] [PubMed] [Google Scholar]
- 40.Yu Y, Eriksson P, Bhoite LT, Stillman DJ. 2003. Regulation of TATA-binding protein binding by the SAGA complex and the Nhp6 high-mobility group protein. Mol Cell Biol 23:1910–1921. doi: 10.1128/MCB.23.6.1910-1921.2003. [DOI] [PMC free article] [PubMed] [Google Scholar]
- 41.Hess D, Liu B, Roan NR, Sternglanz R, Winston F. 2004. Spt10-dependent transcriptional activation in Saccharomyces cerevisiae requires both the Spt10 acetyltransferase domain and Spt21. Mol Cell Biol 24:135–143. doi: 10.1128/MCB.24.1.135-143.2004. [DOI] [PMC free article] [PubMed] [Google Scholar]
- 42.Sherman F. 1991. Getting started with yeast. Methods Enzymol 194:3–21. doi: 10.1016/0076-6879(91)94004-V. [DOI] [PubMed] [Google Scholar]
- 43.Galdieri L, Vancura A. 2012. Acetyl-CoA carboxylase regulates global histone acetylation. J Biol Chem 287:23865–23876. doi: 10.1074/jbc.M112.380519. [DOI] [PMC free article] [PubMed] [Google Scholar]
- 44.Zhang M, Galdieri L, Vancura A. 2013. The yeast AMPK homolog SNF1 regulates acetyl-coenzyme A homeostasis and histone acetylation. Mol Cell Biol 33:4701–4717. doi: 10.1128/MCB.00198-13. [DOI] [PMC free article] [PubMed] [Google Scholar]
- 45.Wellen KE, Hatzivassiliou G, Sachdeva UM, Bui TV, Cross JR, Thompson CB. 2009. ATP-citrate lyase links cellular metabolism to histone acetylation. Science 324:1076–1080. doi: 10.1126/science.1164097. [DOI] [PMC free article] [PubMed] [Google Scholar]
- 46.Dollard C, Ricupero-Hovasse SL, Natsoulis G, Boeke JD, Winston F. 1994. SPT10 and SPT21 are required for transcription of particular histone genes in Saccharomyces cerevisiae. Mol Cell Biol 14:5223–5228. doi: 10.1128/MCB.14.8.5223. [DOI] [PMC free article] [PubMed] [Google Scholar]
- 47.Eriksson PR, Mendiratta G, McLaughlin NB, Wolfsberg TG, Marino-Ramirez L, Pompa TA, Jainerin M, Landsman D, Shen CH, Clark DJ. 2005. Global regulation by the yeast Spt10 protein is mediated through chromatin structure and the histone upstream activating sequence elements. Mol Cell Biol 25:9127–9137. doi: 10.1128/MCB.25.20.9127-9137.2005. [DOI] [PMC free article] [PubMed] [Google Scholar]
- 48.Eriksson PR, Ganguli D, Nagarajavel V, Clark DJ. 2012. Regulation of histone gene expression in budding yeast. Genetics 191:7–20. doi: 10.1534/genetics.112.140145. [DOI] [PMC free article] [PubMed] [Google Scholar]
- 49.Kurat CF, Recht J, Radovani E, Durbic T, Andrews B, Fillingham J. 2014. Regulation of histone gene transcription in yeast. Cell Mol Life Sci 71:599–613. doi: 10.1007/s00018-013-1443-9. [DOI] [PMC free article] [PubMed] [Google Scholar]
- 50.Ransom M, Dennehey BK, Tyler JK. 2010. Chaperoning histones during DNA replication and repair. Cell 140:183–195. doi: 10.1016/j.cell.2010.01.004. [DOI] [PMC free article] [PubMed] [Google Scholar]
- 51.Li Q, Burgess R, Zhang Z. 2012. All roads lead to chromatin: multiple pathways for histone deposition. Biochim Biophys Acta 1819:238–246. doi: 10.1016/j.bbagrm.2011.06.013. [DOI] [PMC free article] [PubMed] [Google Scholar]
- 52.Li Q, Zhou H, Wurtele H, Davies B, Horazdovsky B, Verreault A, Zhang Z. 2008. Acetylation of histone H3 lysine 56 regulates replication-coupled nucleosomes assembly. Cell 134:244–255. doi: 10.1016/j.cell.2008.06.018. [DOI] [PMC free article] [PubMed] [Google Scholar]
- 53.Lascaris R, Bussemaker HJ, Boorsma A, Piper M, van der Spek H, Grivell L, Blom J. 2003. Hap4p overexpression in glucose-grown Saccharomyces cerevisiae induces cells to enter a novel metabolic state. Genome Biol 4:R3. doi: 10.1186/gb-2002-4-1-r3. [DOI] [PMC free article] [PubMed] [Google Scholar]
- 54.Harbison CT, Gordon DB, Lee TI, Rinaldi NJ, MacIsaac KD, Danford TW, Hannett NM, Tagne JB, Reynolds DB, Yoo J, Jennings EG, Zeitlinger J, Pokholok DK, Kellis M, Rolfe PA, Takusagawa KT, Lander ES, Gifford DK, Fraenkel E, Young RA. 2004. Transcriptional regulatory code of a eukaryotic genome. Nature 431:99–104. doi: 10.1038/nature02800. [DOI] [PMC free article] [PubMed] [Google Scholar]
- 55.Reimand J, Vaquerizas JM, Todd AE, Vilo J, Luscombe NM. 2010. Comprehensive reanalysis of transcription factor knockout expression data in Saccharomyces cerevisiae reveals many new targets. Nucleic Acids Res 38:4768–4777. doi: 10.1093/nar/gkq232. [DOI] [PMC free article] [PubMed] [Google Scholar]
- 56.MacIsaac KD, Wang T, Gordon DB, Gifford DK, Stormo GD, Fraenkel E. 2006. An improved map of conserved regulatory sites for Saccharomyces cerevisiae. BMC Bioinformatics 7:113. doi: 10.1186/1471-2105-7-113. [DOI] [PMC free article] [PubMed] [Google Scholar]
- 57.Ruiz-Roig C, Noriega N, Duch A, Posas F, de Nadal E. 2012. The Hog1 SAPK controls the Rtg1/Rtg3 transcriptional complex activity by multiple regulatory mechanisms. Mol Biol Cell 23:4286–4296. doi: 10.1091/mbc.E12-04-0289. [DOI] [PMC free article] [PubMed] [Google Scholar]
- 58.Yu H. 2007. Cdc20: a WD40 activator for a cell cycle degradation machine. Mol Cell 27:3–16. doi: 10.1016/j.molcel.2007.06.009. [DOI] [PubMed] [Google Scholar]
- 59.Sherwood PW, Tsang SV, Osley MA. 1993. Characterization of HIR1 and HIR2, two genes required for regulation of histone gene transcription in Saccharomyces cerevisiae. Mol Cell Biol 13:28–38. doi: 10.1128/MCB.13.1.28. [DOI] [PMC free article] [PubMed] [Google Scholar]
- 60.Spector MS, Raff A, DeSilva H, Lee K, Osley MA. 1997. Hir1p and Hir2p function as transcriptional corepressors to regulate histone gene transcription in the Saccharomyces cerevisiae cell cycle. Mol Cell Biol 17:545–552. doi: 10.1128/MCB.17.2.545. [DOI] [PMC free article] [PubMed] [Google Scholar]
- 61.Osley MA, Lycan D. 1987. Trans-acting regulatory mutations that alter transcription of Saccharomyces cerevisiae histone genes. Mol Cell Biol 7:4204–4210. doi: 10.1128/MCB.7.12.4204. [DOI] [PMC free article] [PubMed] [Google Scholar]
- 62.De Deken RH. 1966. The Crabtree effect: a regulatory system in yeast. J Gen Microbiol 44:149–156. doi: 10.1099/00221287-44-2-149. [DOI] [PubMed] [Google Scholar]
- 63.Diaz-Ruiz R, Rigoulet M, Devin A. 2011. The Warburg and Crabtree effects: on the origin of cancer cell energy metabolism and of yeast glucose repression. Biochim Biophys Acta 1807:568–576. doi: 10.1016/j.bbabio.2010.08.010. [DOI] [PubMed] [Google Scholar]
- 64.Forsburg SL, Guarente L. 1989. Identification and characterization of HAP4: a third component of the CCAAT-bound HAP2/HAP3 heteromer. Genes Dev 3:1166–1178. doi: 10.1101/gad.3.8.1166. [DOI] [PubMed] [Google Scholar]
- 65.DeRisi JL, Iyer VR, Brown PO. 1997. Exploring the metabolic and genetic control of gene expression on a genomic scale. Science 278:680–686. doi: 10.1126/science.278.5338.680. [DOI] [PubMed] [Google Scholar]
- 66.Blom J, Teixeira de Mattos MJ, Grivell LA. 2000. Redirection of respiro-fermentative flux distribution in Saccharomyces cerevisiae by overexpression of the transcription factor Hap4p. Appl Environ Microbiol 66:1970–1973. doi: 10.1128/AEM.66.5.1970-1973.2000. [DOI] [PMC free article] [PubMed] [Google Scholar]
- 67.Herzig S, Raemy E, Montessuit S, Veuthey JL, Zamboni N, Westermann B, Kunji ER, Martinou JC. 2012. Identification and functional expression of the mitochondrial pyruvate carrier. Science 337:93–96. doi: 10.1126/science.1218530. [DOI] [PubMed] [Google Scholar]
- 68.Bricker DK, Taylor EB, Schell JC, Orsak T, Boutron A, Chen YC, Cox JE, Cardon CM, Van Vranken JG, Dephoure N, Redin C, Boudina S, Gygi SP, Brivet M, Thummel CS, Rutter J. 2012. A mitochondrial pyruvate carrier required for pyruvate uptake in yeast, Drosophila, and humans. Science 337:96–100. doi: 10.1126/science.1218099. [DOI] [PMC free article] [PubMed] [Google Scholar]
- 69.Jazwinski SM. 2013. The retrograde response: when mitochondrial quality control is not enough. Biochim Biophys Acta 1833:400–409. doi: 10.1016/j.bbamcr.2012.02.010. [DOI] [PMC free article] [PubMed] [Google Scholar]
- 70.Amiott EA, Jaehning JA. 2006. Mitochondrial transcription is regulated via an ATP “sensing” mechanism that couples RNA abundance to respiration. Mol Cell 22:329–338. doi: 10.1016/j.molcel.2006.03.031. [DOI] [PubMed] [Google Scholar]
- 71.Deshpande AP, Patel SS. 2012. Mechanism of transcription initiation by the yeast mitochondrial RNA polymerase. Biochim Biophys Acta 1819:930–938. doi: 10.1016/j.bbagrm.2012.02.003. [DOI] [PMC free article] [PubMed] [Google Scholar]
- 72.Zhang L, Hach A. 1999. Molecular mechanism of heme signaling in yeast: the transcriptional activator HapI serves as the key mediator. Cell Mol Life Sci 56:415–426. doi: 10.1007/s000180050442. [DOI] [PMC free article] [PubMed] [Google Scholar]
- 73.Mense SM, Zhang L. 2006. Heme: a versatile signaling molecule controlling the activities of diverse regulators ranging from transcription factors to MAP kinases. Cell Res 16:681–692. doi: 10.1038/sj.cr.7310086. [DOI] [PubMed] [Google Scholar]
- 74.Pfeifer K, Kim KS, Kogan S, Guarente L. 1989. Functional dissection and sequence of yeast HAP1 activator. Cell 56:291–301. doi: 10.1016/0092-8674(89)90903-3. [DOI] [PubMed] [Google Scholar]
- 75.Zhang L, Guarente L. 1995. Heme binds to a short sequence that serves a regulatory function in diverse proteins. EMBO J 14:313–320. [DOI] [PMC free article] [PubMed] [Google Scholar]
- 76.Forsburg SL, Guarente L. 1989. Communication between mitochondria and the nucleus in regulation of cytochrome genes in the yeast Saccharomyces cerevisiae. Annu Rev Cell Biol 5:153–180. doi: 10.1146/annurev.cb.05.110189.001101. [DOI] [PubMed] [Google Scholar]
- 77.Olesen JT, Guarente L. 1990. The HAP2 subunit of yeast CCAAT transcriptional activator contains adjacent domains for subunit association and DNA recognition: model for the HAP2/3/4 complex. Genes Dev 4:1714–1729. doi: 10.1101/gad.4.10.1714. [DOI] [PubMed] [Google Scholar]
- 78.Rando OJ, Winston F. 2012. Chromatin and transcription in yeast. Genetics 190:351–387. doi: 10.1534/genetics.111.132266. [DOI] [PMC free article] [PubMed] [Google Scholar]
- 79.Tsankov AM, Thompson DA, Socha A, Regev A, Rando OJ. 2010. The role of nucleosomes positioning in the evolution of gene regulation. PLoS Biol 8:e1000414. doi: 10.1371/journal.pbio.1000414. [DOI] [PMC free article] [PubMed] [Google Scholar]
- 80.Field Y, Fondufe-Mittendorf Y, Moore IK, Mieczkowski P, Kaplan N, Lubling Y, Lieb JD, Widom J, Segal E. 2009. Gene expression divergence in yeast is coupled to evolution of DNA-encoded nucleosomes organization. Nat Genet 41:438–445. doi: 10.1038/ng.324. [DOI] [PMC free article] [PubMed] [Google Scholar]
- 81.Hu Z, Chen K, Xia Z, Chavez M, Pal S, Seol JH, Chen CC, Li W, Tyler JK. 2014. Nucleosome loss leads to global transcriptional up-regulation and genomic instability during yeast aging. Genes Dev 28:396–408. doi: 10.1101/gad.233221.113. [DOI] [PMC free article] [PubMed] [Google Scholar]
- 82.Moraes CT, Diaz F, Barrientos A. 2004. Defects in the biosynthesis of mitochondrial heme c and heme a in yeast and mammals. Biochim Biophys Acta 1659:153–159. doi: 10.1016/j.bbabio.2004.09.002. [DOI] [PubMed] [Google Scholar]