

ABSTRACT
The isolation of aerobic citrate-utilizing Escherichia coli (Cit+) in long-term evolution experiments (LTEE) has been termed a rare, innovative, presumptive speciation event. We hypothesized that direct selection would rapidly yield the same class of E. coli Cit+ mutants and follow the same genetic trajectory: potentiation, actualization, and refinement. This hypothesis was tested with wild-type E. coli strain B and with K-12 and three K-12 derivatives: an E. coli ΔrpoS::kan mutant (impaired for stationary-phase survival), an E. coli ΔcitT::kan mutant (deleted for the anaerobic citrate/succinate antiporter), and an E. coli ΔdctA::kan mutant (deleted for the aerobic succinate transporter). E. coli underwent adaptation to aerobic citrate metabolism that was readily and repeatedly achieved using minimal medium supplemented with citrate (M9C), M9C with 0.005% glycerol, or M9C with 0.0025% glucose. Forty-six independent E. coli Cit+ mutants were isolated from all E. coli derivatives except the E. coli ΔcitT::kan mutant. Potentiation/actualization mutations occurred within as few as 12 generations, and refinement mutations occurred within 100 generations. Citrate utilization was confirmed using Simmons, Christensen, and LeMaster Richards citrate media and quantified by mass spectrometry. E. coli Cit+ mutants grew in clumps and in long incompletely divided chains, a phenotype that was reversible in rich media. Genomic DNA sequencing of four E. coli Cit+ mutants revealed the required sequence of mutational events leading to a refined Cit+ mutant. These events showed amplified citT and dctA loci followed by DNA rearrangements consistent with promoter capture events for citT. These mutations were equivalent to the amplification and promoter capture CitT-activating mutations identified in the LTEE.
IMPORTANCE E. coli cannot use citrate aerobically. Long-term evolution experiments (LTEE) performed by Blount et al. (Z. D. Blount, J. E. Barrick, C. J. Davidson, and R. E. Lenski, Nature 489:513–518, 2012, http://dx.doi.org/10.1038/nature11514 ) found a single aerobic, citrate-utilizing E. coli strain after 33,000 generations (15 years). This was interpreted as a speciation event. Here we show why it probably was not a speciation event. Using similar media, 46 independent citrate-utilizing mutants were isolated in as few as 12 to 100 generations. Genomic DNA sequencing revealed an amplification of the citT and dctA loci and DNA rearrangements to capture a promoter to express CitT, aerobically. These are members of the same class of mutations identified by the LTEE. We conclude that the rarity of the LTEE mutant was an artifact of the experimental conditions and not a unique evolutionary event. No new genetic information (novel gene function) evolved.
INTRODUCTION
How genetic information evolves to generate new phenotypes/species is a central issue in biology. Long-term evolution experiments (LTEE) using microorganisms have been initiated by several groups, in part to empirically observe this phenomenon (1). LTEE using bacteria, bacteriophage, or yeast have distinct advantages that include high population numbers, rapid generation times, and the opportunity to freeze intermittent populations (frozen fossils) to track mutations over time. Coupled with whole-genome sequencing, evolutionary changes can be genetically characterized to identify a mutation(s) required for a specific phenotypic change and frozen intermediates can be revived to replay and confirm the events. The most famous and meticulously documented LTEE are those, initiated in 1988, in Richard Lenski's laboratory (2). Twelve parallel cultures of Escherichia coli REL606 (an E. coli B strain) have been growing aerobically in minimal salts medium with low glucose concentrations (0.0025%) for 27 years. Cultures are transferred daily into fresh medium. Frozen samples are preserved for each culture every 500 generations, providing a tremendous resource to study long-term bacterial adaptation under controlled conditions.
To date, the Lenski LTEE cultures exceed 63,000 generations, equivalent to over 1 million years of human evolution. Importantly, these experiments negate Gould's theory of contingency, i.e., the idea that if evolution were replayed, different outcomes would arise (3). All 12 cultures are undergoing surprisingly similar genetic trajectories, with one exception. After 15 years (33,000 generations), 1 of the 12 cultures increased in turbidity by utilizing citrate aerobically (Cit+) (4). The minimal medium in these experiments contains 1.7 mM citrate as a chelating agent. It is well known that wild-type E. coli cannot use citrate as a carbon source, aerobically, because it lacks a citrate transporter, but can use citrate under anaerobic conditions via expression of the CitT citrate/succinate antiporter (5–9). Genetic analysis of Lenski's Cit+ strain showed amplification of the citT locus, coupled with a promoter capture event of the upstream constitutive rnk promoter, allowing oxic CitT expression. Replay experiments from frozen fossils have shown a recurring common theme: amplification of citT followed by a promoter capture of a neighboring gene or an acquisition of an insertion element upstream of citT, either of which allows aerobic expression. These mutations account, in part, for the novel Cit+ phenotype. A point mutation in dctA (dicarboxylic acid transporter for succinate, fumarate, and malate) at position −20 from the dctA translational start is also a necessary mutation for efficient citrate utilization, as it allows recapture of succinate exported during citrate uptake (10). Importantly, adaptation to aerobic citrate use follows three evolutionary stages as defined by Lenski: potentiation, actualization, and refinement (10, 11). Potentiation involves mutations that may not have a discernible phenotype but that prepare the cell for future mutations leading to phenotypic change. Actualization involves a subsequent mutation(s) that generates the phenotype. Refinement is the further optimization of the phenotype once established in a population. The potentiating changes in the Cit+ phenotype are under active investigation by Lenski and others (12) and are not yet fully documented, but the citT promoter capture represents actualization and the dctA mutation represents refinement. Some authors assert that this evolved E. coli Cit+ strain represents an exceedingly rare, innovative gain-of-function mutation and argue for recognition of this E. coli variant as a newly evolved species (3, 13). This argument is made, in part, because citrate utilization is a key diagnostic to differentiate E. coli from other coliform species.
In this study, we challenged the interpretation that aerobic utilization of citrate by E. coli is necessarily a rare or innovative mutation warranting classification as an example of speciation. We hypothesized that the isolation of such mutants should be relatively easy, would follow the same genetic trajectory as that identified in the LTEE, and would utilize information present on the chromosome and not involve evolution of new information (novel gene function). As such, we predicted that the extremely long time required for E. coli to evolve to Cit+ status was due to the LTEE conditions and not to potentiating genetic events requiring 33,000 generations. To test our hypothesis, direct selection was used. Our rationale was based on the serendipitous outcome of Hall's 1982 experiments designed to isolate E. coli K-12 cells able to use phenyl-arabinose (14). After 14 days of aeration in minimal medium with phenyl-arabinose, cell numbers increased. However, the cells were growing on the citrate chelator in the medium, like the Cit+ strain from Lenski's LTEE, not the intended phenyl-arabinose substrate. Hall determined that at least two mutations are required for citrate utilization and, by transduction, mapped the mutation to the citrate operon cluster of the E. coli chromosome. He also speculated that these mutations activated the anaerobic citrate transporter. The adaptation was not documented by DNA analysis because genomic sequencing capabilities were not then available, nor is it clear that the Cit+ phenotype had undergone refinement. In retrospect, Hall's experiment can be interpreted as representing unintended “direct selection” for Cit+ mutants. The Lenski LTEE can be interpreted as representing an unintended genetic “screen” for Cit+ mutants. Direct selection is defined as selection occurring under conditions in which only the desired mutant can grow, while a genetic screen is defined as a screen occurring under conditions in which both the desired mutant and its parent can grow. We speculated that the difference in selective conditions could account for the days that it took Hall versus the years that it took Lenski to acquire the Cit+ phenotype.
To test our hypothesis, we did direct selection experiments in batch culture and modified direct selection experiments with weekly serial transfers. We used wild-type E. coli K-12, three mutant derivatives of E. coli K-12 (an E. coli ΔrpoS::kan mutant [with the σ38 stress response protein deleted and stationary-phase survival impaired], an E. coli ΔcitT::kan mutant [with an anaerobic citrate/succinate antiporter deleted], and an E. coli ΔdctA::kan mutant [with a dicarboxylic acid transporter deleted]) as controls, and two E. coli B strains (B and REL606). Three medium variants were used to isolate Cit+ mutants: (i) M9 minimal medium with citrate (6.8 mM) as the sole carbon source (M9C), (ii) M9C amended with a low concentration of glycerol (0.005%) (M9CG50) containing either 6.8 mM or 1.7 mM citrate (M9LC50), and (iii) M9C amended with a low concentration of glucose (0.0025%) (M9C25) containing either 6.8 mM or 1.7 mM citrate (M9LC25). The last medium, M9LC25, was equivalent to that used in the Lenski LTEE (2). Batch and serial transfer selection cultures were incubated aerobically, and growth was measured by turbidity and plate counts. Citrate utilization was detected using differential media and quantified by mass spectrometry (MS) of medium filtrates during various stages of growth. Cit+ mutants were phenotypically characterized by growth dynamics and microscopy and were genetically analyzed by transduction and by genomic and regional DNA sequencing. These experiments also provided the opportunity to compare the evolutionary trajectories of direct selection and a long-term genetic screen.
MATERIALS AND METHODS
Bacterial strains and growth conditions.
The bacterial strains used in this study are listed in Table 1. In order to use the E. coli K-12 Keio mutant collection that provides kanamycin (Kn)-marked mutations in every nonessential gene, systematic analyses of citrate utilization were done with this strain. The rpoS mutant, dctA mutant, and citT mutant control strains had E. coli K-12 kanamycin-marked mutations that allowed transduction experiments (see below). E. coli REL606 is the strain used in Lenski's LTEE. Stock cultures were maintained on Luria-Bertani (LB) agar and grown in LB broth (Difco, Detroit, MI). Directly selective citrate medium consisted of M9 mineral salts amended with 6.8 mM citrate and 50 μM thiamine (M9C). This 0.2% citrate concentration (6.8 mM versus M9 chelator concentration of 1.7 mM) is standard for a sole carbon source. It also has the added advantage of supporting more E. coli cell division than chelating concentrations such that initial mutants would be visually more apparent during selection. In addition, citrate at 6.8 mM or higher is used in diagnostic media to differentiate E. coli from citrate-utilizing coliforms. The modified directly selective citrate media consisted of M9C amended with either 0.005% glycerol (M9CG50) or 0.0025% glucose (M9C25). To reproduce the LTEE conditions, these media were also used with the lower (1.7 mM) citrate concentration (M9LC25 or M9LCG50, respectively). Colonies were isolated on LeMaster Richards minimal media supplemented with 6.8 mM citrate (15) and solidified with 1.5% Nobel agar (LRC), Simmons citrate (Becton Dickinson, Franklin Lakes, NJ), or Christensen citrate agars (Sigma, St. Louis, MO). The last two media are selective differential media used to diagnostically detect citrate utilization in enteric bacteria. In Simmons citrate agar, citrate (6.8 mM or 0.2%) is the sole carbon source and citrate-metabolizing organisms cleave citrate to oxaloacetate and acetate. Oxaloacetate dehydrogenase then converts oxaloacetate to pyruvate and CO2, and the CO2 is converted to sodium carbonate, resulting in an alkaline pH shift and conversion of the pH indicator, bromthymol blue, from green (neutral) to blue (alkaline). Wild-type E. coli does not grow on Simmons citrate agar or does so minimally, producing pinpoint yellow colonies (acidic) after 1 week of incubation. Christensen citrate agar (0.3% citrate) also contains a low concentration of glucose (0.01%) and the pH indicator phenol red. E. coli (citrate negative) grows on the limited-glucose agar to produce visible colonies in 18 to 24 h, but the colonies are colorless to slightly yellow (acidic). Citrate-positive organisms likewise first grow on the glucose and then convert to citrate metabolism, producing cerise (alkaline) colonies by the same reaction pathway as that described for Simmons citrate agar. All bacteria were stored at −80°C in LB or M9C containing 5% glycerol. Mutants were verified to be E. coli by comparing levels of growth on sorbitol MacConkey agar (Difco, Detroit, MI) with 4-methyl-umbelliferyl-β-d-glucuronide (SMAC-MUG) (16) or on eosin methylene blue (EMB) agar (Difco). Bacterial strains harboring kanamycin resistance (Knr) were grown where noted with 50 μg/ml kanamycin (Sigma, St. Louis, MO).
TABLE 1.
E. coli strains used in this study
| Strain or phage | Genotype or parent strain and descriptiona | Source |
|---|---|---|
| Strains | ||
| MG1655 | rph-1 (wt) | E. Top, University of Idaho collection |
| JW0604-1 | F− Δ(araD-araB)567 ΔlacZ4787(::rrnB-3) ΔcitT750::kan λ− rph-1 Δ(rhaD-rhaB)568 hsdR514 | Keio collection, Yale University |
| JW3496-1 | F− Δ(araD-araB)567 ΔlacZ4787(::rrnB-3) λ− ΔdctA783::kan rph-1 Δ(rhaD-rhaB)568 hsdR514 | Keio collection, Yale University |
| JW5437-1 | F− Δ(araD-araB)567 ΔlacZ4787(::rrnB-3) λ− ΔrpoS746::kan rph-1 Δ(rhaD-rhaB)568 hsdR514 | Keio collection, Yale University |
| B | (wt) F− | Coli Genetic Stock Center, Yale University |
| REL606 | F− tsx-467(Am) araA230 lon rpsL227 (Strr) hsdR [mal+]K-12(λS) | Coli Genetic Stock Center, Yale University |
| Cit+ mutants | ||
| Mutants obtained by direct selection in M9C | ||
| DV159 | MG1655 (wt), Cit+ at 30 days | |
| DV160 | MG1655 (wt), Cit+ at <40 days | This study |
| DV133T | MG1655 (wt), phage transduction from DV133 | |
| SO191 | JW3496-1 (ΔdctA), Cit+ at 134 days | This study |
| DV130 | JW5437-1 (ΔrpoS), Cit+ at 43 days | |
| DV133 | JW5437-1 (ΔrpoS), refined from DV130 via several cycles on SC agar | This study |
| DV162 | JW5437-1 (ΔrpoS), Cit+ at <40 days | This study |
| DV268 | JW5437-1 (ΔrpoS), Cit+ at <40 days | This study |
| Mutants obtained by modified direct selection in M9C25 (glucose supported) | ||
| DV247 | MG1655 (wt), Cit+ at 31 days | This study |
| DV290 | MG1655 (wt), Cit+ at 35 days | This study |
| DV291 | MG1655 (wt), Cit+ at 35 days | This study |
| DV309 | MG1655 (wt), Cit+ at 42 days | This study |
| DV312 | MG1655 (wt), Cit+ at 42 days | This study |
| DV313 | MG1655 (wt), Cit+ at 42 days | This study |
| DV314 | MG1655 (wt), Cit+ at 42 days | This study |
| DV315 | MG1655 (wt), Cit+ at 42 days | This study |
| DV409 | MG1655 (wt), Cit+ at 77 days | This study |
| DV344 | JW5437-1 (ΔrpoS), Cit+ at 68 days | This study |
| Mutants obtained by modified direct selection in M9CG50 (glycerol supported) | ||
| DV179 | MG1655 (wt), Cit+ at 28 days | This study |
| DV215 | MG1655 (wt), Cit+ at 21 days | This study |
| DV172 | JW5437-1 (ΔrpoS), Cit+ at 19 days | This study |
| DV216 | JW5437-1 (ΔrpoS), Cit+ at 21 days | This study |
| DV351 | JW5437-1 (ΔrpoS), Cit+ at 35 days and refined from papillated colony | This study |
| Mutants obtained by modified direct selection in M9LC25 (glucose supported, 1.7 mM citrate [low citrate]) | ||
| DV564 | MG1655 (wt), Cit+ at 40 days | This study |
| DV596 | MG1655 (wt), Cit+ at 56 days | This study |
| DV600 | MG1655 (wt), Cit+ at 56 days | This study |
| DV592 | MG1655 (wt), Cit+ at 63 days | This study |
| DV593 | MG1655 (wt), Cit+ at 63 days | This study |
| DV594 | MG1655 (wt), Cit+ at 63 days | This study |
| DV595 | MG1655 (wt), Cit+ at 63 days | This study |
| DV599 | MG1655 (wt), Cit+ at 63 days | This study |
| DV601 | MG1655 (wt), Cit+ at 63 days | This study |
| DV602 | MG1655 (wt), Cit+ at 63 days | This study |
| DV603 | MG1655 (wt), Cit+ at 63 days | This study |
| DV604 | REL606, Cit+ at 63 days | This study |
| Mutants obtained by modified direct selection in M9LCG50 (glycerol supported, 1.7 mM citrate [low citrate]) | ||
| DV545 | MG1655 (wt), Cit+ at 35 days | This study |
| DV546 | MG1655 (wt), Cit+ at 35 days | This study |
| DV571 | MG1655 (wt), Cit+ at 40 days | This study |
| DV572 | MG1655 (wt), Cit+ at 41 days | This study |
| DV605 | B (wt), Cit+ at 63 days | This study |
| DV608 | B (wt), Cit+ at 63 days | This study |
| DV609 | B (wt), Cit+ at 63 days | This study |
| DV610 | B (wt), Cit+ at 63 days | This study |
| DV611 | REL606, Cit+ at 63 days | This study |
| DV613 | REL606, Cit+ at 63 days | This study |
| DV614 | REL606, Cit+ at 63 days | This study |
| DV615 | REL606, Cit+ at 63 days | This study |
| DV616 | REL606, Cit+ at 63 days | This study |
| Phage P1(vir) | Nonlysogenic transducing phage | P. Hartzell |
wt, wild type; SC agar, Simmons citrate agar.
Selection for E. coli Cit+ mutants.
Three protocols were used to select E. coli Cit+ mutants from four E. coli K-12 strains (the wild-type, ΔrpoS::kan, ΔcitT::kan, and ΔdctA::kn strains) and two E. coli B strains (B and REL606). In the first method, each E. coli K-12 strain was grown overnight at 37°C with aeration in 5 ml of LB broth, after which cells were concentrated by centrifugation, and cell pellets were washed twice with M9 salts. Cells were resuspended in 50 ml of M9C broth in 250-ml Erlenmeyer flasks to give a final concentration of 5.0 × 10⁷ to 7.0 × 10⁷ CFU/ml and incubated at 37°C with aeration at 160 rpm. Growth was visually monitored daily for increased turbidity and measured by absorption at an optical density at 600 (OD600). An aliquot of cells was removed weekly from each flask, quantified by triplicate plate counts on LB agar, and cryopreserved. During extended incubations, flasks were rehydrated with sterile distilled water weekly to compensate for evaporation.
The second two methods consisted of modified direct selections using 50 ml of M9C in 250-ml Erlenmeyer flasks, one amended with 0.005% glycerol (M9CG50) and the other amended with 0.0025% glucose (M9C25). Both carbon concentrations supported approximately six generations of growth (OD600 = 0.03). Flasks were incubated at 37°C with constant shaking for 1 week and then diluted (1:100) into fresh media. This cycle was repeated until the culture turbidity at OD600 increased to >0.6. Aliquots were cryopreserved weekly. These experiments were also conducted with 1.7 mM citrate to determine if the concentration of citrate affected mutant selection. These low-citrate media are designated M9LC25 (glucose) and M9LCG50 (glycerol).
In all variations of Cit+ mutant selection, once the absorbance reached an OD600 of >0.07 (1.7 mM citrate-containing media) or >0.6 (6.8 mM citrate-containing media), an aliquot of the culture was diluted (1:100) into 10 ml of M9C medium and incubated with aeration until absorbance (OD600, >0.07 or >0.6) was again observed. Individual colonies were isolated by streak dilution on LRC agar or diluted and plated on Simmons and Christensen citrate agars. Large colonies arising after 2 to 3 days of incubation on LRC agar were likewise tested on Simmons and Christensen citrate agars. Blue colonies on Simmons citrate agar (representing strong citrate use) were repurified by 12 h of growth in LB broth and plated on fresh Simmons citrate agar. Large isolated colonies were grown in M9C broth for cryopreservation. All Cit+ mutants were verified to be E. coli by patching isolated colonies sequentially onto SMAC-MUG agar, Simmons citrate agar, and Christensen citrate agar.
P1(vir) bacteriophage transduction experiments.
Transduction experiments were conducted with P1(vir) bacteriophage as described by Lennox (17) at a multiplicity of infection (MOI) of 0.1:1. Donor cell lysates were preserved at 4°C using chloroform. Phage titers were quantified by plaque counts done in triplicate by 10-fold dilutions in 4 ml of LB soft agar (0.4%) seeded with 100 μl of E. coli K-12 wild-type cells and overlaid on LB agar plates or by dropping 10 μl of 10-fold dilutions on LB soft agar overlays seeded with 100 μl of E. coli K-12 cells.
Mass spectrometry of culture filtrates for metabolite identification.
To verify citrate utilization, putative Cit+ isolates were inoculated into 5 ml of M9C broth. Cultures were incubated until exponential phase and were diluted (1:100) into 50 ml of M9C in 250-ml shake flasks. Growth was monitored in 6-h intervals by determining turbidity at OD600. Additionally, 1-ml aliquots were centrifuged for each time point to remove cells and subjected to filter sterilization using 0.2-μm-pore-size filters, and subsets of these samples, correlating to the various stages of growth curves, were analyzed by mass spectrometry. The concentrations of citrate, succinate, acetate, fumarate, malate, glutamine, and indole were measured using reverse-phase chromatographic separation combined with multiple reaction monitoring methods for all of the analytes except acetate, where a single ion reaction monitoring method was used. The liquid chromatographic separation was done using a Waters Acquity ultraperformance liquid chromatography (UPLC) instrument equipped with a Waters Acquity UPLC BEH C18 column with 1.7-μm-particle-size packing. The column was 2.1 mm in diameter by 50 mm in length and was maintained at 28°C. A binary solvent was used where solvent A was 99.9% water with 0.1% formic acid and solvent B was 99.9% acetonitrile with 0.1% formic acid. The solvent flow was 100 μl/min throughout the course of the separation. The solvent-mixing program began with the ratio of 100% solvent A/0% solvent B. The concentration of solvent B was increased linearly to 3% over 3 min following injection. The gradient rate was then increased, and the concentration of solvent B reached 80% at 14 min. The ratio of solvent A to solvent B was held constant for 1 min, the concentration of solvent A was returned to 100% over the next 2.5 min, and the column was allowed to equilibrate at 100% solvent A for 2.5 min before the next injection. A 10-μl injection volume was used for all standards and samples. The column eluent flow was passed through the flow cell of an Acquity photodiode array detector and then to the electrospray ionization (ESI) sprayer of a Waters Xevo TQ MS triple-quadrupole mass spectrometer. The mass spectrometry methods were programmed to acquire data in negative ion mode for all of the analytes except indole, where the data were collected in positive ion mode. The negative ion mode capillary voltage was held at 2.5 kV, and the positive ion mode capillary voltage was held at 3.4 kV. The desolvation gas flow was 400 liters/h, the desolvation temperature was 300°C, and the source temperature was 150°C. The organic acids eluted first, and data were acquired in the first 5 min of the chromatographic run. At 5 min, the method switched to positive ion mode and the data for indole were acquired within the next 10 min. The settings for precursor masses, product ion masses, cone voltages, collision voltages, and dwell times are listed in Table 2. All standards and samples were analyzed in triplicate. The data were integrated and analyzed using TargetLynx quantitation software from Waters Corp. An external calibration was used, and the standard data were fitted to quadratic curves. The samples, except the “media only” control, were brought to a 1% concentration of formic acid by dilution of 99 μl of clarified culture media with 1 μl of formic acid prior to analysis. The “media-only” sample was diluted 10-fold and brought to a 1% concentration of formic acid before analysis.
TABLE 2.
Mass spectrometry settings for precursor masses, product ion masses, cone voltages, collision voltages, and dwell timesa
| Analyte | Precursor m/z | Product m/z | Cone V | Collision V | Dwell time (s) |
|---|---|---|---|---|---|
| Acetate | 58.8 | SIR | 28 | NA | 0.11 |
| Lactate 1 | 88.74 | 42.87 | 14 | 10 | 0.11 |
| Lactate 2 | 88.74 | 44.88 | 14 | 10 | 0.11 |
| Fumarate 1 | 114.72 | 26.96 | 26 | 10 | 0.11 |
| Fumarate 2 | 114.72 | 70.93 | 26 | 8 | 0.11 |
| Succinate 1 | 116.87 | 72.94 | 26 | 10 | 0.11 |
| Succinate 2 | 116.87 | 98.32 | 26 | 11 | 0.11 |
| Malate 1 | 132.86 | 132.86 | 70.28 | 30 | 0.11 |
| Malate 2 | 132.86 | 132.86 | 70.28 | 30 | 0.11 |
| Glutamine 1 | 144.91 | 83.97 | 36 | 14 | 0.11 |
| Glutamine 2 | 114.91 | 109 | 36 | 12 | 0.11 |
| Citrate 1 | 190.87 | 190.87 | 86.9 | 28 | 0.11 |
| Citrate 2 | 190.87 | 190.87 | 110.95 | 28 | 0.11 |
| Indole 1 | 117.83 | 117.83 | 64.88 | 48 | 0.745 |
| Indole 2 | 117.83 | 117.83 | 90.95 | 48 | 0.745 |
SIR, single ion reaction; NA, not applicable.
Whole-genome sequencing.
Chromosomal DNA was prepared from E. coli Cit+ mutants designated DV130, DV133, DV133T, and DV159 (Table 1) using a GenElute bacterial genomic DNA kit (Sigma, St. Louis, MO) or a bacterial genomic DNA extraction protocol (18). Genomic DNA samples (15 μg) were sequenced using the Pacific Biosciences RS II sequencing platform at the Washington State University genomics core laboratory or the Icahn School of Medicine at Mount Sinai (NY) genomics core sequencing facilities. The sequences were deposited in the National Center for Biotechnology Information Sequence Read Archive. Sequences were assembled de novo via HGAP3 (PacBio) and compared to the sequences of the genome of E. coli K-12 MG1655.
Microscopic analysis.
Digital micrographs of cells were taken at ×400 magnification using a Nikon Microphot FXA phase microscope fitted with a Photometrics Cool Snap cf camera. Bacterial colonies were photographed using a Nikon dissecting microscope at ×20 magnification with the same camera.
Nucleotide sequence accession numbers.
The GenBank accession numbers for the DV133, DV159, DV133T, and DV130 sequences determined in this work are CP014348, LRDF00000000, LRDE00000000, and LRDD00000000, respectively.
RESULTS
Multiple independent E. coli K-12 Cit+ phenotypes were isolated by direct selection using M9C.
Direct selection in M9C broth containing 0.2% citrate as the sole carbon source was performed. This experiment is analogous to that performed by Hall (14) in which E. coli was subjected to starvation conditions. Six independent E. coli Cit+ isolates were recovered (Table 1 and Fig. 1). Experimental conditions consisted of four flasks inoculated with E. coli wild-type cells or E. coli ΔrpoS::kan, E. coli ΔcitT::kan, or E. coli ΔdctA::kan mutant cells. Bacterial growth was visually monitored daily for increased turbidity and quantified weekly by plate counts on LB agar, and aliquots were cryopreserved weekly. Two Cit+ mutants arose from the E. coli wild-type strain, three Cit+ mutants arose from the E. coli ΔrpoS::kan mutant strain, and one Cit+ mutant arose from the E. coli ΔdctA::kan mutant strain. Representative growth curves from two experiments are shown in Fig. 1. During weeks of declining bacterial numbers, subpopulations presumably underwent potentiating mutations until the Cit+ phenotype was actualized as evidenced by exponential growth. All Cit+ E. coli strains were recovered within 40 days of the beginning of the selection incubations, with one exception, the E. coli ΔdctA::kan mutant, which arose after 134 days (Table 1). Recovery of E. coli Cit+ cells did not occur among any of the E. coli ΔcitT::kan mutant strains (Table 1).
FIG 1.
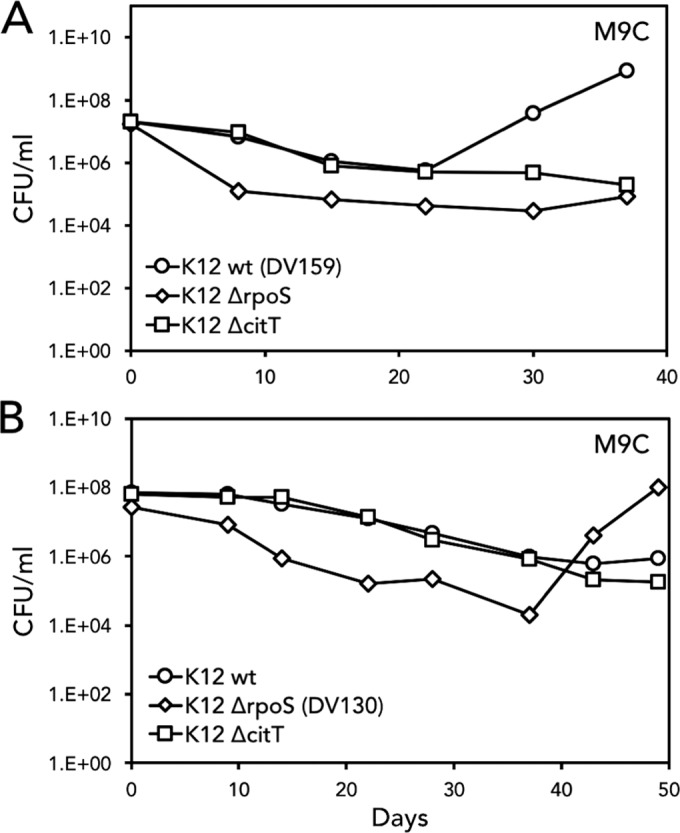
Direct selection of E. coli in minimal M9C yielded Cit+ mutants for both E. coli wild-type and E. coli ΔrpoS::kan strains but not for the E. coli ΔcitT::kan mutant strain. (A) Results of two separate representative experiments are shown. The E. coli wild-type (wt), E. coli ΔrpoS::kan, and E. coli ΔcitT::kan strains were inoculated into individual 250-ml flasks containing 50 ml of M9 minimal medium with citrate as the sole carbon source. E. coli wild-type and E. coli ΔcitT::kan levels decreased by 1 log until after day 23, when the wild-type strain (designated DV159) reinitiated exponential growth. (B) Results of a parallel experiment are shown. The level of the E. coli ΔrpoS::kan strain decreased by almost 2 log until after day 37, when it reinitiated exponential growth. This strain was designated DV130.
Because of the potential for contamination in the extended incubation of these cultures, all Cit+ isolates were meticulously confirmed to be E. coli by scoring 100 colonies from LB agar plates for specific E. coli phenotypes on SMAC-MUG agar for the E. coli wild-type strains and on SMAC-MUG Kn agar for the E. coli ΔrpoS::kan strain. All hundred colonies at each time point were sorbitol and MUG positive (fluoresced under UV light), reactions were confirmatory for E. coli, and the E. coli ΔrpoS::kan strain was positive for kanamycin resistance (data not shown). This confirmed that these cells matched the phenotype of the starting culture. Kanamycin was not used in the medium during the Cit+ selection experiments. E. coli Cit+ cells from direct selection flasks were plated on LRC agar, and a single large colony from each experiment was used for further characterization.
Multiple independent E. coli K-12, E. coli B, and E. coli REL606 Cit+ phenotypes were isolated using modified direct selection in M9C medium supplemented with glycerol or glucose.
The direct selection of Cit+ mutants described above was repeated with the four E. coli K-12 test strains using M9C medium supplemented with either 0.005% glycerol or 0.0025% glucose, equivalent to the low-level carbon concentrations used in the LTEE by Lenski (2). The rationale for these experiments was that of providing a limiting usable carbon source to support approximately six generations of growth and thereby increasing the likelihood of mutations among replicating cells, in contrast to the limited cell division in the “starvation” direct selection described above. Glycerol was used to determine if catabolite repression or growth rate affected selection of Cit+ mutants. Fourteen E. coli Cit+ isolates (Table 1) were recovered from these experiments: 5 of 6 from glycerol-containing flasks with E. coli K-12 wild-type or E. coli ΔrpoS::kan cells and 9 of 9 from glucose-containing flasks with E. coli K-12 wild-type cells. After inoculation (9 × 10⁵ to 7 × 10⁶ CFU/ml), the turbidity of the cultures rose to an OD600 of 0.02 to 0.03 overnight, or the equivalent of approximately six generations based on plate count (data not shown). These cultures were maintained for 7 days in stationary phase, after which cells were inoculated into fresh media at a 1:100 dilution, similarly to Lenski's LTEE but with deliberately extended time spent in stationary phase to enrich for the desired Cit+ phenotype. Results of representative experiments are shown in Fig. 2A and B. Following weekly transfers into fresh media, subpopulations presumably underwent potentiating mutations until the E. coli Cit+ phenotype was actualized as evidenced by exponential growth of E. coli wild-type and E. coli ΔrpoS::kan cells. All but one E. coli Cit+ strain were recovered within two to five weekly transfers, representing 12 to 30 generations. In general, adaptation to the Cit+ phenotype was slower among cells in M9C supplemented with glucose than among cells in M9C supplemented with glycerol (the first mutants were obtained after the fifth versus the second transfer) (Table 1). Within 63 days, recovery of E. coli Cit+ cells did not occur among any of the flasks containing the E. coli ΔcitT::kan mutant or the E. coli ΔdctA::kan mutant. We concluded that direct selection of E. coli K-12 Cit+ cells readily occurred when M9C medium was supplemented with low levels of glycerol or glucose, similarly to direct selection in M9C medium. Furthermore, lack of citrate-dependent growth in either the E. coli ΔcitT::kan mutant or E. coli ΔdctA::kan mutant experiments showed the both of these genes were necessary for adaptation to citrate utilization within this time frame.
FIG 2.

Modified direct selection of E. coli yielded Cit+ mutants independently of strain and citrate concentration. Mutants arose for the E. coli K-12, E. coli K-12 ΔrpoS::kan, E. coli B, and E. coli REL606 strains but not for the E. coli ΔcitT::kan strain or the E. coli ΔdctA::kan strain. Results of four separate representative experiments are shown. Each flask was inoculated with ∼5.0 × 10⁵ CFU/ml, and every 7 days, cultures were diluted 1:100 into fresh medium. OD600 levels were measured before transfer. (A and B) The E. coli K-12 wild-type, E. coli ΔrpoS::kan, E. coli ΔdctA::kan, and E. coli ΔcitT::kan strains were inoculated into individual 250-ml flasks containing 50 ml of M9 minimal medium, 6.8 mM citrate, and either 0.0025% glucose (M9C25) or 0.005% glycerol (M9CG50). This level of glucose or glycerol supported six generations of growth. (A) In M9C25, Cit+ mutants arose for the E. coli K-12 and E. coli ΔrpoS::kan strains after the forth and ninth transfers, respectively. (B) In M9CG50, Cit+ mutants arose for the E. coli K-12 and E. coli ΔrpoS::kan strains after the third transfer. Citrate-supported growth was not recovered for either the E. coli ΔdctA::kan strain or the E. coli ΔcitT::kan strain. (C and D) Similarly, the E. coli K-12 wild-type, E. coli B, and E. coli REL606 strains were inoculated into M9 minimal medium containing 1.7 mM citrate and either 0.0025% glucose (M9LC25) or 0.005% glycerol (M9LCG50). Cit+ mutants arose in E. coli K-12 after five or four transfers, in E. coli B after four or five transfers, and in E. coli REL606 after eight and five transfers (panels C and D, respectively).
To show that the isolation of potentiated/actualized Cit+ mutants was strain and citrate concentration independent, experiments were done using E. coli K-12, E. coli B, and E. coli REL606 in media with 1.7 mM citrate. Over the 9-week course, 15 of 16 E. coli K-12-containing flasks, 4 of 12 E. coli B-containing flasks, and 6 of 12 E. coli REL606-containing flasks gave rise to Cit+ mutants (Table 1). Results of representative experiments are shown in Fig. 2C and D. As expected, reducing the citrate level by one-fourth reduced the maximum OD600 of E. coli K-12 by the same factor. Although E. coli B and E. coli REL606 followed the same pattern, the maximum OD600 attained was 0.08. We did not carry the E. coli B or E. coli REL606 experiments to refinement because both strains are defective in growth on succinate (data not shown), which also explains the lower level of growth. However, we predict that refined mutants would be obtained with longer selections, as shown with Cit+ strain SO191, derived from the phenotypically equivalent E. coli K-12 ΔdctA::kan mutant after 4 months. We concluded from these experiments that isolation of Cit+ mutants was rapidly and readily attained regardless of the citrate concentration and strain lineage.
All independently isolated E. coli Cit+ phenotypes had long lag phases before reinitiation of growth in M9C.
Cit+ cells from all three selection protocols displayed a long lag phase when transferred (1:100 dilution) from turbid primary selection media into fresh M9C broth. The length of this lag phase ranged from 4 to 7 days. Additionally, when cells were plated on Simmons citrate agar, small yellow colonies appeared only after 2 to 3 days. Colonies plated on Christensen citrate agar showed a weak, delayed cerise reaction after 24 to 36 h compared to the unselected E. coli strains, which all appeared as white colonies. Cells from secondary turbid M9C broth cultures were streak purified on LRC agar and consistently resulted in several larger colonies amid a background of pinpoint colonies after 2 to 3 days of incubation. These large-colony E. coli Cit+ derivatives displayed more-rapid growth in M9C broth, and this shorter (24- to 36-h) lag phase was stable on subsequent transfers into fresh medium (see Fig. 4). Importantly, when these large-colony E. coli Cit+ isolates were grown on Simmons citrate agar, blue colonies, indicative of strong citrate metabolism, appeared within 36 to 48 h. When the isolates were grown on Christensen citrate agar, a strong positive cerise reaction was observed within 12 h. Collectively, these strong positive reactions on citrate differential media and shortened lag phases indicated that refinement of the E. coli Cit+ phenotype had occurred.
FIG 4.
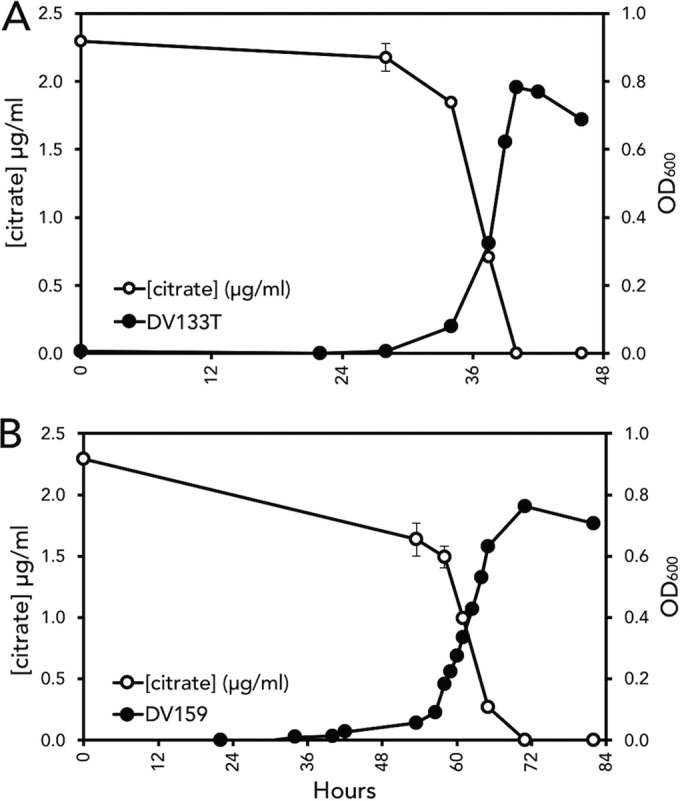
Mass spectrometry showed that citrate depletion correlated with E. coli growth. Two E. coli Cit+ mutants derived from E. coli wild-type isolates, DV133T (A) and DV159 (B), were inoculated into M9C minimal medium, and the OD600 was measured every 6 h. Triplicate medium samples at each time point were subjected to filter sterilization, and a subset of samples corresponding to time zero and the late lag and early-, mid-, and late-exponential and stationary phases were analyzed by mass spectrometry for citric acid. Bars represent ± standard errors (S.E.).
The long lag phase before reinitiation of growth of primary E. coli Cit+ isolates could be shortened to 12 to 18 h by using filter-sterilized M9C spent media from turbid E. coli Cit+ cultures, readjusted for M9 salts and citrate. Serial dilutions of spent media showed a growth-promoting dose-dependent response (data not shown). This suggested that quorum sensing could be involved. Although autoinducer 2 (AI-2) was detected in these spent medium supernates, as assayed with Vibrio harveyi test strains (19, 20), addition of purified AI-2 to these cultures had no growth promoting effect and we did not pursue this further (data not shown).
Surprisingly, Cit+ isolates were easily obtained using the E. coli ΔrpoS::kan strain. To show that lack of RpoS or of another mutation(s) present in this strain (Table 1) was not a contributing factor for citrate utilization, we made a P1(vir) bacteriophage lysate based on the strain DV133 isolate. This lysate was used to transduce E. coli K-12 wild-type cells at an MOI of 0.1:1. Transduced cells were diluted in 50 ml M9C broth and incubated at 37°C with aeration. Because citrate binds free calcium and therefore prevents P1(vir) phage infection (21), concern for secondary infection of transductants by transducing or lytic phage in this mixture was alleviated. After 4 days, the transduced culture displayed turbid growth with an OD600 of 0.7 and a sample from this flask was streaked directly onto Simmons citrate agar. Blue colonies appeared after 2 days. These colonies were sorbitol, MUG, and lactose positive and Kns, indicating that these transductants were not contaminated by the DV133 donor (lactose negative on EMB agar and Knr). This E. coli K-12 wild-type Cit+ transductant was designated strain DV133T (Table 1).
We also identified a method of isolating refined E. coli Cit+ cells on solid media. Actualized E. coli Cit+ cells (long lag phase, pinpoint yellow colonies on Simmons citrate agar) were incubated with maintained humidity for several weeks. During this extended incubation period, small blue papillae arose within these yellow colonies (Fig. 3). Using a dissecting scope for viewing colonies, these papillae were picked and streaked onto fresh Simmons citrate agar. Large blue colonies appeared in 2 to 3 days and were separated from background yellow pinpoint colonies. Different papillae within the same colony or from different colonies represented independent transitions from actualized Cit+ cells to the refined stage of citrate metabolism. This transition was not observed with unpotentiated E. coli K-12 wild-type or E. coli ΔrpoS::kan mutant cultures (data not shown). Using this technique, additional E. coli Cit+ refined phenotypes were isolated.
FIG 3.
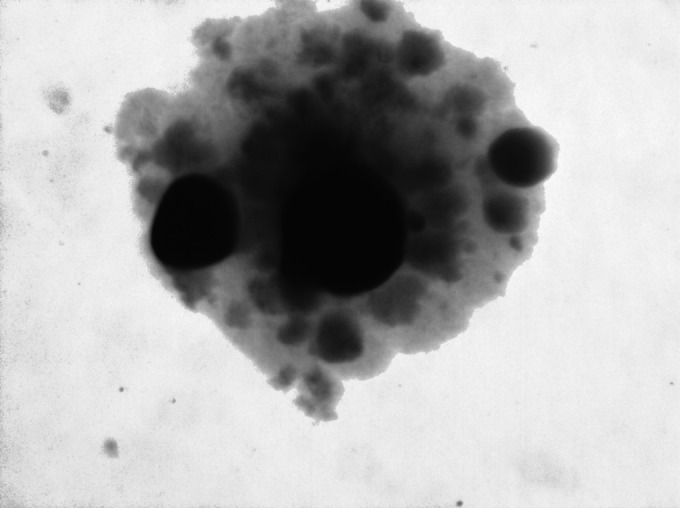
Extended incubation of actualized E. coli Cit+ bacteria on Simmons citrate agar yielded refined E. coli Cit+ papillae. Primary direct selection M9C broth that displayed growth was plated on Simmons citrate agar. Small yellow colonies appeared after 3 to 4 days of incubation, and small blue papillae (irregular darkened regions) appeared as shown after 10 to 20 days. Each blue papilla represents an independent mutation to the refinement stage.
E. coli Cit+ phenotype growth correlated with citrate depletion in M9C broth.
Growth curve determinations were conducted with two Cit+ refined isolates, DV133 and DV159. Filtered supernates obtained from these growth curve experiments were subjected to mass spectrometry at timed intervals to detect citrate and other metabolite concentrations. As shown in Fig. 4, bacterial growth correlated with depletion of citrate in the culture medium. Low levels of succinate were detected throughout these growth experiments, and acetate levels peaked in late exponential phase and dropped to undetectable levels in the stationary phases (data not shown). We did not detect any of the other organic acids tested. Although Kovac's reagent added to stationary-phase culture samples gave a weak positive indole reaction, we did not detect this analyte by mass spectrometry.
E. coli Cit+ phenotypes from M9C broth were clumped or incompletely divided, and colonies derived directly from the broth were not clonal.
Microscopic examination of E. coli Cit+ cells from M9C medium showed predominantly elongated predivisional cells, often in clumps or “rafts,” estimated to contain 20 to 100 cells (Fig. 5A and C). Also, due to the deposition of these clumped cells, large blue colonies on Simmons citrate agar from this broth were not clonal (data not shown). However, this clumping phenotype was reversible when cells were grown in LB broth (Fig. 5B and D). Therefore, to obtain stable, clonal, large blue colonies on Simmons citrate agar, presumptive Cit+ isolates required cycling growth through LB broth to mid-exponential phase, to reverse clumping and ensure clonal isolation. We found this purification step to be essential in the preparation of DNA for genomic sequencing.
FIG 5.

E. coli Cit+ mutants grew in clumps in M9C broth but not in LB broth. Results of phase-contrast microscopy comparing levels of growth of E. coli Cit+ mutants DV133 (A and B) and DV159 (C and D) in M9 (A and C) C and LB broth (B and D) are shown. Cells in M9C minimal medium were clumped, whereas growth in LB broth was dominated by single and predivisional cells. The pictures are representative of 10 microscopic fields; magnification, ×400.
Genetic and genomic DNA analyses of E. coli Cit+ phenotypes showed amplification of citT followed by promoter capture and dctA amplification.
Genomic DNA was prepared from four E. coli Cit+ isolates, DV130, DV133, DV133T, and DV159 (Table 1), and was sequenced using PacBio RS II sequencing technology. E. coli DV159 is an independent wild-type Cit+ isolate from an M9C direct selection. The other three strains represent staged isolates with respect to Cit+ refinement and were used to identify genetic changes at each stage. E. coli DV130 (ΔrpoS::kan background) displayed weak Cit+ activity evidenced by a long lag phase when placed in M9C and yellow colonies when grown on Simmons citrate agar. E. coli DV133 was derived from strain DV130 as a large-colony isolate from LRC agar. This refined Cit+ strain had a shorter lag phase in M9C than its DV130 parental strain and yielded blue colonies on Simmons citrate agar. Strain DV133T is the E. coli K-12 wild type that was transduced with P1(vir) grown on strain DV133 and selected for Cit+ in M9C broth. Like strain DV133, the DV133T transductant showed a strong Cit+ phenotype upon its initial isolation, indicating that the essential mutation for strong Cit+ utilization had been transduced. We reasoned that the genomic sequence of this strain in the wild-type background would facilitate identification of the mutation(s).
The read depth profile of the genome of strain DV130 showed 4-fold coverage of citT and 2-fold coverage of dctA above the normalized coverage of 100× for the rest of the chromosome, suggesting that these regions had undergone amplification (Fig. 6A). However, duplications in these regions were polished out by the software in the final assembly process. Analysis of individual “subreads” for citT showed tandem duplications (data not shown). The compiled genomic DNA sequence also showed a single-base-pair deletion in dctA, 26 nucleotides (nt) from the start of translation, 5 nt from the mutation identified by Quandt et al. (10) required for the refined Cit+ phenotype (data not shown). The read depth profile of strain DV133 likewise shows increased read depths for both citT and dctA, both at 2-fold coverage, suggesting a partial reduction in citT amplification compared to that seen with the DV130 parental strain (Fig. 6A). Importantly, the DNA sequence of citT shows that insI1, an IS30 transposase, had been inserted 5′ to the citT gene, a presumptive promoter capture (Fig. 6B). This insertion was not present in any of the DV130 subreads, indicating that this insertion event correlated with the switch between the potentiated Cit+ weak phenotype and the strong or refined Cit+ phenotype in strain DV133. This same insl1 is present in DV133T (Fig. 6B), indicating that this region was transduced into the E. coli wild-type strain and confirming its role in the strong or refined Cit+ phenotype. DV133T also shows an amplified dctA region of 140 kb generated by a recombination between rhsA and rhsB, genes that share homology and that bracket dctA at 79 min on the E. coli chromosome (Fig. 6C). There were no dctA point mutations in the gene or regulatory sequence.
FIG 6.

Genomic DNA sequence analysis of E. coli Cit+ phenotypes showed gene amplifications associated with dctA and citT regions and promoter captures. (A) The genomic read depth profiles of E. coli Cit+ isolates DV130, DV133, and DV133T. The weakly Cit+ phenotype of DV130 shows 4-fold-increased coverage of the citT region and 2-fold-increased coverage of dctA compared to the ∼100× coverage of the rest of the chromosome. (B) Strain DV133 was a strong Cit+ phenotype derived from DV130. It showed a 2-fold reduction in citT coverage compared to the parental DV130 strain and the insertion of insl1 5′ into citT. When the E. coli K-12 wild-type strain was transduced with a lysate made using DV133, the same insl1-citT fusion was identified, confirming that this promoter capture was responsible for the transduced strong Cit+ phenotype. The genomic sequence of Cit+ strain DV159 showed a citT duplication and deletion event that fused the promoter of uspG to citG, another promoter capture event. All read depth profiles show 2-fold-increased coverage for the dctA region compared to the ∼100× coverage for the chromosome. (C) Sequence analysis of DV133, DV133T, and DV159 showed recombination between rhsA and rhsB based on the differences in the positions of flanking genes yibF and yrhC. The genomic organization of the E. coli wild-type chromosome is represented by the top panel. The recombination of sister chromosomes to generate a large 140-kb duplication of this region is shown in the center panel. The gene map determined for both DV133 and DV159 is shown in the bottom panel with the dctA duplication.
To further verify that both citT and dctA had undergone amplification, we transduced DV133T with P1(vir) grown on strains JW0604-1 (ΔcitT::kan mutant) and JW3496 (ΔdctA::kan mutant). DV133T cells transduced with phage grown on strain JW0604-1 were plated on Christensen citrate Kn agar and were scored for Cit+. We found that 6 of 20 colonies were Knr and Cit+. DV133T cells transduced with phage grown on JW3496 showed that 3 of 10 colonies were Knr and Cit+. These results are compatible only with a gene duplication for both citT and dctA (22, 23).
We concluded that potentiation or actualization of Cit+ first requires amplification of citT as shown in strain DV130. This would potentiate access to citrate by a gene dosage effect. Refinement requires promoter capture that leads to higher aerobic expression of citT, as shown for DV130-derivative strains DV133 and DV133T and by amplification of dctA by recombination at a well-documented “hot spot” for chromosome duplications (24, 25).
Sequence analysis showed that strain DV159 with citT had undergone a duplication and a deletion to generate a fusion of citT with the neighboring uspG gene (Fig. 6B). The uspG gene is stress induced and expressed at extremely high levels during carbon starvation (26, 27). Sequence analysis also showed a similar amplification of a large 140-kb region of the chromosome containing dctA consistent with recombination between rhsA and rhsB, as determined in strain DV133T (Fig. 6C). No point mutation(s) in dctA or its regulatory region was detected in DV159. The genomic rearrangement identified in strain DV159 is analogous to that of the original Cit+ strain identified in the LTEE (11).
DISCUSSION
The most important finding of this work was that E. coli underwent rapid adaptation to aerobic citrate metabolism that was readily and repeatedly achieved using direct or modified direct selections. The genetic trajectory of this adaptation and the classes of mutations identified followed the same patterns of genetic events characterized in LTEE and centered on citT and dctA expression. Importantly, potentiated and actualized E. coli Cit+ strains were obtained in as few as 12 generations and refined phenotypes in fewer than 100 generations. Phenotypic and genetic analyses of these E. coli Cit+ strains provided insight into the mechanism for the adaptations and suggested why the LTEE took 33,000 generations to reach this phenotype. Also, this study provided a unique opportunity to compare the results of a direct selection with those of a long-term genetic screen. Finally, because this adaptation did not generate any new genetic information and required expanded expression of only two existing transporters (citT and dctA), generation of E. coli Cit+ phenotypes in our estimation does not warrant consideration as a speciation event. In fact, mutations in these two loci are sufficient for the LTEE Cit+ phenotype (10).
We obtained 46 independent E. coli Cit+ phenotypes that followed a similar staged trajectory from potentiation and actualization to refinement as defined by Lenski (10, 11). The emerging E. coli Cit+ strains, in analogy to the LTEE mutants, displayed long lag phases and weak utilization of citrate. Potentiation, in the LTEE, is undescribed due to the 33,000 generations of mutations that need to be analyzed. Because our E. coli Cit+ cells were recovered after a minimum of 12 generations, potentiation requires only citT amplification, as determined for strain DV130. Increased expression of the CitT transporter allowed minimal but sufficient access to citrate and a low level of cell division. Gene amplifications are the most common mutations identified (28) and set the stage for subsequent promoter capture recombinatorial events. Thus, Cit+ cells amplified for citT, such as the weakly Cit+ DV130 cells, transitioned by citT promoter capture and dctA amplification to DV133, the strongly Cit+ derivative. This combination was confirmed to be the only one required for changes by transducing this mutation into the E. coli K-12 wild-type strain to create DV133T.
A simple model emerges that explains the Cit+ mutants derived either by direct selection or by LTEE. Cells are potentiated by citT amplification (>4×) and actualized by subsequent chromosome remodeling to capture a promoter that allows aerobic citT expression. The number of copies of citT required for growth before this capture is high but afterwards is decreased (2×) to reduce the fitness cost of maintaining numerous citT gene copies. Finally, Cit+ refinement results when the DctA transporter is amplified (2×) to import succinate. The same mechanism, gene amplification, promoter capture, and subsequent reduction in gene copy number, was identified by Roth to explain the recovery of cryptic β-galactosidase expression by E. coli in Cairn's famous directed-mutagenesis experiments (29, 30). This mechanism also explains similar adaptation events in Salmonella (31, 32).
We do not, as yet, fully understand the dynamics of delayed onset of growth by Cit+ isolates after initial selection. Because spent media from E. coli Cit+ isolates overrode this lag phase in a dose-dependent manner, quorum sensing may play a subtle role in this process. However, a more likely explanation is the loss of C4 dicarboxylates (succinate) that accompanies citrate uptake by CitT. Potentiated E. coli cells would be growing on the equivalent of a two-carbon substrate. Delayed growth may reflect a needed threshold level of succinate in the medium before citrate can be efficiently metabolized. Also, since E. coli K-12 can grow on succinate, this molecule may support emergence of Cit+-dependent Cit−-competing phenotypes in the population as they scavenge this metabolite produced from Cit+ cells. Cit+ cells grow in M9C as large rafts of cell complexes. We speculate that these rafts include succinate-scavenging Cit- cells because blue colonies isolated from M9C broth on Simmons citrate agar yielded various phenotypes when repurified. For this reason, we found it necessary to cycle the initial Cit+ isolates through LB broth, to disperse the rafts and recover clonal isolates. In summary, it appeared that loss of succinate is a growth-limiting step at this adaptive stage.
Refinement of the E. coli Cit+ phenotypes in our experiments required the dctA C4-dicarboxylate (succinate) transporter. In all experiments, the E. coli ΔdctA::kan strains did not produce a Cit+ phenotype, with one exception, strain SO191. All genomic sequences of refined E. coli Cit+ isolates had amplification of dctA or a mutation in its regulatory region. In E. coli, expression of dctA is inhibited by glucose (catabolite repression) and normally does not occur until stationary phase (33). DctA regulates its own expression, and the deletion mutation, identified in a DV130 population, centers between the −10 promoter sequence and the translational ATG start site. This may derepress its expression, as seen with the dctA point mutation identified in the LTEE (10). Expression of dctA is also dependent on the two-component regulatory DcuSR system (34, 35). DctA directly interacts with DcuSR and forms a functional tripartite transporter/sensor that localizes at the cell poles and predivision sites (36). DctA polar localization does not occur in the absence of dcuS expression or in a dcuS deletion. E. coli possess three additional succinate transporters, DcuA, DcuB, and DcuC, which are also under DcuSR regulation (37, 38). These three transporters, like citT, are expressed under anaerobic conditions. We predict that recapture of succinate may occur via activation of any of these anaerobic succinate transporters and that mutants with mutations in their regulatory sequences provide three more potential routes to refinement of a Cit+ phenotype. Such mutants may represent a subset among our uncharacterized Cit+ isolates such as strain SO191. The latter strain was the only E. coli ΔdctA::kan mutant that became Cit+, which, remarkably, occurred after 134 days in stationary phase. The E. coli K-12 ΔdctA::kan mutant cannot utilize succinate under aerobic conditions. Preliminary characterization of the Cit+ SO191 strain showed that it retained Knr and the ability to grow on succinate, consistent with aerobic expression of another dicarboxylic acid transporter.
One unanticipated result was the repeated successful isolation of the E. coli ΔrpoS::kan Cit+ mutant strain. This strain was incorporated into our experiments as an intended negative control. We assumed that the RpoS stress response would be required for stress-induced mutations in starving cells. RpoS-dependent stress-induced point mutations and gene amplification occur by repair of double-stranded breaks and double-stranded ends. The former occurs as a consequence of the RpoS-controlled error-prone polymerase DinB causing nucleotide insertions, deletions, and base substitutions, and the latter occurs as a consequence of double-stranded end-initiated replication (39). RpoS-mediated stress response point mutations in chromosomes of starving E. coli cells have been reported to account for half of the base substitutions and frameshift mutations; thus, RpoS is considered to be essential for adaptation under starvation conditions (40). However, our results show that only gene amplification and recombination were required for generation of Cit+ mutants.
Our results explain why the LTEE led to production of a single Cit+ isolate. By design, the LTEE are open-ended experiments to track the evolution of 12 parallel E. coli cultures under controlled conditions. Aerobic citrate utilization was not a specified aim. The highly delayed evolution (33,000 generations) of Cit+ strains understandably gives the impression that this was a rare, innovative evolutionary event. Our studies highlight why it was not. The LTEE design and the use of E. coli REL606 account for the delayed emergence of a Cit+ isolate. First, potentiated and actualized cells were routinely diluted away by the LTEE daily 1:100 dilution transfers. Cells with an amplified citT gene had only a brief advantage in the use of citrate once glucose was expended and were likely lost with each daily dilution/transfer into fresh glucose-containing media due to the fitness cost of the maintenance of multiple gene copies. This dynamic was previously described for Salmonella gene amplifications (41). Gene amplification likely came to the steady state and did not reach a level that permitted the next step, the rarer promoter fusion event. Second, if actualized Cit+ cells did arise, they would have a long lag phase and would have difficulty outcompeting the well-adapted E. coli cells specialized for growth in the LTEE low-glucose concentrations. Our results showing more-rapid recovery of Cit+ mutants in glycerol than in glucose support the idea that slower cell division reduces the fitness cost of gene amplifications. Again, daily transfers to fresh glucose specifically select against slowly dividing mutants. Third, refined Cit+ mutants depend on the presence of DctA to recapture succinate. Normal expression of this transporter is repressed by glucose (catabolite repression), shows autorepression, and requires DcuRS, all conditions reached in stationary phase. Thus, access to succinate occurred only briefly between LTEE transfers. Fourth, the E. coli strain used, REL606, has a dcuS five-base-pair deletion that prevents dctA expression (10, 12, 42). This strain is defective in the very pathway required for competitive citrate utilization. This defect also explains why our short-term direct selection yielded actualized and not refined E. coli REL606 Cit+ cells. Thus, before citrate can be metabolized efficiently by this strain, an extra mutation to suppress this defect is required. Nonetheless, we predict that Cit+ mutations, even in REL606, might have occurred sooner and repeatedly in the LTEE protocol if the dcuS in this strain had been repaired, because then, only gene amplifications (citT and dctA) would be required, as we found to be the case.
The following three results support this reasoning about the dcuS defect: (i) we rapidly isolated Cit+ mutants in E. coli REL606 and another E. coli B strain; (ii) our characterized E. coli K-12 Cit+ mutants required only dctA duplication, a more common process than the dctA-specific point mutation required to suppress a dcuS defect; (iii) we isolated a Cit+ mutation in the E. coli K-12 ΔdctA::kan mutant, a strain phenotypically equivalent to the REL606 strain with a dcuS mutation (DctA negative), in 134 days. The pathway to the Cit+ phenotype with a defect in dctA expression does not require 33,000 generations of potentiating mutations. Interestingly, the time required for the LTEE Cit+ mutation to occur is predictable. The frequency of the occurrence of both amplification/promoter capture (citT) and a point mutation (dctA) in the same cell under nonselective conditions is on the order of 1 in 1014. This is almost exactly the number of cells Lenski screened to find Cit+ and the frequency Hall predicted for his Cit+ mutation (3, 14).
Our experiments also presented a unique opportunity to compare the results of a direct selection to the results of a long-term genetic screen. It is proposed that strong (direct) selection might drive an evolving population to a “quick fix rendering a better solution less accessible” (43). Our results suggest the converse is true. The E. coli Cit+ genomes sequenced from our direct selection experiments are equivalent to those corresponding to the amplification and promoter capture mutations identified in the LTEE (11). The requirement for dctA activation is also common to the two experiments. We conclude there is no significant difference between these experiments with respect to the E. coli solutions to aerobic citrate use. Isolation of a Cit+ mutant in a dctA deletion strain is indicative that direct selection led to an additional solution that has, as of now, not been identified in the LTEE. Because Cit+ E. coli REL606 has been identified in only 1 of the 12 parallel cultures of the LTEE, it may well be that a weak selection inhibits access to a “citrate-use solution.” Frozen fossils from the 12 LTEE cultures could be used to test this possibility. They could be revived and the experiments replayed from any generational landmark with longer incubations extended into deeper stationary phase, the selection conditions described by us, to determine if the pathway to citrate use has been preserved or lost among all 12 E. coli cultures.
In summary, E. coli can rapidly mutate to a Cit+ phenotype in a relatively short time if subjected to direct selection. This indicates that the 33,000 generations to potentiate the evolutionary resources for the Cit+ phenotype do not reflect a direct requirement but merely experimental conditions. As such, Cit+ mutants exemplify the adaptation capability of microorganisms but, as of yet, the LTEE has not substantiated evolution in the broader sense by generation of new genetic information, i.e., a gene with a new function. Interestingly, our findings parallel the conclusions from bacterial starvation studies by Zinser and Kolter (44) in which E. coli adaptations were dominated by changes in the regulation of preexisting gene activities rather than by the generation of new gene activities, de novo. The LTEE isolation of Cit+ mutants has become a textbook example of the power of long-term evolution to generate new species. But, based on our results, E. coli arrives at the same solution to access citrate in days versus years, as originally shown by Hall (14). In either case, genes involved in the process maintain their same function but show expanded expression by deregulation. Because of this, we argue that this is not speciation any more than is the case with any other regulatory mutant of E. coli. A more accurate, albeit controversial, interpretation of the LTEE is that E. coli's capacity to evolve is more limited than currently assumed.
ACKNOWLEDGMENTS
We thank Derek Pouchnik and Mark Wildung (Washington State University genomics core laboratory) and Robert Sebra (Icahn School of Medicine core genomics laboratory) for providing sequencing services, Jonas Korlach (Pacific Biosciences) for assistance in genomic DNA sequence analysis and identification of gene duplications, and Lee Deobald (University of Idaho) for mass spectrometry assistance. We also thank Patricia L. Hartzell (University of Idaho) and Patrick J. Hrdlicka (University of Idaho) for valuable discussions during this investigation.
This work was supported by the University of Idaho Agricultural Experiment Station Hatch projects under award numbers IDA01467 (C.J.H.) and IDA01406 (S.A.M.) and by the National Institutes of Health under award number P20GM103408 (C.J.H. and S.A.M.).
The funders had no role in study design, data collection, interpretation, or the decision to submit the work for publication.
REFERENCES
- 1.Adams J, Rosenzweig F. 2014. Experimental microbial evolution: history and conceptual underpinnings. Genomics 104:393–398. doi: 10.1016/j.ygeno.2014.10.004. [DOI] [PubMed] [Google Scholar]
- 2.Lenski RE, Rose MR, Simpson SC, Tadler SC. 1991. Long-term experimental evolution in Escherichia coli. I. Adaptation and divergence during 2,000 generations. Am Nat 138:1315–1341. [Google Scholar]
- 3.Pennisi E. 2013. The man who bottled evolution. Science 342:790–793. doi: 10.1126/science.342.6160.790. [DOI] [PubMed] [Google Scholar]
- 4.Blount ZD, Borland CZ, Lenski RE. 2008. Historical contingency and the evolution of a key innovation in an experimental population of Escherichia coli. Proc Natl Acad Sci U S A 105:7899–7906. doi: 10.1073/pnas.0803151105. [DOI] [PMC free article] [PubMed] [Google Scholar]
- 5.Koser SA. 1923. Utilization of the salts of organic acids by the colon-aerogenes group. J Bacteriol 8:493–520. [DOI] [PMC free article] [PubMed] [Google Scholar]
- 6.Koser SA. 1924. Correlation of citrate utilization by members of the colon-aerogenes group with other differential characteristics and with habitat. J Bacteriol 9:59–77. [DOI] [PMC free article] [PubMed] [Google Scholar]
- 7.Vaughn RH, Osborne JT, Wedding GT, Tabachnick J, Beisel CG, Braxton T. 1950. The utilization of citrate by Escherichia coli. J Bacteriol 60:119–127. [DOI] [PMC free article] [PubMed] [Google Scholar]
- 8.Lütgens M, Gottschalk G. 1980. Why a co-substrate is required for anaerobic growth of Escherichia coli on citrate. J Gen Microbiol 119:63–70. [DOI] [PubMed] [Google Scholar]
- 9.Garrity G, Brenner DJ, Krieg NR, Staley JR. 2005. Bergey's manual of systematic bacteriology, vol 2: the proteobacteria, part B: the gammaproteobacteria. Springer, New York, NY, USA. [Google Scholar]
- 10.Quandt EM, Deatherage DE, Ellington AD, Georgiou G, Barrick JE. 2014. Recursive genomewide recombination and sequencing reveals a key refinement step in the evolution of a metabolic innovation in Escherichia coli. Proc Natl Acad Sci U S A 111:2217–2222. doi: 10.1073/pnas.1314561111. [DOI] [PMC free article] [PubMed] [Google Scholar]
- 11.Blount ZD, Barrick JE, Davidson CJ, Lenski RE. 2012. Genomic analysis of a key innovation in an experimental Escherichia coli population. Nature 489:513–518. doi: 10.1038/nature11514. [DOI] [PMC free article] [PubMed] [Google Scholar]
- 12.Turner CB, Blount ZD, Mitchell DH, Lenski RE. 2015. Evolution and coexistence in response to a key innovation in a long-term evolution experiment with Escherichia coli. bioRxiv doi: 10.1101/020958. [DOI] [PMC free article] [PubMed] [Google Scholar]
- 13.Lenski RE. 2011. Evolution in action: a 50,000-generation salute to Charles Darwin. Microbe 6:30–33. [Google Scholar]
- 14.Hall BG. 1982. Chromosomal mutation for citrate utilization by Escherichia coli K-12. J Bacteriol 151:269–273. [DOI] [PMC free article] [PubMed] [Google Scholar]
- 15.Paliy O, Gunasekera TS. 2007. Growth of E. coli BL21 in minimal media with different gluconeogenic carbon sources and salt contents. Appl Microbiol Biotechnol 73:1169–1172. [DOI] [PubMed] [Google Scholar]
- 16.Feng PC, Hartman PA. 1982. Fluorogenic assays for immediate confirmation of Escherichia coli. Appl Environ Microbiol 43:1320–1329. [DOI] [PMC free article] [PubMed] [Google Scholar]
- 17.Lennox ES. 1955. Transduction of linked genetic characters of the host by bacteriophage P1. Virology 1:190–206. doi: 10.1016/0042-6822(55)90016-7. [DOI] [PubMed] [Google Scholar]
- 18.Ausubel FM. 1987. Current protocols in molecular biology. J Wiley, Brooklyn, NY. [Google Scholar]
- 19.Greenberg EP, Hastings JW, Ulitzer S. 1979. Induction of luciferase synthesis in Beneckea harveyi by other marine bacteria. Arch Microbiol 120:87–91. doi: 10.1007/BF00409093. [DOI] [Google Scholar]
- 20.Bassler BL, Greenberg EP, Stevens AM. 1997. Cross-species induction of luminescence in the quorum-sensing bacterium Vibrio harveyi. J Bacteriol 179:4043–4045. [DOI] [PMC free article] [PubMed] [Google Scholar]
- 21.Wall JD, Harriman PD. 1974. Phage P1 mutants with altered transducing abilities for Escherichia coli. Virology 59:532–544. doi: 10.1016/0042-6822(74)90463-2. [DOI] [PubMed] [Google Scholar]
- 22.Anderson P, Roth J. 1981. Spontaneous tandem genetic duplications in Salmonella typhimurium arise by unequal recombination between rRNA (rrn) cistrons. Proc Natl Acad Sci U S A 78:3113–3117. doi: 10.1073/pnas.78.5.3113. [DOI] [PMC free article] [PubMed] [Google Scholar]
- 23.Sonti RV, Roth JR. 1989. Role of gene duplications in the adaptation of Salmonella typhimurium to growth on limiting carbon sources. Genetics 123:19–28. [DOI] [PMC free article] [PubMed] [Google Scholar]
- 24.Lin RJ, Capage M, Hill CW. 1984. A repetitive DNA sequence, rhs, responsible for duplications within the Escherichia coli K-12 chromosome. J Mol Biol 177:1–18. doi: 10.1016/0022-2836(84)90054-8. [DOI] [PubMed] [Google Scholar]
- 25.Petes TD, Hill CW. 1988. Recombination between repeated genes in microorganisms. Annu Rev Genet 22:147–168. doi: 10.1146/annurev.ge.22.120188.001051. [DOI] [PubMed] [Google Scholar]
- 26.Bochkareva ES, Girshovich AS, Bibi E. 2002. Identification and characterization of the Escherichia coli stress protein UP12, a putative in vivo substrate of GroEL. Eur J Biochem 269:3032–3040. doi: 10.1046/j.1432-1033.2002.02978.x. [DOI] [PubMed] [Google Scholar]
- 27.Kvint K, Nachin L, Diez A, Nyström T. 2003. The bacterial universal stress protein: function and regulation. Curr Opin Microbiol 6:140–145. doi: 10.1016/S1369-5274(03)00025-0. [DOI] [PubMed] [Google Scholar]
- 28.Reams AB, Kofoid E, Kugelberg E, Roth JR. 2012. Multiple pathways of duplication formation with and without recombination (RecA) in Salmonella enterica. Genetics 192:397–415. doi: 10.1534/genetics.112.142570. [DOI] [PMC free article] [PubMed] [Google Scholar]
- 29.Cairns J, Overbaugh J, Miller S. 1988. The origin of mutants. Nature 335:142–145. doi: 10.1038/335142a0. [DOI] [PubMed] [Google Scholar]
- 30.Reams AB, Roth JR. 2015. Mechanisms of gene duplication and amplification. Cold Spring Harb Perspect Biol 7:a016592. doi: 10.1101/cshperspect.a016592. [DOI] [PMC free article] [PubMed] [Google Scholar]
- 31.Kugelberg E, Kofoid E, Reams AB, Andersson DI, Roth JR. 2006. Multiple pathways of selected gene amplification during adaptive mutation. Proc Natl Acad Sci U S A 103:17319–17324. doi: 10.1073/pnas.0608309103. [DOI] [PMC free article] [PubMed] [Google Scholar]
- 32.Kugelberg E, Kofoid E, Andersson DI, Lu Y, Mellor J, Roth FP, Roth JR. 2010. The tandem inversion duplication in Salmonella enterica: selection drives unstable precursors to final mutation types. Genetics 185:65–80. doi: 10.1534/genetics.110.114074. [DOI] [PMC free article] [PubMed] [Google Scholar]
- 33.Davies SJ, Golby P, Omrani D, Broad SA, Harrington VL, Guest JR, Kelly DJ, Andrews SC. 1999. Inactivation and regulation of the aerobic C(4)-dicarboxylate transport (dctA) gene of Escherichia coli. J Bacteriol 181:5624–5635. [DOI] [PMC free article] [PubMed] [Google Scholar]
- 34.Witan J, Monzel C, Scheu PD, Unden G. 2012. The sensor kinase DcuS of Escherichia coli: two stimulus input sites and a merged signal pathway in the DctA/DcuS sensor unit. Biol Chem 393:1291–1297. [DOI] [PubMed] [Google Scholar]
- 35.Witan J, Bauer J, Wittig I, Steinmetz PA, Erker W, Unden G. 2012. Interaction of the Escherichia coli transporter DctA with the sensor kinase DcuS: presence of functional DctA/DcuS sensor units. Mol Microbiol 85:846–861. doi: 10.1111/j.1365-2958.2012.08143.x. [DOI] [PubMed] [Google Scholar]
- 36.Scheu PD, Steinmetz PA, Dempwolff F, Graumann PL, Unden G. 2014. Polar localization of a tripartite complex of the two-component system DcuS/DcuR and the transporter DctA in Escherichia coli depends on the sensor kinase DcuS. PLoS One 9:e115534. doi: 10.1371/journal.pone.0115534. [DOI] [PMC free article] [PubMed] [Google Scholar]
- 37.Zientz E, Six S, Unden G. 1996. Identification of a third secondary carrier (DcuC) for anaerobic C4-dicarboxylate transport in Escherichia coli: roles of the three Dcu carriers in uptake and exchange. J Bacteriol 178:7241–7247. [DOI] [PMC free article] [PubMed] [Google Scholar]
- 38.Janausch I, Kim O, Unden G. 2001. DctA- and Dcu-independent transport of succinate in Escherichia coli: contribution of diffusion and of alternative carriers. Arch Microbiol 176:224–230. doi: 10.1007/s002030100317. [DOI] [PubMed] [Google Scholar]
- 39.Hersh MN, Ponder RG, Hastings PJ, Rosenberg SM. 2004. Adaptive mutation and amplification in Escherichia coli: two pathways of genome adaptation under stress. Res Microbiol 155:352–359. doi: 10.1016/j.resmic.2004.01.020. [DOI] [PubMed] [Google Scholar]
- 40.Galhardo RS, Hastings PJ, Rosenberg SM. 2007. Mutation as a stress response and the regulation of evolvability. Crit Rev Biochem Mol Biol 42:399–435. doi: 10.1080/10409230701648502. [DOI] [PMC free article] [PubMed] [Google Scholar]
- 41.Reams AB, Kofoid E, Savageau M, Roth JR. 2010. Duplication frequency in a population of Salmonella enterica rapidly approaches steady state with or without recombination. Genetics 184:1077–1094. doi: 10.1534/genetics.109.111963. [DOI] [PMC free article] [PubMed] [Google Scholar]
- 42.Yoon SH, Han MJ, Jeong H, Lee CH, Xia XX, Lee DH, Shim JH, Lee SY, Oh TK, Kim JF. 2012. Comparative multi-omics systems analysis of Escherichia coli strains B and K-12. Genome Biol 13:R37. doi: 10.1186/gb-2012-13-5-r37. [DOI] [PMC free article] [PubMed] [Google Scholar]
- 43.Barrick JE, Lenski RE. 2013. Genome dynamics during experimental evolution. Nat Rev Genet 14:827–839. doi: 10.1038/nrg3564. [DOI] [PMC free article] [PubMed] [Google Scholar]
- 44.Zinser ER, Kolter R. 2004. Escherichia coli evolution during stationary phase. Res Microbiol 155:328–336. doi: 10.1016/j.resmic.2004.01.014. [DOI] [PubMed] [Google Scholar]