

Abstract
Subcutaneous xenografts have been used for decades to study hepatocellular carcinoma (HCC). These models do not reproduce the specific pathophysiological features of HCCs, which occur in cirrhotic livers that show pronounced necroinflammation, abnormal angiogenesis and extensive fibrosis. As these features are crucial for studying the role of the pathologic host microenvironment in tumor initiation, progression and treatment response, alternative HCC models are desirable. Here we describe a syngeneic orthotopic HCC model in immunocompetent mice with liver cirrhosis induced by carbon tetrachloride (CCl4) that recapitulates key features of human HCC. Induction of substantial hepatic fibrosis requires 12 weeks of CCl4 administration. Intrahepatic implantation of mouse HCC cell lines requires 30 min per mouse. Tumor growth varies by tumor cell line and mouse strain used. Alternatively, tumors can be induced in a genetically engineered mouse model. In this setting, CCl4 is administered for 12 weeks after tail-vein injection of Cre-expressing adenovirus (adeno-Cre) in Stk4−/−Stk3F/− (also known as Mst1−/−Mst2F/−; F indicates a floxed allele) mice, and it results in the development of HCC tumors (hepatocarcinogenesis) concomitantly with liver cirrhosis.
INTRODUCTION
HCC represents the second most common cause of cancer-related death worldwide1. HCC occurs almost exclusively in patients with liver cirrhosis2, thus underlying the important roles of the proinflammatory, angiogenic and profibrotic microenvironment in the cirrhotic liver for hepatocarcinogenesis3,4. The degree of liver fibrosis also affects the feasibility and efficacy of systemic therapies because of impaired drug delivery, altered metabolism, liver dysfunction and changes in hepatic perfusion5,6. In addition, fibrosis and cirrhosis modulate the interactions between cancer cells and extracellular matrix in HCC. Finally, the response of cancer and stromal cells—e.g., tumor-associated macrophages or cancer-associated fibroblasts—to pharmacologic agents is likely to be different in cirrhotic livers compared with that in healthy livers or subcutaneous space because of different local cues and cell origins7. As most cases of HCC (~80%) develop in a cirrhotic liver, current staging algorithms for HCC8 acknowledge the important prognostic role of the severity of liver cirrhosis and the impact of the underlying liver disease on the efficacy and safety of current treatments. Thus, the severity of underlying fibrosis influences treatment decisions in patients with HCC, and this is reflected by current practice guidelines9.
Nevertheless, the mechanisms by which the proinflammatory and profibrotic liver microenvironment regulate HCC growth and progression or affect HCC response to systemic therapy remain poorly understood4. In part, this is due to a paucity of in vivo models for studying HCC occurring with underlying liver cirrhosis. Thus, clinically relevant animal models of HCC recapitulating the pathologic microenvironment of the cirrhotic liver are required to promote the development of novel systemic therapies10. We have developed a syngeneic, orthotopic model of HCC in immunocompetent mice with underlying liver cirrhosis7,11. This model is potentially useful for studying various biological aspects of HCC, including cancer cell proliferation, apoptosis, epigenetics, metabolism, treatment resistance, angiogenesis, metastasis, tumor microenvironment and efficacy of novel therapeutic approaches.
Comparison with other mouse and human HCC xenograft models
Because of its size, breeding capacity, physiologic and molecular similarities to human biology, and available technology of gene targeting, the laboratory mouse (Mus musculus) often represents the model of choice in cancer biology. Mouse models of cancer include syngeneic grafts, xenografts, chemically induced, and transgenic or genetically engineered models (GEMs).
Xenograft models
For experimental HCC studies, a widely used model is subcutaneous injection of human HCC cell lines in immunodeficient mice, usually athymic nude or severe combined immunodeficient (SCID) mice12. Such xenograft models may be useful for certain studies of cancer cell behavior during tumor progression. However, this approach has some key drawbacks: it does not reproduce critical tumor-stroma interactions in HCC, and it does not allow studies of spontaneous development of distant or local (intrahepatic) metastases. To overcome these limitations, a strategy developed by several groups has been to use orthotopic (intrahepatic) patient-derived xenografts (PDXs) from HCC patients in immunodeficient mice13. In addition to growing in the orthotopic location, the PDX tumor occasionally shows distant metastases13. However, the utility of PDX HCC models is greatly limited by the dysfunctional or absent immune responses.
Carcinogen-induced models
In other models, HCC is induced in immunocompetent mice using carcinogens—such as diethylnitrosamine (DEN)—to overcome the limitation of immunodeficiency and lack of heterogeneity. However, the time to tumor formation and tumor sizes can vary substantially depending on the mouse strain, and often multiple tumor lesions may develop. Thus, chemically induced models are difficult to standardize, which results in difficulties in designing and performing experiments, particularly for testing the therapeutic efficacy of new agents. Most importantly, none of these models recapitulates the pathological host environment of a cirrhotic liver that is present in most cases of human HCCs.
Transgenic models
Transgenic models or GEMs of HCC are widely considered the state of the art. They include hepatocyte-specific models (using the albumin promoter) of Myc (also known as c-Myc)14 and astrocyte-elevated gene-1 (officially known as Mtdh, also known as AEG-1)15. In GEMs with dual (albumin-driven) Mtdh and Myc overexpression, mice developed aggressive HCCs, as well as lung metastases16. Moreover, diethylnitrosamine treatment substantially accelerated hepatocarcinogenesis in albumin promoter–driven Mtdh/Myc–overexpressing mice16.
CRISPR-Cas models
Another novel technique to induce HCC tumors in wild-type mice uses hydrodynamic injections of clustered regularly interspaced short palindromic repeats (CRISPRs) and CRISPR-associated (Cas) proteins. This CRISPR-Cas technology delivers single-guide RNAs to target tumor-suppressor genes (such as Pten or Trp53 (also known as p53)) or the Ctnnb1 oncogene. This technique enables direct mutations of tumor suppressors or oncogenes in order to study functional genomics in HCC. Stauffer et al.17 showed that coactivation of AKT and β-catenin in mice rapidly induces the formation of lipogenic liver tumors. These authors used hydrodynamic injections to deliver activated AKT and β-catenin for the initiation of hepatocarcinogenesis. This model resulted in hepatic adenomas, and after in vivo passage these adenoma cells formed α-fetoprotein– and CD133-expressing HCC tumors. This mouse HCC model was developed from the steatotic-neoplastic transformation of hepatocytes, which mimics the microenvironment in human diet-induced or metabolic-induced HCC in patients with fatty liver disease. This model of HCC in steatotic liver is a reproducible and rapid transgenic model that provides insights into the intrinsic molecular mechanism involved in early tumorigenesis. However, it lacks pronounced fibrosis that is found in human nonalcoholic steatohepatitis (NASH) cirrhosis, in which HCC tumors usually follow the sequential development of hepatic steatosis, inflammatory fatty liver disease, fibrosis and NASH cirrhosis, and HCC. Thus, this model recapitulates human HCC in a noncirrhotic fatty liver disease background.
Adenovirus models
Another hepatocyte-specific HCC model induces oncogenic simian vacuolating virus 40 (SV40) large T antigen via adenovirus transfer, and this model has been used to investigate antigen-specific tolerance18.
Metabolic models
Finally, Wolf et al.19 showed that metabolic activation of intrahepatic CD8+ T cells and natural killer (NK) T cells causes NASH and eventually HCC. HCC was established after 12 months of long-term exposure to a choline-deficient high-fat diet.
Although all these elegant models recapitulate spontaneous carcinogenesis, the mice show only mild fibrosis and do not display underlying liver cirrhosis. Although concomitant administration of CCl4 or thioacetamide might be feasible in these models to create a cirrhotic background, this remains to be demonstrated.
Experimental design
Here we describe a protocol for developing preclinical mouse models of orthotopic HCC in mice with underlying liver cirrhosis. This model can be established using implantation of syngeneic mouse HCC cell lines or by induction of hepatocarcinogenesis in GEMs, such as Stk4−/−Stk3F/− mice7,20. This GEM is a model of yes-associated protein 1 (Yap1) oncogene-driven carcinogenesis, which is a relevant driver of HCC21,22. Both strains of mice used in this protocol—C3H mice and Stk4−/−Stk3F/− mice—have intact immune systems, which allows studies of immune responses in HCC11,23. The setting of carcinogenesis within a cirrhotic liver tissue provides a clinically relevant model, which recapitulates key features of human HCC progression7,11. Thus, these models provide a unique platform to study HCC-stroma interactions and to perform treatment efficacy studies in an inducible and reproducible model of HCC7,11.
The rationale for developing and using this orthotopic mouse HCC model in fibrotic liver is based on previous studies from our laboratory, and those of others, which have demonstrated an important role for tumor stroma in HCC and other tumors3,7,10,11. Previous studies have revealed that inflammatory cells, integrin signaling, growth factor secretion and interactions, and communication between activated hepatic stellate cells and tumor cells in a fibrotic tumor microenvironment all contribute to tumor progression in HCC24,25. As discussed in the following section, the protocol can be used to establish clinically relevant mouse HCC models for various experimental studies. The protocol includes three main sections: induction of liver fibrosis/cirrhosis in the liver of C3H mice (Steps 1–10); HCC tumor cell implantation in the fibrotic/cirrhotic liver of C3H mice (Steps 11–42; Supplementary Video 1); and simultaneous fibrosis and tumor induction in the Stk4−/−Stk3F/− GEM (Box 1). Figure 1 summarizes these experimental procedures.
Box 1. Liver cirrhosis induction in Stk4−/−Stk3F/− HCC mice ● TIMING 12 weeks.
Weigh Stk4−/−Stk3F/− mice to record body weight at baseline.
-
Intravenously inject 200 µl of phosphate-buffered adeno-Cre (1 × 10⁸ p.f.u.) into the tail vein of Stk4−/−Stk3F/− mice aged 4–5 weeks.
? TROUBLESHOOTING
Start fibrosis induction (or olive oil/vehicle administration) 1 week after adeno-Cre injection, as described in Steps 1–8.
Continue fibrosis induction by administration of CCl4 20% (vol/vol) gavage solution (or olive oil/vehicle) three times per week for 12 weeks, as described in Steps 9–10.
Closely monitor the mice for tumor progression and general condition.
Figure 1.

Experimental design. (a,b) Timeline of HCC development and cirrhosis induction by carbon tetrachloride (CCl4) administration: at least 12 weeks are required to set up the model. Tumors can be concomitantly induced either by orthotopic implantation—for example, of HCA-1 cells in C3H mice after cirrhosis induction (see a, main PROCEDURE)—or by using a genetic model, e.g., using Stk4−/−Stk3F/− mice injected with Cre-adenovirus to induce hepatocarcinogenesis (b, Box 1). Institutional regulatory board permission was obtained from the Massachusetts General Hospital Institutional Animal Care and Use Committee (MGH IACUC) for all procedures performed within this protocol.
Strains of mice
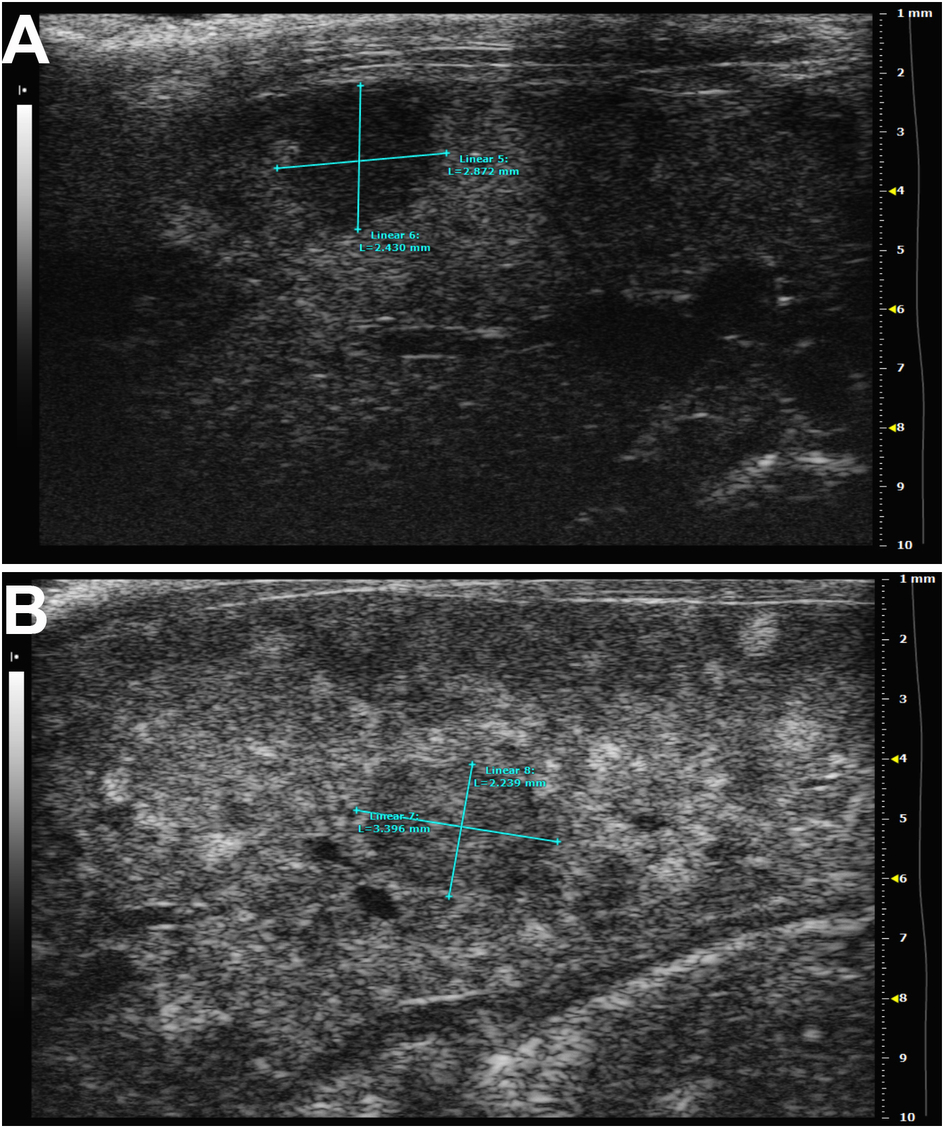
C3H mice and Stk4−/−Stk3F/− mice should be kept under pathogen-free conditions to maintain overall health of mice, to control diseases and to prevent infection outbreak. Our group developed and described Stk4−/−Stk3F/− mice; see Zhou et al.20. Alternatively, mice with double-floxed mutations of both Stk4 and Stk3 in hepatocytes have been developed, and they are available from Jackson Laboratory (stock no. 017635; ref. 26). During fibrosis induction (CCl4 administration), after Cre-adenovirus injection and after orthotopic tumor implantation, mice should be monitored daily for signs of illness by measuring body weight and by checking general condition and vital signs. Small-animal ultrasound can be used to noninvasively monitor HCC tumor uptake and growth in the liver longitudinally over time (Supplementary Fig. 1). All animals must receive humane care according to the criteria outlined in the US National Institutes of Health (NIH) guide for the care and use of laboratory animals27. Tumors derived from mouse HCC cell injections into livers are established as a syngeneic mouse model 7–10 d after implantation. The HCC tumor uptake rate can vary by tumor cell line and mouse strain used. The mouse HCA-1 cell line consistently establishes hepatic tumors in >95% of implanted C3H mice7,11.
Considerations for sample calculation and control groups
It is important to plan your experiment in order to obtain a sufficient number of mice per group, especially if your expected difference in the respective readout (e.g., tumor size) is small.
A sample calculation for a typical treatment testing in the cirrhotic HCA-1 model is as follows:
An experimental group size that usually allows the detection of potential statistically differences in tumor size between different treatments is n = 8 mice per group. For example, there are three treatment groups: control group treated with vehicle or placebo, standard therapy (e.g., sorafenib) and experimental therapy.
Consider a potential dropout rate during fibrosis induction (usually <2% in male C3H mice, but it is better to calculate it at a conservative rate of 5%).
Consider an HCA-1 tumor uptake rate of 90% in orthotopic graft.
In this case, 8 mice × 3 groups × 1.05 (5% dropout during fibrosis induction) × 1.10 (90% tumor uptake rate) = 28 mice.
A sample calculation for a typical experiment for the cirrhotic Stk4/Stk3-mutant model is as follows:
An experimental group size that usually allows the detection of potential statistically differences in tumor size between different treatments is n = 8 mice per group. For example, there are three treatment groups: control group treated with vehicle or placebo, standard therapy (e.g., sorafenib) and experimental therapy.
Consider a potential dropout rate during fibrosis induction (up to 5% in Stk4/Stk3-mutant mice).
Stk4/Stk3-mutant HCC tumor incidence rate after successful adeno-Cre tail-vein injection is 100%.
In this case, 8 mice × 3 groups × 1.05 (5% dropout during fibrosis induction) = 26 mice.
During fibrosis induction, mice administered with a similar amount (volume) of olive oil (which we use as a vehicle for CCl4) comprise the control group. The control group of mice for tumor studies should receive orthotopic liver injections of a similar volume (20 µl) of Matrigel to exclude a potential effect of the surgical procedure and to assess the potential toxicity of experimental drugs in cirrhotic mice (without tumors). A group of Stk4−/−Stk3F/−mice should be injected with PBS instead of adeno-Cre.
Considerations about costs and time effort
The models described in this protocol have a high cost in terms of reagents and surgical expertise, and they require long induction times—CCl4 administration to induce fibrosis takes 12 weeks and adeno-Cre injections for HCC formation take 8 weeks. Together with a typical treatment-testing period of 3–4 weeks, the timeline for an experiment could extend up to 5–6 months. Cost calculations for these models must thus also consider animal housing during this time frame. In addition, the time effort and expertise needed for animal handling and surgery must be considered.
Mouse HCC cell lines
Various human HCC cancer cell lines have been established for the development of xenograft models in immunodeficient mice. However, few cell lines are available for syngeneic mice. The illustrative data that we show here use the C3H mouse–derived HCC cell line HCA-1 to establish the orthotopic HCC model7,11. HCA-1 cells were cultured using DMEM culture medium supplemented with 10% (vol/vol) FBS, and they were regularly checked for mycoplasma contamination to avoid artificial results from animal infection. In general, a single intrahepatic implantation of 1 × 10⁶ HCA-1 cells is sufficient to result in tumor formation in C3H mice.
Induction of liver fibrosis or cirrhosis in mice (Steps 1–10)
Liver cirrhosis results from repeated liver damage and chronic inflammation, which leads to the massive deposition of extracellular matrix (mainly collagen) and the formation of scar tissue (septa) in the liver. To model this clinical feature of HCC, we use repetitive CCl4 exposure to induce liver fibrosis in mice. CCl4 is orally administered to 5–6-week-old male C3H or Stk4−/−Stk3F/− mice (CCl4, 20% (vol/vol) in olive oil, 150-µl gavage, three times per week) before orthotopic tumor implantation or after adeno-Cre injection. We found the formation of excess fibrous connective tissue and collagen deposition after 8 weeks of CCl4 administration (recapitulating human F2 fibrosis stage according to the Meta-analysis of Histological Data in Viral Hepatitis (METAVIR) fibrosis scoring system28). Established cirrhosis (thick bridging septa, recapitulation of human METAVIR F4 stage cirrhosis) was observed after 12 weeks of repetitive CCl4 administration (Fig. 2). These tumor stromal features are not seen in HCCs developing in Stk4−/−Stk3F/− mice without concomitant CCl4 administration. Thus, CCl4 administration after Cre-adenovirus injection is required to induce cirrhosis concomitantly with carcinogenesis in Stk4−/−Stk3F/− mice.
Figure 2.

Microscopic appearance of hepatocellular carcinoma in mice with cirrhotic liver. (a) Immunofluorescence staining of collagen I in mice with liver cirrhosis (Laennec 4 score) after 12 weeks of CCl4 treatment. In blue, DAPI cell nuclear counterstaining. (b,c) Masson’s trichrome staining of liver tissue from C3H (b) or Stk-mutant (c) mice with cirrhosis. (d,e) Representative images of CD8+ T lymphocyte infiltration (green, anti-CD8 antibody) in HCA-1 (d) and Stk-mutant tumors (e) with DAPI (VECTASHIELD) for nuclear counterstaining, in blue. Institutional regulatory board permission from MGH IACUC was obtained for all procedures performed within this protocol.
Orthotopic tumor implantation in cirrhotic livers (Steps 32–35)
HCA-1 cells are directly implanted in C3H mice with liver cirrhosis induced by 12 weeks of CCl4 treatment (Figs. 1 and 3). Small-volume suspensions containing HCA-1 cells and Matrigel are injected into the subcapsular region of the liver parenchyma in the median lobe. Typically, we suspend 10,000,000 cells in 200 µl of serum-free medium. Directly before injection, we mix the cell suspension at a 1:1 (vol/vol) ratio with Matrigel in a small tube to increase the viscosity of the injected cell suspension. Small 0.5-ml syringes with 28.5-gauge needles are used to inject the cell/Matrigel suspension. To avoid leakage of tumor cells from the injection site—which might lead to local spread and ‘seeding’ metastasis in the peritoneal cavity—we limit the injected volume to 20–30 µl. A steady and slow injection should be performed to prevent leakage of the injected cell suspension and to minimize the damage of the surrounding liver tissue. After removal of the needle, the liver surface at the site of needle tract should be covered with Gelfoam for 5 min to minimize bleeding and potential backflow/leakage.
Figure 3.

Surgical procedure for intrahepatic HCC graft implantation. (a) Median skin incision. (b) Median muscle layer incision and exposure of the xyphoid process. (c) Exposure of the median liver lobe and resection of the xyphoid process. (d) Exteriorization of the median liver lobe using a moist sterile cotton swab. (e) Covering of the median liver lobe (injection site with Gelfoam). (f) Insertion of the needle and injection of 20 µl of HCC cell/Matrigel solution in the subcapsular region. (g) Inspection of the injection site and relocation of the median liver lobe in the peritoneal cavity by removing the sterile cotton swab. (h) Closure of the muscle layer by a continuous suture. Institutional regulatory board permission was obtained for all procedures performed within this protocol from MGH IACUC.
Alternative approaches to intrahepatic cancer cell implantation
Lee et al.29 have described a percutaneous ultrasound-guided approach to inoculate Vx-2 carcinoma cells in the liver of rabbits. This technique resulted in a high success rate (100%) and was less invasive than an open laparotomy method. However, tumor seeding occurred more often (20.8%) in the ultrasound-guided approach than in their laparotomy controls (8.3%). In addition, there was thoracoabdominal cancer cell seeding in 20.8% of cases, and also in the peritoneal cavity in 8.3% of the cases29. A percutaneous technique has been previously described for the inoculation of human hepatocytes in immunodeficient mice30. However, although an ultrasound-guided (less invasive) approach might also be possible for cancer cell inoculation in mice, it carries the important risk of peritoneal seeding at the time of inoculation, which could compromise the experiment.
Cirrhosis induction in the Stk4−/−Stk3F/− GEM
To induce the homozygous Stk4/3 knockout, we inject adeno-Cre into tail veins of 4–5-week-old male or female Stk4−/−Stk3F/− mice to trigger liver-selective deletion of Stk3 (ref. 20). Because female Stk4−/−Stk3F/− mice are smaller and are more susceptible to fibrosis induction, we recommend using only one gender within one experiment or using a balanced male/female ratio between the experimental groups. Next, cirrhosis is induced in male Stk4−/−Stk3F/− mice using iterative CCl4 gavaging (three times a week; Fig. 1). For comparison, Stk4−/−Stk3F/− mice were only injected with adeno-Cre without fibrosis induction or only administered with CCl4 without adeno-Cre virus injection (Box 1).
Alternative approaches to induce liver fibrosis or cirrhosis in mice
Common alternative methods to induce liver fibrosis and cirrhosis in mice include the following: (i) common bile duct ligation (CBDL), a surgical model of secondary biliary cirrhosis in which the common bile duct is double ligated and resected, thus causing secondary biliary cirrhosis after 5–8 weeks; and (ii) chronic thioacetamide (TAA) administration, usually injected intraperitoneally twice or three times a week. It is noteworthy that the CBDL cirrhosis model is associated with high morbidity, and thus it might be difficult to use it in conjunction with additional interventions such as orthotopic tumor cell implantation surgery and long-term drug treatments in mice.
Monitoring orthotopic liver tumor growth in mice
The orthotopic nature of this model does not allow direct monitoring of tumor growth or size. Besides ultrasound, which is described in this protocol, there are other imaging options such as microcomputerized tomography (microCT) or MRI that could be used for this purpose if expertise and resources are available. An inexpensive but invasive alternative is to surgically open the abdomen of mice at predefined time points to directly measure the tumor size. However, repetitive surgeries could confound the experimental outcomes. Another method for monitoring tumor growth for grafted tumors is to use prior transfection of cancer cells with luciferase (Gaussia luciferase or firefly luciferase). Although feasible, this method could also confound the results by introducing changes in cancer cells’ phenotype31, and it is restricted to implanted tumor models. In summary, for longitudinal evaluation of tumor growth in this model, we recommend an ultrasound device equipped with specific probes for small-animal imaging.
Below, we provide a detailed step-by-step protocol that can serve as a research tool to examine the interaction between HCC cancer cells and the fibrotic microenvironment in a cirrhotic liver. This protocol produces clinically relevant animal models for HCC. Furthermore, these models can also be used for preclinical drug testing in HCC.
MATERIALS
REAGENTS
Mice. C3H mice are used for orthotopic implantation of HCA-1 cells after fibrosis. The Stk4−/−Stk3F/− GEM is used for concomitant fibrosis induction (Box 1) ! CAUTION All animal studies must be reviewed and approved by the relevant institutional animal care and use committees and conform to all relevant ethics regulations. ▲ CRITICAL It is important to note that C3H mice are more susceptible to fibrosis induction by CCl4 or other hepatotoxic agents, such as TAA. Mice of other strains may require optimization of the duration or dose of exposure to CCl4 to induce a similar amount of hepatic fibrosis without increasing CCl4-associated toxicity. ▲ CRITICAL For experiments, we recommend using male mice aged 4–5 weeks (at the time when adeno-Cre is injected and CCl4 treatment is started). The use of younger (or lighter) mice will result in increased toxicity. Female mice could also be used, but the susceptibility to CCl4 and hepatocarcinogenesis after adeno-Cre injection is higher in male mice. Within one experiment, we recommend using only one gender of mice.
Isoflurane (gas anesthesia system)
Anesthesia: ketamine (we get ours from the Massachusetts General Hospital pharmacy) and xylazine (Webster, cat. no. 200204.00)—add them to sterile saline to obtain a concentration of 100 mg/ml for ketamine and 10 mg/ml for xylazine
Sterile DMEM high glucose medium (Life technologies, Gibco, cat. no. 11965-092)
PBS (1×, CellGro, cat. no. 20-031-CV)
Antibodies specific to smooth muscle actin (SMA; DAKO, cat. no. M0851), CD31 (DAKO, cat. no. M0823), CD8 (Abcam, cat. no. 22378) and collagen-I (Abcam, cat. no. 34710)
VECTASHIELD HardSet antifade mounting medium with DAPI (Vector Laboratories, cat. no. H-1500)
FBS (Life Technologies, Gibco, cat. no. 10082147)
-
Carbon tetrachloride (CCl4; Sigma-Aldrich, cat. no. 319961)
! CAUTION Do not inhale or expose your skin and eyes to CCl4.
Handle CCl4 in a chemical fume hood while wearing appropriate protective gloves and clothing.
Olive oil (Sigma-Aldrich, cat. no. O1514)
Ethanol (70% (vol/vol); Pharmco, cat. no. 111000190)
-
HCA-1 cell line (established from a C3H mouse tumor in the Steele Laboratories, Massachusetts General Hospital) ! CAUTION Check the authenticity of any cell line before use (e.g., genotyping of microsatellite markers to determine mouse origin and to exclude mammalian interspecies contamination, such as provided by IDEXX BioResearch).
▲ CRITICAL The cell lines used in your research should be regularly checked to ensure they are authentic and are not infected with mycoplasma.
Adeno-Cre virus (Gene Transfer Vector Core at the University of Iowa, cat. no. VVC-U of Iowa-5) ! CAUTION Follow the NIH guidelines for handling material containing biosafety level 2 (BSL-2) organisms. Always wear gloves and goggles, use filtered tips and work under a BSL-2 hood.
-
Paraformaldehyde (P6148; Sigma-Aldrich, cat. no. 6148)
! CAUTION Do not inhale or expose it to the skin and eyes.
Trypsin-EDTA, 10×, 0.5% (wt/vol) trypsin-EDTA (Gibco, cat. no. 15400)
BD Matrigel growth factor reduced, basement membrane matrix (BD Biosciences, cat. no. 356230)
Matrigel matrix, high concentration, phenol red–free (BD Biosciences, cat. no. 354262)
EQUIPMENT
Serological pipettes and pipette aid
Insulin syringe, 1 ml (BD Micro-Fine, cat. no. 329412)
Insulin syringe, 0.5 ml with 26 gauge × 5/7 inch needle (BD, no. 309597)
Syringe, 1 ml (BD, cat. no. 309659)
Centrifuge tubes, 50 ml (Corning, cat. no. 430828)
Heat lamp (for tail-vein injections)
Sterile Petri dishes (Falcon)
Countertop vortex (Fisher Scientific)
Centrifuge capable of accepting 15- and 50-ml centrifuge tubes
Bright-field microscope
Caliper (Roboz, cat. no. RS-6466)
Cryomolds (Cardinal Health, cat. no. M7144-13)
Cryostat (Microm, cat. no. HM-560)
Confocal microscope
Incubator
Gavage supplies
Scale (capable of measuring mouse weight)
Syringe, 1 ml (BD, no. 309659)
-
Gavage needle with a ball tip ▲ CRITICAL Gauge size and needle length should be determined on the basis of the size and weight of the animals.
For gavaging of male C3H or Stk4−/−Stk3F/− mice starting at the age of 4–5 weeks and a total exposure period of 12 weeks thereafter, we recommend using a 20-gauge (1–1.5 inches) gavage needle.
Surgical supplies (orthotopic hepatocellular carcinoma cell implantation)
Syringe, 1 ml with 26 gauge needle for anesthesia (Fisher Scientific, cat. no. 14-823-2E)
Eye protective gel
Electric clipper (Webster, cat. no. 78997-010)
Sterile gauze
Heating pad (Shore Line, cat. no. 712.0000.04)
Curved forceps (Roboz Surgical, cat. no. RS-5135)
Straight forceps with teeth (Roboz Surgical, cat. no. RS–5132)
Straight scissors
Small needle holder
Autoclip applier (Roboz, cat. no. RS-9260) plus 9-mm autoclips (Roboz, cat. no. RS-9262)
Sterile cotton swabs
Ethibond suture 5-0 (Ethicon)
Surgical microscope
Sterile Gelfoam
Insulin syringe (BD 1/2-cc, U-100, 28.5-gauge)
REAGENT SETUP
Antibiotic-free medium
Antibiotic-free medium is sterile DMEM high-glucose medium supplemented with 10% (vol/vol) FBS. Store it at 4 °C for continued use of up to 4 weeks. ▲ CRITICAL Cells should be cultured in antibiotic-free medium for at least 2 weeks before use in this procedure.
Paraformaldehyde, 4% (wt/vol)
Dissolve 4 g of paraformaldehyde (PFA) into 100 ml of 1× PBS to prepare a concentration of 4% (wt/vol).
! CAUTION Preparation of 4% (wt/vol) PFA should be performed in a chemical fume hood under appropriate protection. Do not inhale or expose it to the skin and eyes. Store the 4% (wt/vol) PFA solution at 4 °C (cold room, refrigerator) in closed glass containers. PFA can be stored for 1 month at 4 °C and at –20 °C for at least 5 years.
CCl4, 20% (vol/vol) gavage solution
To prepare 10 ml of final concentration (20% vol/vol CCl4), add 2 ml of CCl4 to 8 ml of olive oil. Gently mix the solution. Administer it to mice by gavage of 150 µl of 20% CCl4 solution three times per week. Store 20% (vol/vol) CCl4 solution at 4 °C for 2 weeks or up to 6 months at −20 °C.
HCC cells
HCC cells should be counted, and a suspension of 106 cells per 10 µl of Matrigel should be prepared.
Matrigel solution
Matrigel solution is suited for in vivo implantation (as typically used for subcutaneous (s.c.) injections). We recommend using a high Matrigel concentration to allow the matrix plug to maintain its integrity. The stock solution should be aliquotted into Eppendorf centrifuge tubes (e.g., in 500-µl aliquots) and stored at −20 °C. On the day of the procedure, the aliquots of Matrigel solution should be kept on wet ice (in a liquid state).
Ethanol, 70% (vol/vol)
Mix 1.7 liters of water and 4.73 liters of 95% ethanol. Store it at room temperature (20 °C) in a closed container. Ethanol can be stored for 180 d; Matrigel can be stored for 2 years from the date of manufacture.
PROCEDURE
Induction of liver fibrosis ● TIMING 12 weeks
-
1|
Prepare CCl4 20% (vol/vol) gavage solution (Reagent Setup) before starting the gavaging procedure.
▲ CRITICAL STEP For longer periods of administration (i.e., 12 weeks), we recommend oral gavage of CCl4/olive oil because it is better tolerated by mice, and it leads to reproducible effects on liver histology. In addition, corn oil and/or olive oil are associated with peritoneal irritation and potential adhesions—which might complicate surgical implantation of HCC cells.
-
2|
Draw 150 µl of CCl4 20% (vol/vol) gavage solution (or olive oil as vehicle for control groups) into a 1-ml syringe with the gavage needle.
! CAUTION Avoid the formation of air bubbles while drawing the gavage solution to ensure administration of the right volume.
▲ CRITICAL STEP The gavage procedure should be performed by well-trained personnel.
▲ CRITICAL STEP Gavaging needles that are adequate for the size and weight of the mice must be used.
-
3|
Tightly hold the mouse in a vertical position. Place the body of the mouse straight and extend the head.
▲ CRITICAL STEP Ensure that the position of the mouse is secured before inserting the gavage needle.
-
4|
Insert the gavage needle gently into the mouth of the mouse and search for a position that can allow the needle to bypass the tongue.
-
5|
Smoothly push the gavage needle via the upper palate into the esophagus and introduce the gavage needle further until the tip of the needle reaches the right position in the distal esophagus.
▲ CRITICAL STEP Never push the needle too hard. Introduce the needle gently to avoid perforation of the esophagus or intubation of the trachea.
? TROUBLESHOOTING
-
6|
Inject the CCl4 20% (vol/vol) gavage solution (or olive oil as vehicle) while ensuring that the needle remains at the right position in the distal esophagus.
▲ CRITICAL STEP Administer the CCl4 gavaging solution slowly and only with the gavage needle in the right position to avoid aspiration of fluid into the lungs.
? TROUBLESHOOTING
-
7|
After injection, smoothly remove the gavage needle.
-
8|
Put the mice back to the original cage with the regular diets, and monitor the recovery of the mice. If any sign of labored breathing or respiratory distress is observed, use CO2 inhalation to euthanize the mice.
-
9|
Continue the administration of the CCl4 20% (vol/vol) gavage solution (or olive oil as vehicle for control groups) three times per week for 12 weeks. Closely monitor the health condition of the mice.
? TROUBLESHOOTING
-
10|
Twelve weeks after the first gavage, proceed to the next step to orthotopically implant HCC cells in the cirrhotic liver.
▲ CRITICAL STEP When you establish the cirrhotic HCC model for the first time, include an additional subgroup of mice in order to confirm the cirrhotic state of the liver. Euthanize these mice using CO2 inhalation, collect the livers and fix them in 4% (wt/vol) PFA solution. After embedding in paraffin, slice the paraffin block, mount the slices on glass slides and perform H&E staining to assess necroinflammation and fibrosis, Masson’s trichrome staining to assess extracellular matrix fraction or Sirius red staining to assess fibrillar collagen content.
Generation of orthotopic syngeneic HCC tumors in mice with liver fibrosis ● TIMING 3 h
-
11|
Twelve weeks after the first gavage, stop the treatment of CCl4 20% (vol/vol) gavage solution (or olive oil).
-
12|
Two to 3 d after the last CCl4 treatment, weigh and prepare the mice for the following procedure.
-
13|
Prewarm PBS and DMEM culture medium in a 37 °C water bath before use. Prewarm trypsin at room temperature.
-
14|
Remove the medium from the dish containing HCA-1 cells at 80% confluence.
▲ CRITICAL STEP Avoid using antibiotics to culture cells at least 2 weeks before this step.
▲ CRITICAL STEP Avoid cell passaging for at least 2 d before this step.
-
15|
Gently rinse the dish with prewarmed PBS (10 ml per 10-cm2 dish) and aspirate the PBS afterward.
-
16|
Add 2 ml of 1× trypsin-EDTA (0.05% (wt/vol) to the dish. Gently shake the dish to ensure full coverage of the surface area by the trypsin solution. Put the plates in the 37 °C incubator.
-
17|
After 3–5 min, observe the attached cells on the plate by using a bright-field microscope. Gently tap the dish to facilitate cell detachment.
▲ CRITICAL STEP Do not leave the cells in the trypsin solution for more than 5 min.
? TROUBLESHOOTING
-
18|
When the majority of HCA-1 cells are detached, add 8 ml of DMEM medium to neutralize the trypsin in the dish. Gently resuspend and mix the HCC cell suspension. Collect the cells in a 15-ml centrifuge tube.
-
19|
Centrifuge the HCC cell suspension in the 15-ml centrifuge tube for 5 min at 200–250g at room temperature. Wash the cells with 10 ml of PBS. Centrifuge the cells for 5 min at 200–250g at room temperature and resuspend the cells in serum-free DMEM medium.
-
20|
Use a cell counter to determine the cell number. Adjust the cell concentration to 106 cells per 10 µl in Matrigel (corresponding to the final tumor cell inoculum per injected volume) with serum-free medium. Keep the cell suspension on wet ice.
-
21|
Place the Matrigel solution on wet ice.
-
22|
Anesthetize the mice by using ketamine (100 mg/ml)/xylazine (10 mg/ml) mixture. Use a dose of 10–12 µl/g body weight (corresponding to a dose of 100–120 mg/kg of ketamine and 10–12 mg/kg of xylazine).
-
23|
After anesthesia, place and keep the mice on a heating pad to avoid hypothermia.
-
24|
Shave the abdominal region of the mouse and place the mouse in a supine position.
-
25|
Use sterile gauzes soaked in 70% (vol/vol) ethanol to disinfect and clean the shaved abdominal region from any leftover hair.
-
26|
Gently grab the skin with a forceps and perform a midline abdominal incision of the skin (starting ~1 cm under the xyphoid process).
-
27|
Identify the linea alba in the midline of the abdominal muscle layer and perform a similar incision of 1 cm along the linea alba.
-
28|
Expose the median lobe of the liver by using a sterile cotton swab soaked in sterile saline solution.
? TROUBLESHOOTING
-
29|
Put a small piece of sterile Gelfoam (0.5 × 0.5 cm) on the exposed liver to maintain the liver surface moisture.
-
30|
Immediately before orthotopic implantation (when the liver is already exposed), the HCC cell suspension should be mixed with Matrigel (1:1). Withdraw an equal volume of the cell suspension and Matrigel (i.e., 50 µl each) into a sterile 0.5-ml insulin syringe with a 28-gauge needle. Gently mix the cell suspension with Matrigel and keep it on wet ice.
This will ensure a final cell number of 106 cells per 20 µl of injected volume of the HCC cell/Matrigel suspension.
▲ CRITICAL STEP Maintain the Matrigel solution and the final HCC cell/Matrigel mixture in the insulin syringe on wet ice to prevent gel formation.
▲ CRITICAL STEP The cell solution in Matrigel is good for 2 h on wet ice. Afterward, a fresh HCC cell/Matrigel suspension should be prepared.
-
31|
Transfer the mouse on the heating pad under a surgical microscope.
-
32|
Place the mouse under the microscope in a position with the mouse head pointing toward the person performing the injection. See Supplementary Video 1 for further information on how to perform this and Steps 33–38.
-
33|
Gently insert the 28-gauge needle of the 0.5-ml insulin syringe with the HCC cell/Matrigel solution under the liver capsule.
-
34|
Slowly inject 20 µl of the HCC cell/Matrigel solution (containing 1 × 10⁶ HCA-1 cells) in the subcapsular region of the median lobe. Successful inoculation will form a small bubble on the liver surface.
▲ CRITICAL STEP Inject the HCC cell/Matrigel solution very slowly to avoid leakage and to prevent disruption of the liver surface.
? TROUBLESHOOTING
-
35|
After injecting the HCC cell/Matrigel solution, slowly retract the needle.
-
36|
Prevent leakage by placing a sterile Gelfoam for 5 min on the needle track.
-
37|
Remove the sterile Gelfoam and assess the liver surface at the needle track for leakage and bleeding.
-
38|
Gently wash the injection site with sterile saline solution using a 1-ml syringe with a 25-gauge needle.
-
39|
Close the muscle layer of the abdominal wall by a continuous suture using Ethibond suture 5-0.
-
40|
Close the skin layer of the abdominal wall by placing two or three 9-mm autoclips using the autoclip applier.
-
41|
Leave the mouse on the heating pad and allow the mouse to recover from anesthesia.
-
42|
Apply postoperative analgesia according to the specific animal protocol at your institution.
Tumor growth and monitoring ● TIMING 4–8 weeks
-
43|
Closely monitor the mice for tumor progression and continue to assess their health.
-
44|
At appropriate time points (e.g., 7–10 d after implantation, and then every 7 d afterward), an ultrasound device equipped with high-frequency ultrasound probes can be used to longitudinally assess tumor growth noninvasively under isoflurane anesthesia.
? TROUBLESHOOTING
Troubleshooting advice can be found in Table 1.
TABLE 1.
Troubleshooting table.
| Step | Problem | Possible reason | Solution |
|---|---|---|---|
| 5 | Difficulty passing the gavage needle into the esophagus | The mouse is not positioned at the right angle, or the ball tip of the gavage needle is too large | Ensure that the main axis of the mouse is straight and the neck is extended. Use the round tip of the gavage needle to move the tongue forward. Change the type of the gavage needle to a smaller ball tip |
| 6 | Gavage solution leaks back into the oral cavity | Incorrect position of the gavage needle | The injection should only be performed while the gavage needle remains in the correct position and the tip is placed in the distal esophagus |
| 9 | Mice become weak or show signs of compromised health status | The administered CCl4 dose causes unacceptable toxicity to mice | Reduce the dose of CCl4 |
| 17 | Difficulty in detaching HCA-1 from the cell culture dish | Overconfluent cell culture | Avoid overconfluence of HCA-1 cells in culture dishes. Increase the amount of trypsin-EDTA after washing with PBS |
| 28 | Difficulty in forming bubbles at the injection site | Needle is inserted too deeply into the liver tissue | Insert the needle at an angle more parallel to the liver surface and/or decrease the insertion depth of the needle |
| 34 | Tumor cell/Matrigel solution leaks from the injection site | Injected volume of cell solution is too large Cell solution is not condensed enough |
Reduce the injection volume to 15 µl Increase the amount of Matrigel in the cell/Matrigel mixture or use Matrigel of a higher concentration |
| Box 1, step 2 | Difficulty injecting the adeno-Cre into the tail vein | Perforation of the tail vein The diameter of the vein is small The mice are too small |
Keep the angle of the injection needle to the skin of the tail very flat and go in very slowly Apply heat (infrared lamp, heating pad) and apply 70% (vol/vol) ethanol using a soaked gauze to dilate the tail veins Wait for another week to re-evaluate mouse weight and tail-vein diameter |
● TIMING
Steps 1–10, induction of liver fibrosis: 12 weeks
Steps 11–42, generation of orthotopic syngeneic HCC tumors using mouse HCC cell lines in mice with CCl4-induced liver fibrosis: 3 h
Steps 43 and 44, tumor growth and monitoring: 4–8 weeks
Box 1, liver cirrhosis induction in Stk4−/−Stk3F/− GEM HCC mice: 12 weeks
ANTICIPATED RESULTS
Orthotopic (intrahepatic) tumor implantations in the liver have been successfully performed in mice, and the model of CCl4-induced liver fibrosis has been used for decades to study fibrogenesis in various mouse and rodent models of liver cirrhosis. Our protocol provides an orthotopic model of HCC in which tumor growth is modulated by the cirrhotic liver (Fig. 2). The amount of fibrosis in the non-malignant liver tissue can be quantified by Masson’s trichrome or Sirius red staining of fixed liver sections. An experienced liver pathologist should assess the staining and apply a semiquantitative score to determine the presence/absence of fibrosis and cirrhosis. In addition, staining for the hepatic stellate cell activation markers α-SMA, desmin or glial fibrillary acidic protein (GFAP) and collagen I will provide quantitative measures of fibrosis7,19. Once the administration of CCl4 is stopped, a small degree of spontaneous fibrosis regression may occur. However, complete reversal of cirrhosis is usually not observed after a full course of 12 weeks of CCl4 administration in mice. Regression of fibrosis would take up to 16 weeks. Thus, the liver microenvironment retains the pathological features of inflammation, fibrogenesis and angiogenesis within the time frame of 5–8 weeks in which HCCs are induced and treatment is administered. The HCA-1 model also results in abundant angiogenesis and reproducible spontaneous lung metastases11 (Fig. 4). Thus, this model can be used to study HCC angiogenesis and metastasis. Evaluation of lung metastases should be based on both morphology and immunohistochemistry to confirm the expression of typical HCC markers (i.e., for α-fetoprotein). As there are multiple primary tumors in Stk-mutant mice and multiple nodules in lung metastasis from HCA-1 primary tumor grafts, both the number of nodules and their size should be used for quantification of tumor burden.
Figure 4.

Macroscopic appearance of primary HCC and lung metastases. (a) HCA-1 grafted in cirrhotic liver (after 12 weeks of CCl4 treatment). Scale bar, 10 mm. (b) HCCs forming after adeno-Cre injection in Stk4−/−Stk3F/− mice with liver cirrhosis (after 12 weeks of CCl4 treatment). Scale bar, 10 mm. (c) Primary HCC and lung metastases in healthy (top), fibrotic (middle) and cirrhotic (bottom) livers in the orthotopic HCA-1 graft model. Scale bar, 10 mm. Institutional regulatory board permission from MGH IACUC was obtained for all procedures performed within this protocol.
In addition, these models show adaptive resistance to sorafenib—a standard therapy for advanced HCC—thus allowing studies of treatment resistance mechanisms. For example, we found upregulated fibrogenesis (collagen I depositions and extracellular matrix accumulation), higher levels of proinflammatory cytokines (such as CXCL12/SDF1-α) and hypoxia (as indicated by CA9 expression) in cirrhotic (CCl4-induced) livers compared with healthy control livers7. Furthermore, we observed that HCA-1 tumor growth was facilitated when the cells were implanted into a cirrhotic liver as compared with a healthy liver11 (Fig. 5). Moreover, the tumor growth delay after sorafenib was not as pronounced in syngeneic C3H mice with underlying liver cirrhosis7,11. On the basis of our experience, essentially all Stk4−/−Stk3F/− mice developed HCC after injection with adeno-Cre, with or without combination of CCl4 treatment. However, we observed that induction and growth of HCCs in Stk4−/−Stk3F/− mice was accelerated by CCl4 treatment as compared with Stk4−/−Stk3F/− mice without CCl4 treatment.
Figure 5.

Differential tumor growth rates and treatment response in orthotopic HCC growing in normal livers versus fibrotic livers. Treatment was given when HCCs were established (7–10 d after intrahepatic HCA-1 cell inoculation). Mice were treated daily by gavage with sorafenib (40 mg/kg) or control vehicle (PBS) alone for 2 weeks. n = 5–13, *P < 0.05. Comparisons between treatment groups were performed using the Mann-Whitney U-test. Adapted with permission from ref. 7.
Supplementary Material
Acknowledgments
The authors thank D. Nguyen, A. Pieters and C. Smith for their outstanding support in establishing this protocol. This study was supported by the NIH grant P01-CA080124, and in part by grants R01-CA159258, R21-CA139168, R01-CA126642 and National Cancer Institute/Proton Beam Federal Share Program awards (to D.G.D. and R.K.J.); by the American Cancer Society grant 120733-RSG-11-073-01-TBG (to D.G.D.); by a Max Kade Fellowship by the Austrian Academy of Science and a Erwin-Schroedinger Fellowship by the Austrian Science Funds (to T.R.); by a Howard Hughes Medical Institute Medical Research Fellowship (to C.F.); and by a Postdoctoral Fellowship from Astellas Foundation for Research on Metabolic Disorders (to T.H.).
Footnotes
Any Supplementary Information and Source Data files are available in the online version of the paper.
AUTHORCONTRIBUTIONS T.R., Y.C., A.X.Z., R.K.J. and D.G.D. contributed to the concept and design of the study. T.R., Y.C., R.R.R., T.H., P.H., S.R., C.F., R.S. and G.Y.L. were responsible for acquisition of the data. T.R., Y.C., R.R.R., T.H., R.S., P.H., G.Y.L., A.X.Z., N.B., R.K.J. and D.G.D. contributed to analysis and interpretation of the data. T.R., Y.C., R.R.R., T.H., C.F., R.S., S.R., P.H., G.Y.L., A.X.Z., N.B., R.K.J. and D.G.D. were involved in drafting of the article and revising it for important intellectual content.
COMPETING FINANCIALINTERESTS The authors declare no competing financial interests.
References
- 1.Njei B, Rotman Y, Ditah I, Lim JK. Emerging trends in hepatocellular carcinoma incidence and mortality. Hepatology. 2015;61:191–199. doi: 10.1002/hep.27388. [DOI] [PMC free article] [PubMed] [Google Scholar]
- 2.Forner A, Bruix J. Biomarkers for early diagnosis of hepatocellular carcinoma. Lancet Oncol. 2012;13:750–751. doi: 10.1016/S1470-2045(12)70271-1. [DOI] [PubMed] [Google Scholar]
- 3.Zhu AX, Duda DG, Sahani DV, Jain RK. HCC and angiogenesis: possible targets and future directions. Nat. Rev. Clin. Oncol. 2011;8:292–301. doi: 10.1038/nrclinonc.2011.30. [DOI] [PMC free article] [PubMed] [Google Scholar]
- 4.Hernandez-Gea V, Toffanin S, Friedman SL, Llovet JM. Role of the microenvironment in the pathogenesis and treatment of hepatocellular carcinoma. Gastroenterology. 2013;144:512–527. doi: 10.1053/j.gastro.2013.01.002. [DOI] [PMC free article] [PubMed] [Google Scholar]
- 5.Chauhan VP, Stylianopoulos T, Boucher Y, Jain RK. Delivery of molecular and nanoscale medicine to tumors: transport barriers and strategies. Annu. Rev. Chem. Biomol. Eng. 2011;2:281–298. doi: 10.1146/annurev-chembioeng-061010-114300. [DOI] [PubMed] [Google Scholar]
- 6.Inghilesi AL, et al. Predictors of survival in patients with established cirrhosis and hepatocellular carcinoma treated with sorafenib. World J. Gastroenterol. 2014;20:786–794. doi: 10.3748/wjg.v20.i3.786. [DOI] [PMC free article] [PubMed] [Google Scholar]
- 7.Chen Y, et al. Differential effects of sorafenib on liver versus tumor fibrosis mediated by stromal-derived factor 1 α/C-X-C receptor type 4 axis and myeloid differentiation antigen-positive myeloid cell infiltration in mice. Hepatology. 2014;59:1435–1447. doi: 10.1002/hep.26790. [DOI] [PMC free article] [PubMed] [Google Scholar]
- 8.Forner A, Reig ME, de Lope CR, Bruix J. Current strategy for staging and treatment: the BCLC update and future prospects. Semin. Liver Dis. 2010;30:61–74. doi: 10.1055/s-0030-1247133. [DOI] [PubMed] [Google Scholar]
- 9.European Association For The Study Of The Liver. EASL-EORTC clinical practice guidelines: management of hepatocellular carcinoma. J. Hepatol. 2012;56:908–943. doi: 10.1016/j.jhep.2011.12.001. [DOI] [PubMed] [Google Scholar]
- 10.Fukumura D, Jain RK. Tumor microenvironment abnormalities: causes, consequences, and strategies to normalize. J. Cell. Biochem. 2007;101:937–949. doi: 10.1002/jcb.21187. [DOI] [PubMed] [Google Scholar]
- 11.Chen Y, et al. CXCR4 inhibition in tumor microenvironment facilitates anti-programmed death receptor-1 immunotherapy in sorafenib-treated hepatocellular carcinoma in mice. Hepatology. 2015;61:1591–1602. doi: 10.1002/hep.27665. [DOI] [PMC free article] [PubMed] [Google Scholar]
- 12.Newell P, Villanueva A, Friedman SL, Koike K, Llovet JM. Experimental models of hepatocellular carcinoma. J. Hepatol. 2008;48:858–879. doi: 10.1016/j.jhep.2008.01.008. [DOI] [PMC free article] [PubMed] [Google Scholar]
- 13.Huynh H, Soo KC, Chow PK, Panasci L, Tran E. Xenografts of human hepatocellular carcinoma: a useful model for testing drugs. Clin. Cancer Res. 2006;12:4306–4314. doi: 10.1158/1078-0432.CCR-05-2568. [DOI] [PubMed] [Google Scholar]
- 14.Coulouarn C, et al. Oncogene-specific gene expression signatures at preneoplastic stage in mice define distinct mechanisms of hepatocarcinogenesis. Hepatology. 2006;44:1003–1011. doi: 10.1002/hep.21293. [DOI] [PubMed] [Google Scholar]
- 15.Srivastava J, et al. Astrocyte elevated gene-1 promotes hepatocarcinogenesis: novel insights from a mouse model. Hepatology. 2012;56:1782–1791. doi: 10.1002/hep.25868. [DOI] [PMC free article] [PubMed] [Google Scholar]
- 16.Srivastava J, et al. Astrocyte elevated gene-1 and c-Myc cooperate to promote hepatocarcinogenesis in mice. Hepatology. 2015;61:915–929. doi: 10.1002/hep.27339. [DOI] [PMC free article] [PubMed] [Google Scholar]
- 17.Stauffer JK, et al. Coactivation of AKT and β-catenin in mice rapidly induces formation of lipogenic liver tumors. Cancer Res. 2011;71:2718–2727. doi: 10.1158/0008-5472.CAN-10-2705. [DOI] [PMC free article] [PubMed] [Google Scholar]
- 18.Willimsky G, Schmidt K, Loddenkemper C, Gellermann J, Blankenstein T. Virus-induced hepatocellular carcinomas cause antigen-specific local tolerance. J. Clin. Invest. 2013;123:1032–1043. doi: 10.1172/JCI64742. [DOI] [PMC free article] [PubMed] [Google Scholar]
- 19.Wolf MJ, et al. Metabolic activation of intrahepatic CD8+ T cells and NK T cells causes nonalcoholic steatohepatitis and liver cancer via cross-talk with hepatocytes. Cancer Cell. 2014;26:549–564. doi: 10.1016/j.ccell.2014.09.003. [DOI] [PubMed] [Google Scholar]
- 20.Zhou D, et al. Mst1and Mst2 maintain hepatocyte quiescence and suppress hepatocellular carcinoma development through inactivation of the Yap1 oncogene. Cancer Cell. 2009;16:425–438. doi: 10.1016/j.ccr.2009.09.026. [DOI] [PMC free article] [PubMed] [Google Scholar]
- 21.Zender L, et al. Identification and validation of oncogenes in liver cancer using an integrative oncogenomic approach. Cell. 2006;125:1253–1267. doi: 10.1016/j.cell.2006.05.030. [DOI] [PMC free article] [PubMed] [Google Scholar]
- 22.Xu MZ, et al. AXL receptor kinase is a mediator of YAP-dependent oncogenic functions in hepatocellular carcinoma. Oncogene. 2011;30:1229–1240. doi: 10.1038/onc.2010.504. [DOI] [PMC free article] [PubMed] [Google Scholar]
- 23.Hato T, Goyal L, Greten TF, Duda DG, Zhu AX. Immune checkpoint blockade in hepatocellular carcinoma: current progress and future directions. Hepatology. 2014;60:1776–1782. doi: 10.1002/hep.27246. [DOI] [PMC free article] [PubMed] [Google Scholar]
- 24.Zhang HL, et al. Profound impact of gut homeostasis on chemically-induced pro-tumorigenic inflammation and hepatocarcinogenesis in rats. J. Hepatol. 2012;57:803–812. doi: 10.1016/j.jhep.2012.06.011. [DOI] [PubMed] [Google Scholar]
- 25.Yin H, et al. Deletion of SIRT1 from hepatocytes in mice disrupts lipin-1 signaling and aggravates alcoholic fatty liver. Gastroenterology. 2014;146:801–811. doi: 10.1053/j.gastro.2013.11.008. [DOI] [PMC free article] [PubMed] [Google Scholar]
- 26.Lu L, et al. Hippo signaling is a potent in vivo growth and tumor suppressor pathway in the mammalian liver. Proc. Natl. Acad. Sci. USA. 2010;107:1437–1442. doi: 10.1073/pnas.0911427107. [DOI] [PMC free article] [PubMed] [Google Scholar]
- 27.Guide for the Care and Use of Laboratory Animals. National Academies Press; 2011. Committee for the Update of the Guide for the Care and Use of Laboratory Animals. http://www.nap.edu/catalog/12910/guide-for-the-care-and-use-of-laboratory-animals-eighth. [Google Scholar]
- 28.The French METAVIR Cooperative Study Group. Intraobserver and interobserver variations in liver biopsy interpretation in patients with chronic hepatitis C. Hepatology. 1994;20:15–20. [PubMed] [Google Scholar]
- 29.Lee KH, et al. Percutaneous US-guided implantation of Vx-2 carcinoma into rabbit liver: a comparison with open surgical method. J. Surg. Res. 2009;155:94–99. doi: 10.1016/j.jss.2008.08.036. [DOI] [PMC free article] [PubMed] [Google Scholar]
- 30.Bissig KD, Le TT, Woods NB, Verma IM. Repopulation of adult and neonatal mice with human hepatocytes: a chimeric animal model. Proc. Natl. Acad. Sci. USA. 2007;104:20507–20511. doi: 10.1073/pnas.0710528105. [DOI] [PMC free article] [PubMed] [Google Scholar]
- 31.Tannous BA, Teng J. Secreted blood reporters: insights and applications. Biotechnol. Adv. 2011;29:997–1003. doi: 10.1016/j.biotechadv.2011.08.021. [DOI] [PMC free article] [PubMed] [Google Scholar]
Associated Data
This section collects any data citations, data availability statements, or supplementary materials included in this article.