

Abstract
Ovarian cancer is associated with a leukocyte infiltrate and high levels of chemokines such as CCL2. We tested the hypothesis that CCL2 inhibition can enhance chemotherapy with carboplatin and paclitaxel. Elevated CCL2 expression was found in three non‐MDR paclitaxel resistant ovarian cancer lines ES‐2/TP, MES‐OV/TP and OVCAR‐3/TP, compared to parental cells. Mice xenografted with these cells were treated with the anti‐human CCL2 antibody CNTO 888 and the anti‐mouse MCP‐1 antibody C1142, with and without paclitaxel or carboplatin. Our results show an additive effect of CCL2 blockade on the efficacy of paclitaxel and carboplatin. This therapeutic effect was largely due to inhibition of mouse stromal CCL2. We show that inhibition of CCL2 can enhance paclitaxel and carboplatin therapy of ovarian cancer.
Keywords: CCL2, CCR2, EMT, Paclitaxel, Carboplatin, Resistance
Highlights
CCL2 expression is high in three paclitaxel‐resistant ovarian cancer variants.
CCL2 blockade enhanced antitumor efficacy of paclitaxel and carboplatin.
Efficacy was related to tumor stroma‐derived MCP‐1 blockade.
Abbreviations
- EMT
epithelial–mesenchymal transition
- TAMs
tumor associated macrophages
1. Introduction
Paclitaxel and carboplatin remain the standard chemotherapy for ovarian cancers, although their long‐term efficacy is limited because of tumor drug resistance (Gottesman, 2002). Several molecular mechanisms are described to be involved in cellular resistance to paclitaxel and carboplatin: decreased drug accumulation, increased drug detoxification, elevated DNA repair, altered microtubule dynamicity, and enhanced expression of anti‐apoptotic genes (Chen and Sikic, 2012; Gottesman, 2002).
Chemokine (C–C motif) ligand 2 (CCL2) also known as monocyte chemotactic protein‐1 (MCP‐1) or small inducible cytokine A2, is one of the key chemokines that regulate migration and infiltration of monocytes/macrophages which then become TAMs (Tumor Associated Macrophages) in the tumor microenvironment (Zhang et al., 2010). Both CCL2 and its receptor C–C chemokine receptor type 2 (CCR2) have been demonstrated to be induced and involved in various diseases (Deshmane et al., 2009). In addition to its well‐characterized role as a chemoattractant for monocytes in the immune response (Charo and Ransohoff, 2006), there is evidence suggesting that CCL2 signaling is closely linked to tumor growth and progression (Charo and Ransohoff, 2006; Deshmane et al., 2009; Loberg et al., 2006; Raman et al., 2007) and CCL2 has been shown to be associated with paclitaxel and docetaxel resistance (Duan et al., 1999; Qian et al., 2010). CCL2 recruits tumor‐associated macrophages, which are responsible for the prometastatic effect in the estrogen receptor‐negative breast cancers (Nam et al., 2006). Moreover, CCL2 directly interacts with CCR2 on the endothelial cell surface, leading to increased vessel sprout formation and angiogenesis (Salcedo et al., 2000). Paracrine signaling initiated by breast cancer cells induces CCL2 production by stromal fibroblasts through STAT3 activation. The fibroblast‐derived CCL2, in turn, promotes cancer progression (Tsuyada et al., 2012). CCL2 blockade is associated with activated intratumoral CD8+ cells which are part of the adaptive immune response (Fridlender et al., 2011).
We hypothesized that CCL2 blockade with specific monoclonal antibodies (mAbs) can enhance ovarian cancer response to paclitaxel and carboplatin treatments in vivo. To investigate this hypothesis several ovarian cancer mouse models were established. The mice were treated with mAbs specific to human CCL2 (CNTO 888) and murine MCP‐1 (C1142), paclitaxel or carboplatin alone and the combination of each drug with the mAbs. Tumor growth was followed by caliper measurements of tumor size and by in vivo bioluminescence imaging (BLI) of photons from tumor cells.
2. Materials and methods
2.1. Drugs and chemicals
Clinical formulations of paclitaxel and carboplatin were purchased from the Stanford Hospital Pharmacy.
2.2. Anti‐CCL2 mAbs
C1142 is a rat/mouse chimeric mAb that neutralizes mouse CCL2 (MCP‐1) and CNTO 888 is a human mAb that neutralizes the human homologue CCL2 (Loberg et al., 2007; Obmolova et al., 2012). Both mAbs were produced at Janssen R&D, USA. In most experiments, mice were treated with a mixture of 500 μg (20 mg/kg) per mouse of each mAb (anti‐CCL2) in a total volume of 200 μl normal saline i.p., twice per week. CNTO 888 and C1142 only neutralize human and mouse CCL2 (MCP‐1), respectively (unpublished data).
2.3. Cell lines
Origins and characteristic of the three human ovarian cancer cell lines (OVCAR‐3, ES‐2, and MES‐OV) used in the present study are as follows. The OVCAR‐3 line was established from the malignant ascites of a patient with progressive adenocarcinoma of the ovary, and obtained from the American Type Culture Collection. The ES‐2 cell line was established by the Sikic laboratory from a surgical tumor specimen taken from a 47 year old woman. The tumor was described as a poorly differentiated ovarian mixed serous and clear cell carcinoma. MES‐OV was established in the Sikic laboratory from the ascites of a patient with ovarian serous carcinoma. Drug resistant variants of these three ovarian cancer lines were selected by paclitaxel combined with the P‐glycoprotein inhibitor PSC833. Briefly, each parental cell line was exposed to increasing concentrations of paclitaxel starting at IC50 (the concentration required to kill 50% of the population), with the P‐glycoprotein inhibitor PSC at a concentration of 2 μM. After several passages at this initial concentration of paclitaxel, drug concentrations were escalated, and this process was repeated until variants displayed at least a 10‐fold resistance. After several passages without drug exposure, the acquired stable resistance to paclitaxel was between 5 fold and 30 fold. The three drug‐resistant variants (OVCAR‐3/TP, ES‐2/TP, and MES‐OV/TP) manifest an epithelial to mesenchymal (EMT) phenotype, altered microtubule dynamics, and resistance to apoptosis (Unpublished data). All cell lines were grown in McCoy's medium supplemented with 10% fetal calf serum (Gibco BRL Invitrogen, USA) and cultured in a humidified atmosphere of 5% CO2 at 37 °C.
2.4. Animals
Female 6‐week‐old nude mice were purchased from Charles River Laboratories, USA. The Administrative Panel on Laboratory Animal Care (APLAC) of Stanford University, USA approved all protocols in compliance with the Guide for the Care and Use of Laboratory Animals. The laboratory animal care program at Stanford is accredited by the Association for the Assessment and Accreditation of Laboratory Animal Care (AAALAC International).
2.5. RNA isolation and real‐time reverse transcription‐PCR
RNA was isolated from sub‐confluent growing cells using the AllPrep DNA/RNA kit (Qiagen, USA) and 1 μg RNA was used for first‐strand cDNA synthesis by using MMLV (Invitrogen, USA) according to the manufacturer's protocols. 50× diluted cDNA was prepared and the final 10 μl reaction mixture included 300 nM of each primer and 1× Power SYBR® Green PCR Master Mix (Applied Biosystems, Foster City, CA). Initial denaturation for all PCR reactions was 10 min at 95 °C followed by 40 cycles of PCR amplification (95 °C for 15 s and 60 °C for 1 min) using the ABI QuantStudio platform (Applied Biosystems, Foster City, CA). The PCR products obtained by primers specific for GAPDH were used as a reference gene to control for loading. Amplification efficiencies were determined by serial dilutions, and all reactions were performed in triplicate. Melt curves were performed after each run to confirm the primer specificity.
2.6. CCL2 assay
Cell culture supernatant and plasma levels of free human CCL2 were measured by Meso Scale Discovery (MSD) electrochemiluminescence detection technology. Plasma samples were collected from tumor‐bearing mice after completion of the treatment. The CCL2 MSD assays were performed at Janssen R&D, Radnor, PA, USA. One of the treatment antibodies, CNTO 888, was used in the detection assay for free CCL2. The capture antibody for ECL detection was biotinylated CNTO 888. The detection antibody was ruthenium tagged detection antibody from the human MCP‐1 kit from MSD (Custom order Catalog # from MSD = D21AY‐1). Using this approach, only free human CCL2 would be detected by the assay.
2.7. Lentivirus generation and establishment of GFP/luc+ cells
The lentiviral vector pHR2‐GLF (GFP – firefly luciferase fusion) was kindly provided by Dr. C. G. Fathman, Stanford University and described previously (Creusot et al., 2008). Lentiviral particles expressing GLF were prepared by using 293T cells plated in 175 cm2 flasks, 24 h after the seeding, near‐confluent cells were co‐transfected with 45 μg pHR2‐GLF lentiviral vector together with pCMVΔR8.74 packaging and VSV‐G‐expressing vectors (3:2:1 ratio) in presence of 25 μM chloroquine (Sigma–Aldrich, USA). The medium was changed after 8–12 h, and collected at 24–36 h, then filtered through a 0.45 μm polyethersulfone filter, and ultracentrifuged for 2 h 20 min at 19,500 rpm at 4 °C. The viral pellet was resuspended in plain IMDM medium (Invitrogen, USA) and frozen at −80 °C. The viral titer was determined by infection of 293T cells with several dilutions of the virus and analysis of GFP+ cells by flow cytometry 36 h later. After trypsinization and centrifugation, the cells were washed in PBS (pH 8.2), and centrifuged again. The cell pellet was resuspended in fresh 500 μl PBS and GFP expression was measured. The day before transduction, 1 × 10⁵ cells per well were seeded in a 6‐well tissue culture plate in 2 ml of DMEM media containing 10% FBS and 1% Pen‐Strep. Cells were infected with pHR2‐GLF lentiviral particles (MOI = 15) in the presence of 8 μg/ml polybrene (hexadimethrine bromide – Sigma) in 1 ml of OptiMEM, then spun at 2500 rpm 90 min immediately following addition of virus. After 16–24 h incubation with virus, the medium was changed. GFP+ cells were sorted and purified twice by flow cytometry.
2.8. Animal tumor models
Experimental subgroups consisted of five mice, with each subgroup caged separately. Mice were injected subcutaneously (s.c.) between the shoulders or intraperitoneally (i.p.) with 2–30 × 106 of gfp/luc tumor cells. The tumors were allowed to reach an average size of 20–50 mm3 (approximately 4–30 d). All mice from each study entered the bioluminescence study (n = 50), and growth was monitored by comparing at least two bioluminescence sessions. A subset of mice with tumor take confirmed by bioluminescence was selected (n = 30) for each experiment. Mice were imaged and caliper measurements obtained twice weekly to assess the growth rate of tumors and ascites. Animals were euthanized when the tumors were advanced (2 cm diameter for s.c. tumors), and tumor specimens were harvested for molecular and histological analyses. Solid tumors were harvested in buffered formalin for H&E staining, in OCT freezing solution for potential IHC studies, and snap frozen for RNA extraction. Ascites was collected for ELISA analyses from the i.p. groups.
2.9. Measurement of tumor size by caliper and in vivo bioluminescence imaging (BLI)
The greatest longitudinal diameter (length) and the greatest transverse diameter (width) were determined by calipers. Tumor volumes were calculated by the following formula: Volume = (width)2 × length/2. BLI was started a few days after injection of GFP/luc transduced cells using a highly sensitive CCD camera (IVIS 50; Caliper Life Sciences, Alameda, CA). To perform BLI, D‐Luciferin Firefly (3 mg/mouse; Biosynth, USA) was administered by i.p. injections, mice were anesthetized with a 2% isofluorane/air mixture, and bioluminescence images were acquired 13 min after i.p. injection.
2.10. Statistical analyses
Statistical analysis utilized the standard two‐tailed Student's t‐test for two data sets using Prism (GraphPad Inc.). Data are presented as means ± standard errors (SEM).
3. Results
3.1. CCL2 is elevated in paclitaxel resistant cell variants
We evaluated CCL2 RNA and protein levels in the three pairs of ovarian cancer parental and drug‐resistant cell lines. qPCR analysis determined higher expression of CCL2 in all three non‐MDR paclitaxel resistant variants (TP) with ratios from 7 to 45 fold (Figure 1A). The level of secreted free CCL2 protein was measured by MSD assay in the cell culture supernatants 4–7 days after cell passage. We showed an increased CCL2 protein level in the OVCAR‐3/TP and MES‐OV/TP paclitaxel‐resistant cells compared to parental cells. The level of CCL2 protein secreted by ES‐2 and ES‐2/TP was below detection limits (Figure 1B). In addition, we used the MSD assay to measure CCL2 levels secreted by tumors in vivo. Anti‐human CCL2 was used to detect the tumor CCL2 specifically, without measuring the host CCL2 homologue MCP‐1. The results were in accordance with in vitro data, with elevated free CCL2 in animals bearing OVCAR‐3/TP and MES‐OV/TP paclitaxel‐resistant cells compared to parental cells. The level of free CCL2 secreted by ES‐2 and ES‐2/TP as well as OVCAR‐3 was below the limit of detection (Figure 1C).
Figure 1.

Tumor cell CCL2 levels in vitro and in vivo. A. The level of CCL2 RNA expression in ES‐2, ES‐2/TP, MES‐OV, MES‐OV/TP, OVCAR‐3, and OVCAR‐3/TP cell lines. B. Secreted CCL2 protein levels in cell culture supernatants by ELISA. C. Secreted human CCL2 in murine blood plasma by ELISA (in the ES‐2 and ES‐2/TP pair, CCL2 was only detectable at the mRNA level). *P < 0.05, **P < 0.005, ***P < 0.0001.
3.2. Established ovarian cancer cell models are resistant to paclitaxel treatment
Using lentivirus technology, we established tumor models in which GFP and luciferase are stably expressed, for each of the six cell lines used in this project: OVCAR‐3, OVCAR‐3/TP, ES‐2, ES‐2/TP, MES‐OV, and MES‐OV/TP. All six cell lines were then maintained in drug free medium. GFP‐labeled cells were sorted at least twice to ensure uniform expression. GFP+ cells were evaluated for luciferase expression levels by bioluminescence imaging (Supplementary Figure 1). GFP/luc+ TP cells remained stably resistant to paclitaxel from 4.6 to 16 fold resistant (Table 1). In order to establish ovarian cancer models for in vivo study we injected OVCAR‐3, OVCAR‐3/TP, ES‐2, ES‐2/TP, MES‐OV, and MES‐OV/TP GFP/luc+ cells into adult female nude mice. The cells were injected s.c. and i.p. Ten of the 12 models were sufficiently robust for in vivo experimentation (MESOV/TP i.p. and OVCAR‐3 i.p. were not valuable tools for in vivo study) (Supplementary Figure 2). Paclitaxel exposure does not alter CCL2 expression, and addition of CCL2 as well as anti‐CCL2 CNTO 888 does not affect paclitaxel sensitivity in vitro (Supplementary Figure 3). Resistance to paclitaxel of the three GFP/luc+ TP variants was confirmed in vivo (Supplementary Figure 4).
Table 1.
Stably transduced GFP/luc+ variants maintain resistance to paclitaxel. Transduced and sorted variants are still resistant to paclitaxel after 12 passages without drug selection.
| Cell line | Parental IC50 | Paclitaxel resistant IC50 | Fold resistance |
|---|---|---|---|
| ES‐2/GFP‐luc | 2 nM | 32 nM | 16× |
| MES‐OV/GFP‐luc | 0.7 nM | 3.2 nM | 4.6× |
| OVCAR‐3/GFP‐luc | 0.4 nM | 2.1 nM | 5.3× |
3.3. CCL2 blockade additive effect
3.3.1. OVCAR‐3 parental and drug‐resistant variant
OVCAR‐3 GFP/luc+ and OVCAR‐3/TP GFP/luc+ were injected s.c. and allowed to grow as a solid tumor of at least 20 mm3 before being randomized in treatment groups of five mice. Measurements of total body tumor burden over time were quantified by BLI photon counts.
Mice bearing parental OVCAR‐3 GFP/luc+ tumor cells were treated for four weeks with paclitaxel twice a week at weeks 6, 7, 8, and 9 at 20 mg/kg. Anti‐CCL2 mAbs (C1142 and CNTO 888) were administered at 20 mg/kg each, twice a week for the same duration (Figure 2A). All treatment groups showed significantly reduced tumor burden as compared to the untreated group from weeks 8 to 10 (P < 0.004). Both paclitaxel treatment groups showed significantly reduced tumor burden as compared to the anti‐CCL2 antibody group from weeks 13 to 17 (P = 0.005 and P = 0.003). The paclitaxel + anti‐CCL2 group showed significantly reduced tumor burden as compared to paclitaxel alone from weeks 7 to 17 (P = 0.005).
Figure 2.
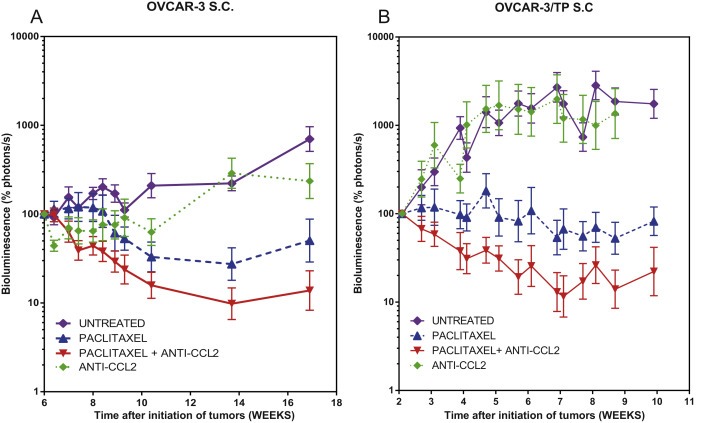
Anti‐CCL2 sensitizes s.c. OVCAR‐3 and OVCAR‐3/TP tumors to paclitaxel. Measurement of mouse tumor burden over time by BLI photon counts. Animals representing the four treatment groups are shown. Normalized mean ± SEM is shown for each group; tumor burden is shown while 5 of 5 mice remained on study for each group. A. Mice bearing OVCAR‐3 GFP/luc+ tumors were treated with paclitaxel twice a week at weeks 6, 7, 8, and 9 at 20 mg/kg, and anti‐CCL2 mAbs at 20 mg/kg twice a week for the same duration. B. Mice bearing OVCAR‐3/TP GFP/luc+ tumors were treated with paclitaxel twice a week at weeks 2, 3, 4, 5, 6, 7, 8, and 9 at 20 mg/kg, and anti‐CCL2 mAbs at 20 mg/kg twice a week for the same duration.
The relationship between CCL2 blockade and paclitaxel resistance was studied in OVCAR‐3/TP GFP/luc+ variants injected s.c. Mice were treated for 8 weeks with paclitaxel twice a week at weeks 2–10 at 20 mg/kg, and anti‐CCL2 mAbs (C1142 and CNTO 888) were administered at 20 mg/kg (500 μg/mouse) each, twice a week for the same duration (Figure 2B). Both paclitaxel treatment groups showed significantly reduced tumor burden as compared to the untreated control group from weeks 4 to 10 (P < 0.001). Both paclitaxel treatment groups showed significantly reduced tumor burden as compared to the anti‐CCL2 antibody group from weeks 4 to 10 (P < 0.0001). The paclitaxel/anti‐CCL2 group showed significantly reduced tumor burden as compared to paclitaxel alone from weeks 4 to 10 (P < 0.0001). This experiment shows a moderate but highly significant additive effect of the CCL2 blockade in combination with paclitaxel. Tumors treated with that combination lost 90% of their pretreatment tumor burden as quantified by bioluminescence after 5 weeks of treatment, while paclitaxel treated tumors lost only 50% of their burden. Mice treated with CCL2 blockade alone reached 1100% of their pre‐treatment tumor burden.
3.3.2. MES‐OV parental and drug‐resistant variant
MES‐OV parental cells have higher levels of secreted CCL2 compared to ES‐2 and OVCAR‐3 cells (Figure 1B) and are moderately sensitive to paclitaxel (in vitro IC50 ∼1 nM). In vivo, parental tumors treated with paclitaxel showed significantly reduced tumor burden as compared to the untreated controls from weeks 8 to 11 (P < 0.003 for BLI and p < 0.02 for volumes) (Figure 3). The paclitaxel treatment groups showed significantly reduced tumor burden as compared to the anti‐CCL2 mAbs (C1142 and CNTO 888) alone from weeks 8 to 11 (P < 0.02 for BLI and P < 0.004 for volumes) (Figure 3). The paclitaxel/anti‐CCL2 mAbs combination therapy groups for the parental MES‐OV showed significantly reduced tumor burden as compared to paclitaxel alone from weeks 12 to 18 (P = 0.006 for BLI) and from weeks 17 to 18 (P = 0.0485 for volumes) (Figure 3).
Figure 3.
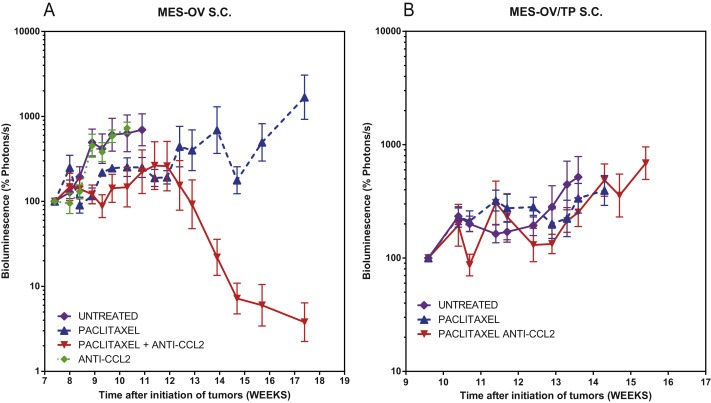
Anti‐CCL2 sensitizes s.c. MES‐OV to paclitaxel but not MES‐OV/TP. A. Measurement of total body tumor burden over time for animals bearing MES‐OV GFP/luc+ tumors measured with calipers and by BLI photon counts. Animals representing the four treatment groups are shown. Normalized mean ± SEM is shown for each group. Mice were treated for 6 weeks with paclitaxel twice a week at weeks 7, 8, 9, 10, 11, 12 and 13 at 20 mg/kg, and anti‐CCL2 mAbs at 20 mg/kg twice a week for the same duration. B. Measurement of total body tumor burden over time for animals bearing MES‐OV/TP GFP/luc+ tumor cells as volumes measured with caliper and by BLI photon counts. Animals representing the three treatment groups are shown. Normalized mean ± SEM is shown for each group. Mice were treated for 6 weeks with paclitaxel twice a week at weeks 9–15 at 20 mg/kg, and anti‐CCL2 mAbs at 20 mg/kg twice a week for the same duration. Mice were euthanized when the tumor size exceeded 2 cm in larger diameter. When fewer than 4 out of 5 mice remained in the group, the curves were truncated.
Paclitaxel alone has a modest effect on parental MES‐OV tumors by slowing the growth (bioluminescence increased to 110% while for untreated mice it increased to 700% after 4 weeks of treatment). The antitumor effect is significantly enhanced when paclitaxel is combined with CCL2 blockade. Three out of the five mice were apparently cured, with delayed regrowth in the other two. CCL2 blockade alone had no therapeutic effect.
However, neither paclitaxel nor the paclitaxel/anti‐CCL2 mAbs combination had significant therapeutic effects in the MES‐OV/TP drug resistant variants.
3.3.3. ES‐2 parental and drug‐resistant variant
The experiments using ES‐2 and ES‐2/TP s.c. utilized 20 mg/kg paclitaxel twice a week and 10 mg/kg of each antibody (C1142 and CNTO 888) for the CCL2 blockade (Supplementary Figure 5). ES‐2 and ES‐2/TP are fast growing, aggressive tumors, and both were relatively resistant to paclitaxel, CCL2 antibodies and the combination. The doubling times of the tumors did demonstrate a modest degree of additional resistance in the ES‐2/TP variants, consistent with prior in vitro data.
3.4. Additive effect of CCL2 blockade in combination with carboplatin
In order to determine whether the enhancement of chemotherapy by CCL2 blockade was specific for taxanes, we treated mice with carboplatin, with and without CCL2 blockade (Figure 4). The initial OVCAR‐3/TP s.c. experiment was done with 100 mg/kg of carboplatin and 20 mg/kg of each antibody. Because of weight loss and early deaths in 20% of mice treated at 100 mg/kg of carboplatin for 5 weeks, the carboplatin dose was reduced to 80 mg/kg/week for 4 weeks in subsequent studies.
Figure 4.
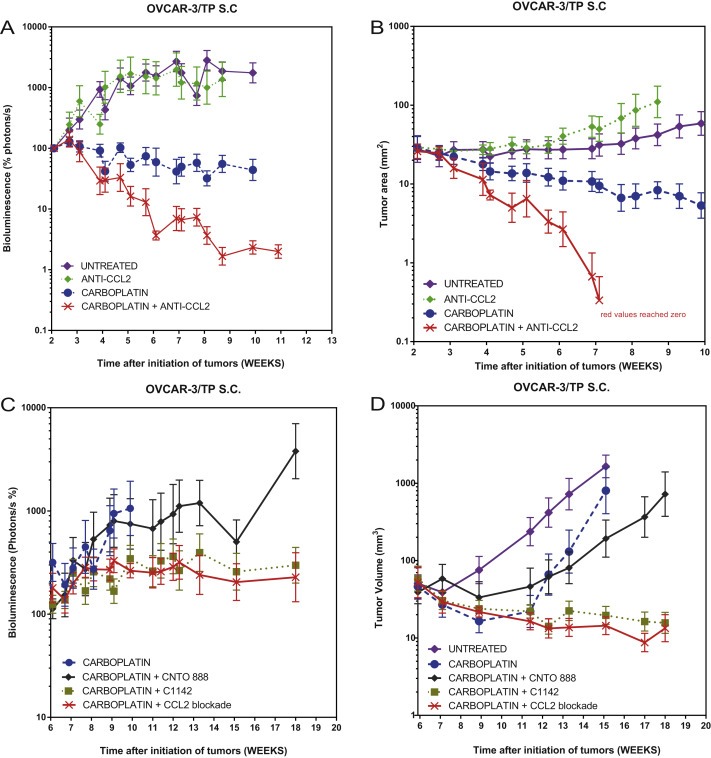
Anti‐CCL2 sensitizes s.c. OVCAR‐3/TP to carboplatin. Measurement of total body tumor burden over time for animals bearing OVCAR‐3/TP GFP/luc+ tumors as measured with caliper and by BLI photon counts. Normalized mean ± SEM is shown for each group. A and B. Animals representing four out of the six treatment groups are shown. Mice were treated for 5 weeks with carboplatin once a week from weeks 2 to 7 at 100 mg/kg, and anti‐CCL2 mAbs at 20 mg/kg twice a week for 8 weeks from weeks 2 to 10. C and D. Animals representing the six treatment groups are shown. Mice were treated for 4 weeks between weeks 6 and 10 with 80 mg/kg of carboplatin once a week and with 20 mg/kg of CCL2 mAbs twice a week.
Both carboplatin treatment groups showed significantly reduced tumor burden as compared to the untreated controls from weeks 4 to 10 (P < 0.0001) (Figure 4). Both carboplatin treatment groups showed significantly reduced tumor burden as compared to the anti‐CCL2 antibody group from weeks 4 to 10 (P < 0.0001); the carboplatin/anti‐CCL2 group showed significantly reduced tumor burden as compared to carboplatin alone from weeks 4 to 10 (P < 0.0001) (Figure 4A and B).
3.5. Role of CCL2 neutralization in tumor versus stroma versus both tumor and stroma for tumor growth inhibition
In order to define the relative contributions to therapeutic efficacy of the CCL2 secreted by the tumor versus the murine homologue MCP‐1 secreted by host stromal cells, we designed an experiment with carboplatin plus the individual versus combined mAbs. We compared the therapeutic effect of carboplatin combined with anti‐human CCL2 secreted by the tumor (CNTO 888 antibody) and carboplatin combined with anti‐mouse CCL2 secreted by the host and microenvironment (C1142 antibody) (Figure 4C and D). We also had as controls carboplatin alone and carboplatin plus both mAbs CNTO 888 and C1142. Both anti‐mouse MCP‐1 (C1142) treatment groups showed significantly reduced tumor burden as compared to the untreated group from weeks 12 to 18 (P = 0.0136 and P = 0.0132) and were the only ones showing a significant difference. The combination of carboplatin and anti‐human CCL2 showed a modest improvement compared to carboplatin only and was not significant. This experiment shows that blocking the CCL2 secreted by the microenvironment of the tumor is actually more effective than blocking the CCL2 secreted by the tumor itself.
3.6. Additive effect of CCL2 blockade in an i.p. tumor model
In OVCAR‐3/TP i.p. model, as measured by BLI, both paclitaxel treatment groups showed significantly reduced tumor burden as compared to the untreated group from weeks 7 to 8 (P < 0.02); the paclitaxel/anti‐CCL2 group showed significantly reduced tumor burden as compared to paclitaxel alone from weeks 7 to 8 (P = 0.0084) (Figure 5).
Figure 5.
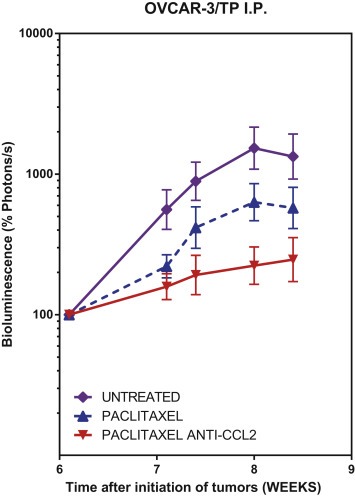
Anti‐CCL2 sensitizes i.p. OVCAR‐3/TP to paclitaxel. Measurement of total body tumor burden over time for animals bearing OVCAR‐3 GFPluc tumors as quantified by BLI photon counts. Animals representing the three treatment groups are shown. Normalized mean ± SEM is shown for each group. Mice were treated with paclitaxel twice a week at weeks 6–8 at 20 mg/kg, and anti‐CCL2 mAbs at 20 mg/kg twice a week for the same duration.
4. Discussion
The drug resistant ovarian cancer variants utilized in these studies manifest features of EMT, as well as altered microtubulin dynamicity and resistance to apoptosis. Elevation of CCL2 expression in these drug‐resistant variants is associated with EMT, which is a common phenotype in serous ovarian cancers associated with a poor prognosis disease (Kajiyama et al., 2007; Low‐Marchelli et al., 2013; Vergara et al., 2010). The variants displayed upregulation of SNAIL2 and MMP9, increased vimentin and fibronectin, and downregulation of E‐Cadherin. Therefore, we hypothesized that the CCL2/CCR2 pathway may be an attractive therapeutic target in ovarian cancers.
Overall, in several of the xenograft models, we found a significant enhancement of both paclitaxel and carboplatin chemotherapy when combined with CCL2 blockade. Two of the three parental lines (OVCAR‐3 and MES‐OV) exhibited this chemosensitization, whereas only one of the resistant models (OVCAR‐3/TP) showed enhancement of the therapeutic effect of paclitaxel. Both OVCAR‐3 and MES‐OV are derived from serous ovarian cancers. The ES‐2 and ES2/TP pair of xenografts were both highly resistant to paclitaxel, and were also highly resistant to CCL2 blockade. The ES‐2 cell line was derived from a highly aggressive and drug‐resistant variant cancer with mixed serous and clear cell histopathological features. ES‐2 also exhibits the genomic signature of clear cell cancers (Schaner et al., 2003). Thus, despite increases in tumor CCL2 expression in the resistant variants, only one of the three resistant variants demonstrated sensitization to chemotherapy by combined CCL2 blockade, whereas two of the parental lines demonstrated such sensitization. Combined CCL2 blockade alone had no or marginal antitumor activity in the six xenograft models.
In the OVCAR‐3 parental xenografts, we found that, despite fairly low basal expression of CCL2 in OVCAR‐3 GFP/luc+ cells, CCL2 blockade showed a significant therapeutic effect in combination with paclitaxel chemotherapy and to a lesser extent as a monotherapy between the second and fourth weeks of treatment (Figure 2). Although OVCAR‐3/TP cells were resistant to paclitaxel in vitro, there was less resistance in vivo compared to parental cells. The decrease in bioluminescence was approximately 80% in OVCAR3 parental tumors with paclitaxel alone compared to 40% in the OVCAR3/TP tumors. The anti‐CCL2 antibodies significantly enhanced the effects of paclitaxel in both tumor types. The effect of CCL2 blockade in sensitizing paclitaxel was sustained in the OVCAR‐3/TP resistant variant, with three of the five mice apparently cured by this combination. We were also able to demonstrate the efficacy of paclitaxel and CCL2 blockade in an intraperitoneal model with OVCAR‐3/TP GFP/luc+.
The chemosensitizing effect of CCL2 blockade was not restricted to taxane therapy, but was even more marked with carboplatin therapy (Figure 4). This is particularly notable because taxane and platinum drugs in combination are the standard of care for advanced ovarian cancers, and thus CCL2 blockade has the possibility of enhancing the effects of both of these very different classes of chemotherapy.
Finally, we were able to show that the CCL2/MCP‐1 secreted by the tumor microenvironment was more important than the CCL2 secreted by tumor cells in relation to chemosensitization (Figure 4). This has important implications for potential predictive biomarkers for CCL2 blockade, and illustrates the major role of the microenvironment in tumor development and the importance of targeting microenvironment proteins that are responsible for tumor growth and metastasis promotion.
With regard to basic levels of endogenous CCL2 in mice, we have measured mouse CCL2/MCP‐1 in other experiments. In naïve and tumor‐bearing mice that are not treated with anti‐mouse CCL2 antibody, the levels of circulating mouse CCL2 are approximately 20–50 pg/ml. If mice are treated with anti‐mouse CCL2 antibody, the levels of circulating mouse CCL2 increase to several hundred pg/ml. The ELISA detection method for CCL2 uses a polyclonal antibody that permits detection of CCL2 when bound to antibody. We believe the higher levels of CCL2 detected with antibody treatment are due to the antibody binding to CCL2 from all tissue sources and artificially prolonging its circulation, as CCL2 is a short‐lived chemokine.
5. Conclusions
We have shown a significant additive effect of CCL2 blockade combined with paclitaxel and carboplatin in ovarian cancers. This approach should be further investigated, but the clinical utility of the CCL2 antibody CNTO 888 has been limited by the finding of increased expression of CCL2 in response to escalating doses of this mAb in Phase I and Phase 2 trials (Fetterly et al., 2013; Pienta et al., 2012; Sandhu et al., 2013). This increase in ligand expression might be overcome by targeting the receptor CCR2 with a small molecule as significant progress continues to be made in identifying novel, potent CCR2 antagonists.
Financial support
This work was supported by a grant from Janssen Research and Development and by the Brigitte Decre Ovarian Cancer Research Fund.
Author disclosure information
F. Moisan, E.B. Francisco, and B.I. Sikic: Janssen R&D research support. A. Brozovic, G.E. Duran, and Y.C. Wang: none. S. Chaturvedi, S. Seetharam, L.A. Snyder, and P. Doshi: employees of Janssen R&D, LLC.
Supporting information
The following is the supplementary data related to this article:
Supplementary data
Supplementary material 1.
Supplementary data related to this article can be found at http://dx.doi.org/10.1016/j.molonc.2014.03.016.
Moisan Francois, Francisco Edgar B., Brozovic Anamaria, Duran George E., Wang Yan C., Chaturvedi Shalini, Seetharam Shobha, Snyder Linda A., Doshi Parul, Sikic Branimir I., (2014), Enhancement of paclitaxel and carboplatin therapies by CCL2 blockade in ovarian cancers, Molecular Oncology, 8, doi: 10.1016/j.molonc.2014.03.016.
References
- Charo, I.F. , Ransohoff, R.M. , 2006. The many roles of chemokines and chemokine receptors in inflammation. New Engl. J. Med. 354, 610–621. [DOI] [PubMed] [Google Scholar]
- Chen, K.G. , Sikic, B.I. , 2012. Molecular pathways: regulation and therapeutic implications of multidrug resistance. Clin. Cancer Res.: Off. J. Am. Assoc. Cancer Res. 18, 1863–1869. [DOI] [PMC free article] [PubMed] [Google Scholar]
- Creusot, R.J. , Yaghoubi, S.S. , Kodama, K. , Dang, D.N. , Dang, V.H. , Breckpot, K. , Thielemans, K. , Gambhir, S.S. , Fathman, C.G. , 2008 May. Tissue-targeted therapy of autoimmune diabetes using dendritic cells transduced to express IL-4 in NOD mice. Clin. Immunol. 127, (2) 176–187. [DOI] [PMC free article] [PubMed] [Google Scholar]
- Deshmane, S.L. , Kremlev, S. , Amini, S. , Sawaya, B.E. , 2009. Monocyte chemoattractant protein-1 (MCP-1): an overview. J. Interferon Cytokine Res.: Off. J. Int. Soc. Interferon Cytokine Res. 29, 313–326. [DOI] [PMC free article] [PubMed] [Google Scholar]
- Duan, Z. , Feller, A.J. , Penson, R.T. , Chabner, B.A. , Seiden, M.V. , 1999. Discovery of differentially expressed genes associated with paclitaxel resistance using cDNA array technology: analysis of interleukin (IL) 6, IL-8, and monocyte chemotactic protein 1 in the paclitaxel-resistant phenotype. Clin. Cancer Res.: Off. J. Am. Assoc. Cancer Res. 5, 3445–3453. [PubMed] [Google Scholar]
- Fetterly, G.J. , Aras, U. , Meholick, P.D. , Takimoto, C. , Seetharam, S. , McIntosh, T. , de Bono, J.S. , Sandhu, S.K. , Tolcher, A. , Davis, H.M. , Zhou, H. , Puchalski, T.A. , 2013. Utilizing pharmacokinetics/pharmacodynamics modeling to simultaneously examine free CCL2, total CCL2 and carlumab (CNTO 888) concentration time data. J. Clin. Pharmacol. 53, 1020–1027. [DOI] [PubMed] [Google Scholar]
- Fridlender, Z.G. , Kapoor, V. , Buchlis, G. , Cheng, G. , Sun, J. , Wang, L.-C.S. , Singhal, S. , Snyder, L.A. , Albelda, S.M. , 2011. Monocyte chemoattractant protein-1 blockade inhibits lung cancer tumor growth by altering macrophage phenotype and activating CD8+ cells. Am. J. Respir. Cell Mol. Biol. 44, 230–237. [DOI] [PMC free article] [PubMed] [Google Scholar]
- Gottesman, M.M. , 2002. Mechanisms of cancer drug resistance. Annu. Rev. Med. 53, 615–627. [DOI] [PubMed] [Google Scholar]
- Kajiyama, H. , Shibata, K. , Terauchi, M. , Yamashita, M. , Ino, K. , Nawa, A. , Kikkawa, F. , 2007. Chemoresistance to paclitaxel induces epithelial–mesenchymal transition and enhances metastatic potential for epithelial ovarian carcinoma cells. Int. J. Oncol. 31, 277–283. [PubMed] [Google Scholar]
- Loberg, R.D. , Day, L.L. , Harwood, J. , Ying, C. , St John, L.N. , Giles, R. , Neeley, C.K. , Pienta, K.J. , 2006. CCL2 is a potent regulator of prostate cancer cell migration and proliferation. Neoplasia (New York, N.Y.). 8, 578–586. [DOI] [PMC free article] [PubMed] [Google Scholar]
- Loberg, R.D. , Ying, C. , Craig, M. , Day, L.L. , Sargent, E. , Neeley, C. , Wojno, K. , Snyder, L.A. , Yan, L. , Pienta, K.J. , 2007. Targeting CCL2 with systemic delivery of neutralizing antibodies induces prostate cancer tumor regression in vivo. Cancer Res. 67, 9417–9424. [DOI] [PubMed] [Google Scholar]
- Low-Marchelli, J.M. , Ardi, V.C. , Vizcarra, E.A. , van Rooijen, N. , Quigley, J.P. , Yang, J. , 2013. Twist1 induces CCL2 and recruits macrophages to promote angiogenesis. Cancer Res. 73, 662–671. [DOI] [PMC free article] [PubMed] [Google Scholar]
- Nam, J.-S. , Kang, M.-J. , Suchar, A.M. , Shimamura, T. , Kohn, E.A. , Michalowska, A.M. , Jordan, V.C. , Hirohashi, S. , Wakefield, L.M. , 2006. Chemokine (C–C motif) ligand 2 mediates the prometastatic effect of dysadherin in human breast cancer cells. Cancer Res. 66, 7176–7184. [DOI] [PMC free article] [PubMed] [Google Scholar]
- Obmolova, G. , Teplyakov, A. , Malia, T.J. , Grygiel, T.L.R. , Sweet, R. , Snyder, L.A. , Gilliland, G.L. , 2012. Structural basis for high selectivity of anti-CCL2 neutralizing antibody CNTO 888. Mol. Immunol. 51, 227–233. [DOI] [PubMed] [Google Scholar]
- Pienta, K.J. , Machiels, J.-P. , Schrijvers, D. , Alekseev, B. , Shkolnik, M. , Crabb, S.J. , Li, S. , Seetharam, S. , Puchalski, T.A. , Takimoto, C. , Elsayed, Y. , Dawkins, F. , de Bono, J.S. , 2012. Phase 2 study of carlumab (CNTO 888), a human monoclonal antibody against CC–chemokine ligand 2 (CCL2), in metastatic castration-resistant prostate cancer. Investig. New Drugs. 2, [DOI] [PubMed] [Google Scholar]
- Qian, D.Z. , Rademacher, B.L.S. , Pittsenbarger, J. , Huang, C.-Y. , Myrthue, A. , Higano, C.S. , Garzotto, M. , Nelson, P.S. , Beer, T.M. , 2010. CCL2 is induced by chemotherapy and protects prostate cancer cells from docetaxel-induced cytotoxicity. Prostate. 70, 433–442. [DOI] [PMC free article] [PubMed] [Google Scholar]
- Raman, D. , Baugher, P.J. , Thu, Y.M. , Richmond, A. , 2007. Role of chemokines in tumor growth. Cancer Lett. 256, 137–165. [DOI] [PMC free article] [PubMed] [Google Scholar]
- Salcedo, R. , Ponce, M.L. , Young, H.A. , Wasserman, K. , Ward, J.M. , Kleinman, H.K. , Oppenheim, J.J. , Murphy, W.J. , 2000. Human endothelial cells express CCR2 and respond to MCP-1: direct role of MCP-1 in angiogenesis and tumor progression. Blood. 96, 34–40. [PubMed] [Google Scholar]
- Sandhu, S.K. , Papadopoulos, K. , Fong, P.C. , Patnaik, A. , Messiou, C. , Olmos, D. , Wang, G. , Tromp, B.J. , Puchalski, T.A. , Balkwill, F. , Berns, B. , Seetharam, S. , de Bono, J.S. , Tolcher, A.W. , 2013. A first-in-human, first-in-class, phase I study of carlumab (CNTO 888), a human monoclonal antibody against CC–chemokine ligand 2 in patients with solid tumors. Cancer Chemother. Pharmacol. 71, 1041–1050. [DOI] [PubMed] [Google Scholar]
- Schaner, M.E. , Ross, D.T. , Ciaravino, G. , Sorlie, T. , Troyanskaya, O. , Diehn, M. , Wang, Y.C. , Duran, G.E. , Sikic, T.L. , Caldeira, S. , Skomedal, H. , Tu, I.P. , Hernandez-Boussard, T. , Johnson, S.W. , O'Dwyer, P.J. , Fero, M.J. , Kristensen, G.B. , Borresen-Dale, A.L. , Hastie, T. , Tibshirani, R. , van de Rijn, M. , Teng, N.N. , Longacre, T.A. , Botstein, D. , Brown, P.O. , Sikic, B.I. , 2003. Gene expression patterns in ovarian carcinomas. Mol. Biol. Cell. 14, 4376–4386. [DOI] [PMC free article] [PubMed] [Google Scholar]
- Tsuyada, A. , Chow, A. , Wu, J. , Somlo, G. , Chu, P. , Loera, S. , Luu, T. , Li, X. , Wu, X. , Ye, W. , Chen, S. , Zhou, W. , Yu, Y. , Wang, Y.-Z. , Ren, X. , Li, H. , Scherle, P. , Kuroki, Y. , Wang, S.E. , 2012. CCL2 mediates crosstalk between cancer cells and stromal fibroblasts that regulates breast cancer stem cells. Cancer Res. 2768–2779. [DOI] [PMC free article] [PubMed] [Google Scholar]
- Vergara, D. , Merlot, B. , Lucot, J.-P. , Collinet, P. , Vinatier, D. , Fournier, I. , Salzet, M. , 2010. Epithelial–mesenchymal transition in ovarian cancer. Cancer Lett. 291, 59–66. [DOI] [PubMed] [Google Scholar]
- Zhang, J. , Patel, L. , Pienta, K.J. , 2010. CC chemokine ligand 2 (CCL2) promotes prostate cancer tumorigenesis and metastasis. Cytokine Growth Factor Rev. 21, 41–48. [DOI] [PMC free article] [PubMed] [Google Scholar]
Associated Data
This section collects any data citations, data availability statements, or supplementary materials included in this article.
Supplementary Materials
The following is the supplementary data related to this article:
Supplementary data