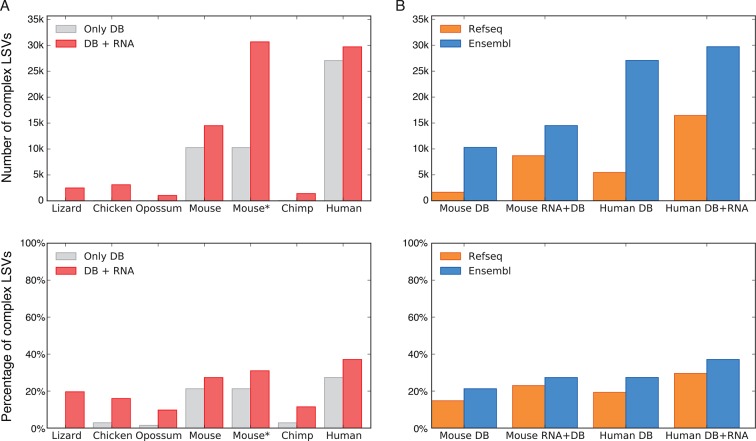
Figure 3. LSV prevalence across diverse metazoans.
(A) Number of LSVs (top) and fraction of complex LSVs (bottom) when using Ensembl annotated transcripts only (grey) or combining it with RNA-Seq from 5–6 similar tissues (red). Mouse* is the dataset from Zhang et al. (2014). (B) Number of LSVs (top) and fraction of complex LSVs (bottom) when using RefSeq (orange) and Ensembl (blue). The RNA-Seq dataset is the same as in (A).

