

Abstract
This study assessed the temporal relationship between elevated blood pressure (BP) and arterial stiffness in a biracial (black-white) cohort of middle-aged adults aged 32–51 years from the semirural community of Bogalusa, Louisiana. Measurements of aortic-femoral pulse wave velocity (afPWV; n = 446) and large- and small-arterial compliance (n = 381) were obtained at 2 time points between 2000 and 2010, with an average follow-up period of 7 years. A cross-lagged path analysis model was used to examine the temporal relationship of elevated BP to arterial stiffness and elasticity. The cross-lagged path coefficients did not differ significantly between blacks and whites. The path coefficient (ρ2) from baseline BP to follow-up afPWV was significantly greater than the path coefficient (ρ1) from baseline afPWV to follow-up BP (ρ2 = 0.20 vs. ρ1 = 0.07 (P = 0.048) for systolic BP; ρ2 = 0.19 vs. ρ1 = 0.05 (P = 0.034) for diastolic BP). The results for this 1-directional path from baseline BP to follow-up afPWV were confirmed, although marginally significant, by using large- and small-artery elasticity measurements. These findings provide strong evidence that elevated BP precedes large-artery stiffening in middle-aged adults. Unlike the case in older adults, the large-arterial wall is not stiff enough in youth to alter BP levels during young adulthood.
Keywords: arterial elasticity, arterial stiffness, blood pressure, longitudinal analysis, temporal relationships
Editor's note:An invited commentary on this article appears on page 609.
Hypertension and vascular stiffness contribute to morbidity and mortality from coronary heart disease, stroke, heart failure, and renal disease (1, 2). Blood pressure (BP) levels and arterial elasticity measures are hypertension-related traits and are influenced by aging processes and cardiovascular risk factors (3–6). The strong association between arterial stiffening and elevated BP levels suggests that this functional relationship is probably bidirectional, based on vascular biology and hemodynamics. The concept that arterial stiffness increases systolic BP, leading to an increase in pulse pressure due to alterations of the “buffering” function of the conduit arteries in older individuals, has been well established. However, existing data are inconsistent regarding whether elevated BP accelerates arterial stiffening during childhood and early adulthood due to increased “wear and tear” on the artery walls, subsequently leading to an increase in arterial stiffness (2, 7, 8). In particular, it is inadequately understood whether the answer to this “chicken-and-egg” question differs by age period during the development of hypertension.
The Bogalusa Heart Study, a biracial (black-white), community-based long-term investigation of the early natural history of cardiovascular disease beginning in childhood (9), provides a longitudinal database with both BP and arterial vascular alteration measurements. Utilizing data from this longitudinal cohort study, we examined the temporal relationship between elevated BP levels and vascular stiffening during young adulthood.
METHODS
Study cohort
In the community of Bogalusa, Louisiana, 584 adult subjects were evaluated twice for aortic-femoral pulse wave velocity (afPWV), arterial elasticity measures, and cardiovascular risk factors at both baseline and follow-up examinations conducted during 2000–2002 and 2008–2010, respectively. After exclusion of 138 hypertensive persons who were receiving treatment at either baseline or follow-up, 446 subjects (342 whites and 104 blacks; 41.9% male; mean age = 43.3 years; age range 31.5–50.9 years at follow-up) were included in this analysis, with a follow-up period of 6.8 years, on average (range, 6.1–8.7 years). Among these 446 study subjects, there were still 78 hypertensive persons included in the analysis who were not receiving antihypertensive treatment. In addition, 381 subjects (277 whites and 104 blacks; 40.4% male; mean age = 44.5 years; age range 33.3–51.3 years at follow-up) had baseline and follow-up measurements of large- and small-arterial compliance available, with a follow-up period of 7.0 years, on average (range, 6.0–8.9 years). This sample (n = 381) was used to confirm the results for the BP-afPWV temporal relationship. In these 2 cohorts, a subset of 286 subjects had both afPWV and arterial compliance measurements available.
All subjects in this study gave informed consent for each examination. Study protocols were approved by the Institutional Review Board of the Tulane University Health Sciences Center (New Orleans, Louisiana).
BMI and BP measurements
Replicate measurements of height and weight were obtained, and the mean values were used for analysis. Body mass index (BMI; weight in kilograms divided by the square of height in meters) was used as a measure of overall adiposity. BP levels were measured by 2 trained observers (3 replicates each) between 8:00 am and 10:00 am on subjects’ right arms while they rested in a relaxed, sitting position. Systolic blood pressure (SBP) and diastolic blood pressure (DBP) were recorded using a mercury sphygmomanometer. The fifth Korotkoff phase was used for DBP. The mean values of the 6 readings were used for analysis. Hypertension was defined as SBP ≥140 mm Hg or DBP ≥90 mm Hg or use of antihypertensive medication at the time of examination.
Aortic-femoral pulse wave velocity
We measured afPWV using a Toshiba digital ultrasound instrument (Xario SSA-660A; Toshiba America Medical Systems, Tustin, California). A nondirectional transcutaneous Doppler flow probe (Toshiba PSK25AT, 2.5 MHz; Toshiba America Medical Systems) was positioned at the suprasternal notch, and another probe (Toshiba PCK703AT, 7.5 MHz; Toshiba America Medical Systems) was positioned at the left femoral artery with the subject lying in a supine position. A computer system displayed and recorded output from the electrocardiogram and the 2 Doppler probes. The arterial flow waves from the 2 arterial sites were recorded, and the output was captured and stored in the computer system for subsequent scoring. After collection of the waveform data, the distance between the aorta and femoral arteries was measured with a caliper instrument to reduce the influence of body contours on the distance measured. The software averages the selected waveforms and determines the time from the R wave of the electrocardiogram to the foot of each waveform. The difference in timing between the 2 waves represents the time component of the velocity equation. We then calculated afPWV by dividing the distance traveled by the time differential between the 2 waveforms (10). In 46 re-screenees, afPWV was remeasured for reproducibility analysis. The correlation between the 2 measurements was 0.91 on the same day and 0.68 on different days. The day-to-day variations were influenced by both measurement errors and physiological fluctuations.
Pulsatile arterial function
Radial arterial pulse pressure waveforms were recorded by an acoustic transducer using the HD/PulseWave CR-2000 Research Cardiovascular Profiling System (Hypertension Diagnostics, Inc. (HDI), Eagan, Minnesota). A wrist stabilizer was used to gently immobilize the right wrist and stabilize the radial artery during measurements. For each subject, pressure waveforms were recorded for 30 seconds in the supine position, digitized at 200 samples per second, and stored in a computer. A modified windkessel (“air chamber”) model of the circulation was used to match the diastolic pressure decay of the waveforms and to quantify changes in arterial waveform morphology in terms of large-artery (capacitive) compliance (C1, representative of the aorta and major branches), small-artery (oscillatory) compliance (C2, representative of the distal part of the circulation, including small arteries and arterioles), and systemic vascular resistance (SVR; mean arterial pressure divided by cardiac output) (11). Four measurements were taken for each subject, and the mean values were used in the analyses. The intraclass correlation of the 4 measurements was 0.71 for C1, 0.85 for C2, and 0.93 for SVR. Considering that mean arterial pressure is included as a function of BP in the calculation of C1 and C2 by the HDI device, C1 × SVR (C1R) and C2 × SVR (C2R) were used in the current analysis to separate the BP component from the waveform information. C1R and C2R are measures closely related to large- and small-artery elasticity, respectively. Unlike the afPWV, for which a higher value is worse, higher values of C1R and C2R represent better vascular function.
Statistical methods
Analyses of covariance were performed using generalized linear models to test differences in continuous variables between blacks and whites and to calculate covariate-adjusted least-squares mean yearly rates of change in BP, afPWV, C1R, and C2R during the follow-up period.
The longitudinal changes in BP, afPWV, C1R, and C2R measured at 2 time points can be modeled using a cross-lagged panel design. Cross-lagged panel analysis is a form of path analysis that simultaneously examines reciprocal, longitudinal relationships among a set of intercorrelated variables (12–15). A simplified, conceptual version of the model used in the current analysis is presented in the figures and tables. The path with ρ1 describes the effect of baseline arterial function measures (afPWV, C1R, and C2R) on subsequent BP, and the path with ρ2 describes the effect of baseline BP on subsequent arterial function measures. Prior to cross-lagged path analysis, the baseline and follow-up values of BP, afPWV, C1R, and C2R were adjusted for age, sex, BMI, heart rate, smoking, and diabetes in regression residual analyses and then standardized with z-transformation (mean = 0; standard deviation, 1) by race/ethnicity. Pearson correlation coefficients for the z-transformed quantitative variables of BP, afPWV, C1R, and C2R at baseline and follow-up were calculated, adjusted for duration of follow-up (years). The cross-lagged path coefficients (ρ1 and ρ2) in the path diagrams were estimated simultaneously based on the correlation matrix using the maximum likelihood method with the software program LISREL, version 8.52 (15, 16). The validity of model fitting was evaluated by means of a goodness-of-fit χ2 test and the comparative fitness index. The temporal relationships of SBP and DBP with afPWV, C1R, and C2R were examined in separate models. The difference between ρ1 and ρ2 derived from the standardized variables (z scores) was tested using Fisher's z test as described in a previous article (17). Although the significance of an individual ρ1 or ρ2 value suggests a directional relationship, a significant difference between ρ1 and ρ2 provides stronger evidence for a temporal relationship between BP and arterial function measures.
RESULTS
Table 1 shows mean levels of study variables at baseline and follow-up, by race/ethnicity. The mean levels of continuous variables were compared between racial/ethnic groups, adjusting for sex and age (except age itself). BMI, heart rate, and prevalence of smoking did not differ significantly between racial/ethnic groups; however, blacks had a significantly higher prevalence of type 2 diabetes than whites. Baseline and follow-up values of SBP, DBP (blacks > whites), C1, C2 (blacks < whites), and SVR (blacks > whites) showed significant racial differences; afPWV differed significantly by race/ethnicity (blacks > whites) at baseline only.
Table 1.
Characteristics of Study Participants at Baseline and Follow-up, by Race/Ethnicity, Bogalusa Heart Study, 2000–2010
| Characteristica | Whites (n = 342) |
Blacks (n = 104) |
P Valueb | Total (n = 446) |
|||
|---|---|---|---|---|---|---|---|
| Mean (SD) | % | Mean (SD) | % | Mean (SD) | % | ||
| Baseline | |||||||
| Age, years | 36.8 (4.2) | 35.6 (4.4) | 0.109 | 36.5 (4.3) | |||
| BMIc | 27.7 (5.8) | 28.7 (6.9) | 0.170 | 27.9 (6.1) | |||
| HR, beats/minute | 68.0 (8.4) | 69.5 (9.6) | 0.150 | 68.3 (8.7) | |||
| Smoking | 24.6 | 31.7 | 0.146 | 26.2 | |||
| Diabetes | 3.7 | 6.3 | 0.042 | 4.5 | |||
| SBP, mm Hg | 111.5 (10.2) | 116.9 (12.6) | <0.001 | 112.7 (11.0) | |||
| DBP, mm Hg | 75.8 (7.7) | 78.5 (9.1) | <0.001 | 76.5 (8.2) | |||
| afPWV, m/second | 5.1 (0.8) | 5.3 (1.0) | 0.008 | 5.1 (0.8) | |||
| C1,d mL/mm Hg × 10e | 15.6 (4.2) | 14.4 (4.3) | 0.012 | 15.3 (4.3) | |||
| C2,d mL/mm Hg × 100e | 6.7 (2.6) | 5.5 (2.5) | <0.001 | 6.3 (2.6) | |||
| SVR, dynes·second·cm−5 e | 1,297 (235) | 1,403 (284) | <0.001 | 1,326 (253) | |||
| Follow-up | |||||||
| Age, years | 43.6 (4.4) | 42.4 (4.5) | 0.024 | 43.3 (4.4) | |||
| BMI | 28.9 (6.1) | 30.1 (7.4) | 0.108 | 29.2 (6.4) | |||
| HR, beats/minute | 69.7 (8.9) | 71.4 (9.6) | 0.126 | 70.1 (9.1) | |||
| Smoking | 24.9 | 31.7 | 0.164 | 26.5 | |||
| Diabetes | 7.2 | 12.5 | 0.026 | 8.4 | |||
| SBP, mm Hg | 113.5 (11.7) | 120.5 (15.2) | <0.001 | 115.2 (13.0) | |||
| DBP, mm Hg | 79.3 (7.9) | 82.9 (11.0) | <0.001 | 80.1 (8.9) | |||
| afPWV, m/second | 6.9 (2.1) | 7.0 (1.9) | 0.328 | 6.9 (2.0) | |||
| C1, mL/mm Hg × 10e | 15.2 (4.4) | 13.2 (4.4) | <0.001 | 14.7 (4.5) | |||
| C2, mL/mm Hg × 100e | 6.2 (2.8) | 4.8 (2.1) | <0.001 | 5.8 (2.7) | |||
| SVR, dynes·second·cm−5 e | 1,358 (249) | 1,530 (339) | <0.001 | 1,405 (287) | |||
Abbreviations: afPWV, aortic-femoral pulse wave velocity; BMI, body mass index; DBP, diastolic blood pressure; HR, heart rate; SBP, systolic blood pressure; SVR, systemic vascular resistance.
a Unless otherwise noted, the total number of subjects was 446 (342 whites and 104 blacks), with 148 males and 194 females among whites and 39 males and 65 females among blacks.
b P values for racial/ethnic differences in continuous variables were adjusted for sex and age (except age itself).
c Weight (kg)/height (m)2.
d C1, large-artery (capacitive) compliance; C2, small-artery (oscillatory) compliance.
e The total number of subjects was 381 (277 whites and 104 blacks), with 116 males and 161 females among whites and 38 males and 66 females among blacks.
Analyses of the temporal relationship of SBP and DBP with afPWV, C1R, and C2R were performed in separate models by race/ethnicity, with adjustment for age, sex, BMI, heart rate, smoking, diabetes, and duration of follow-up. Cross-lagged path coefficients from the 6 models did not differ significantly between blacks and whites, as presented in Appendix Table 1.
Cross-lagged path coefficients for the total sample are given in Table 2. After adjustment for age, sex, race/ethnicity, BMI, heart rate, smoking, diabetes, and duration of follow-up, the path coefficients (ρ2) from baseline SBP or DBP to follow-up afPWV were significantly greater than the path coefficients (ρ1) from baseline afPWV to follow-up SBP or DBP. In BP-C1R analysis models, the paths of SBP → C1R (ρ2 =−0.11, P = 0.056) and DBP → C1R (ρ2 = −0.10, P = 0.068) were marginally significant; the difference between ρ1 and ρ2 in the DBP-C1R model was significant (P = 0.019). In BP-C2R analysis models, the paths of C2R → SBP (ρ1 =−0.08, P = 0.057) and DBP → C2R (ρ2 = −0.09, P = 0.053) were marginally significant; the paths of SBP → C2R and C2R → DBP were not significant. The difference between ρ1 and ρ2 was not significant in the BP-C2R models. Based on the model-fitting parameters, P values were less than 0.001 in χ2 goodness-of-fit tests for all models, indicating a difference between the hypothesized models and the observed data. However, this was probably due to the high sensitivity of the χ2 test to a large sample size. Comparative fit index values ranged from 0.88 to 0.96, indicating a good fit to the observed data in 4 of the 6 models according to the standard criterion of a comparative fit index of 0.90.
Table 2.
Cross-Lagged Path Coefficients for the Association of Blood Pressure With Aortic-Femoral Pulse Wave Velocity (n = 446) and Artery Elasticity (n = 381) in the Total Sample, With Adjustment for Covariates,a Bogalusa Heart Study, 2000–2010
| Model | Path Coefficient |
Model Goodness of Fit |
|||
|---|---|---|---|---|---|
| ρ1b | ρ2c | P Valued | P Valuee | CFI | |
| SBP-afPWV | 0.07 | 0.20f | 0.048 | <0.001 | 0.94 |
| DBP-afPWV | 0.05 | 0.19f | 0.034 | <0.001 | 0.92 |
| SBP-C1Rg | −0.02 | −0.11 | 0.214 | <0.001 | 0.88 |
| DBP-C1R | 0.07 | −0.10 | 0.019 | <0.001 | 0.91 |
| SBP-C2Rg | −0.08 | −0.06 | 0.782 | <0.001 | 0.89 |
| DBP-C2R | −0.05 | −0.09 | 0.580 | 0.002 | 0.96 |
Abbreviations: afPWV, aortic-femoral pulse wave velocity; CFI, comparative fitness index; DBP, diastolic blood pressure; SBP, systolic blood pressure.
a Covariates included age, sex, body mass index, heart rate, smoking, diabetes, and duration of follow-up.
b ρ1 describes the path from baseline measures of arterial function (afPWV, C1R, and C2R) to follow-up BP.
c ρ2 describes the path from baseline BP to follow-up measures of arterial function (afPWV, C1R, and C2R).
d P value for difference between ρ1 and ρ2.
e P value for χ2 test of model fitting.
f For ρ1 and ρ2 being different from 0, P < 0.01.
g C1R, large-artery (capacitive) compliance × systemic vascular resistance; C2R, small-artery (oscillatory) compliance × systemic vascular resistance.
Figure 1 provides detailed parameter information on cross-lagged path analysis models of the association of SBP and DBP with afPWV in the total sample, with adjustment for age, sex, race/ethnicity, BMI, heart rate, smoking, diabetes, and duration of follow-up. The variance of follow-up BP explained by baseline predictors was greater than that of follow-up afPWV. Tracking correlation over time was much lower for afPWV than for BP. There was no change in device, protocol, or method of measuring BP, afPWV, or arterial elasticity between baseline and follow-up. The only possible explanation for the lower tracking correlation (r = 0.13) is that afPWV increased more over the years and had a relatively greater measurement error.
Figure 1.
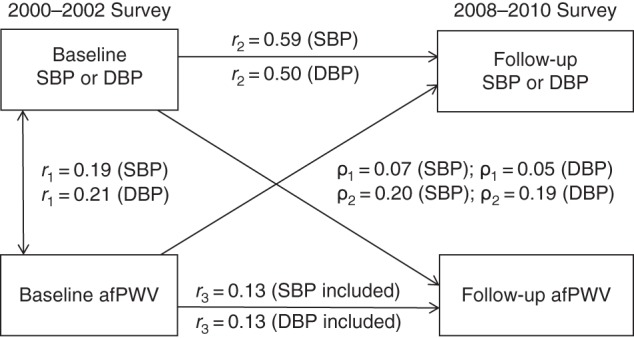
Cross-lagged path analysis models for the association of systolic blood pressure (SBP) and diastolic blood pressure (DBP) with aortic-femoral pulse wave velocity (afPWV) in the total sample (n = 446), Bogalusa Heart Study, 2000–2010. Results were adjusted for race/ethnicity, age, sex, body mass index, heart rate, smoking, diabetes, and duration of follow-up. ρ1, cross-lagged path coefficient from baseline afPWV to follow-up blood pressure (BP); ρ2, cross-lagged path coefficient from baseline BP to follow-up afPWV. r1 represents synchronous correlations; r2 and r3 represent tracking correlations. Variance of follow-up BP explained: R2 = 0.36 (SBP) and R2 = 0.25 (DBP). Variance of follow-up afPWV explained: R2 = 0.08 (SBP included) and R2 = 0.08 (DBP included). For r1, r2, ρ1, and ρ2 being different from 0 for SBP and DBP, P < 0.01; for r3 being different from 0 for SBP and DBP, P < 0.05; for difference in SBP between ρ1 and ρ2, P = 0.048; and for difference in DBP between ρ1 and ρ2, P = 0.034.
Figure 2 provides detailed parameter information on cross-lagged path analysis models of the association of SBP and DBP with C1R in the total sample, with adjustment for age, sex, race/ethnicity, BMI, heart rate, smoking, diabetes, and duration of follow-up. The variance of follow-up BP explained by baseline predictors was greater than that of follow-up C1R. Tracking correlation over time was stronger for BP than for C1R.
Figure 2.
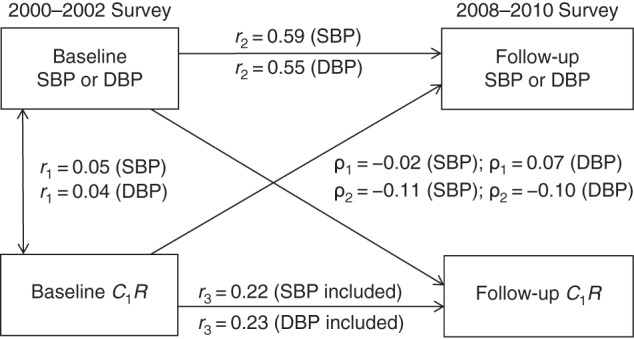
Cross-lagged path analysis models for the association of systolic blood pressure (SBP) and diastolic blood pressure (DBP) with large-artery elasticity (C1R) in the total sample (n = 381), Bogalusa Heart Study, 2000–2010. Results were adjusted for race/ethnicity, age, sex, body mass index, heart rate, smoking, diabetes, and duration of follow-up. ρ1, cross-lagged path coefficient from baseline C1R to follow-up blood pressure (BP); ρ2, cross-lagged path coefficient from baseline BP to follow-up C1R. r1 represents synchronous correlations; r2 and r3 represent tracking correlations. Variance of follow-up BP explained: R2 = 0.36 (SBP) and R2 = 0.31 (DBP); variance of follow-up C1R explained: R2 = 0.16 (SBP included) and R2 = 0.12 (DBP included). For r2 and r3 being different from 0 for SBP and DBP, P < 0.01; for difference in SBP between ρ1 and ρ2, P = 0.214; and for difference in DBP between ρ1 and ρ2, P = 0.019.
Figure 3 provides detailed parameter information on cross-lagged path analysis models of the association of SBP and DBP with C2R in the total sample, with adjustment for age, sex, race/ethnicity, BMI, heart rate, smoking, diabetes, and duration of follow-up. The variance of follow-up BP explained by baseline predictors was greater than that of follow-up C2R. Tracking correlation over time was stronger for BP than for C2R.
Figure 3.
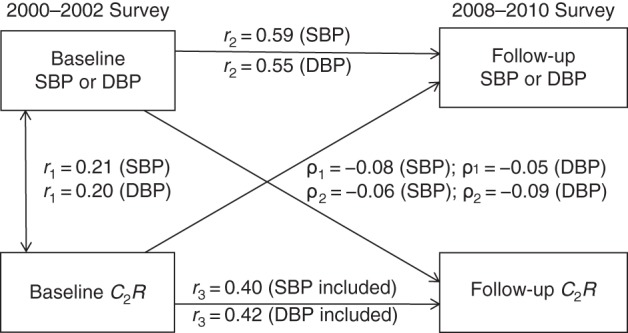
Cross-lagged path analysis models for the association of systolic blood pressure (SBP) and diastolic blood pressure (DBP) with small-artery elasticity (C2R) in the total sample (n = 381), Bogalusa Heart Study, 2000–2010. Results were adjusted for race/ethnicity, age, sex, body mass index, heart rate, smoking, diabetes, and duration of follow-up. ρ1, cross-lagged path coefficient from baseline C2R to follow-up blood pressure (BP); ρ2, cross-lagged path coefficient from baseline BP to follow-up C2R. r1 represents synchronous correlations; r2 and r3 represent tracking correlations. Variance of follow-up BP explained: R2 = 0.36 (SBP) and R2 = 0.33 (DBP); variance of follow-up C2R explained: R2 = 0.17 (SBP included) and R2 = 0.19 (DBP included). For r1, r2, and r3 being different from 0 for SBP and DBP, P < 0.01.
Figure 4 illustrates yearly rates of change (adjusted for race/ethnicity, sex, age, BMI, heart rate, smoking, and diabetes) in afPWV and SBP according to quartiles of their baseline values in the total sample. The rate of change in afPWV during the follow-up period significantly increased across increasing quartiles of baseline SBP (P = 0.017) (Figure 4A). However, the covariate-adjusted rate of change in SBP did not show a significantly increasing trend across quartiles of baseline afPWV (Figure 4B). The rates of change in DBP and afPWV (data not shown) had trend patterns similar to those noted for SBP and afPWV. The results for rates of change shown in Figure 4 were consistent with the BP → afPWV 1-directional relationship in the cross-lagged path analyses shown in Table 2 and Figure 1.
Figure 4.

Yearly rates of change (Δ) in aortic-femoral pulse wave velocity (afPWV) (A) and systolic blood pressure (SBP) (B) according to quartiles of their baseline values in the total sample (n = 446), Bogalusa Heart Study, 2000–2010. Results were adjusted for race/ethnicity, sex, age, body mass index, heart rate, smoking, and diabetes. P-trend = 0.017 for ΔafPWV; P-trend = 0.340 for ΔSBP.
Figure 5 illustrates yearly rates of change (adjusted for race/ethnicity, sex, age, BMI, heart rate, smoking, and diabetes) in C1R and SBP according to quartiles of their baseline values. As can be seen in Figure 5A, the trend in the rate of decrease in C1R during the follow-up period was borderline significant (P = 0.052) across increasing quartiles of baseline SBP. On the other hand, the decreasing trend was not significant for the rate of change in SBP by increasing quartile of baseline C1R (Figure 5B). The rates of change in DBP and C1R (data not shown) had similar trend patterns as those noted for SBP and C1R. The results for yearly rates of change in SBP and C1R by their baseline quartiles shown in Figure 5 were consistent with the parameters of the cross-lagged path analyses shown in Table 2 and Figure 2. Note that C1R is a measure related to large-artery elasticity; the annual ΔC1R was calculated as the follow-up value minus the baseline value, divided by the duration of follow-up. Therefore, the greater absolute value of the negative ΔC1R is worse with respect to vascular function.
Figure 5.

Yearly rates of change (Δ) in large-artery elasticity (C1R) (A) and systolic blood pressure (SBP) (B) according to quartiles of their baseline values in the total sample (n = 381), Bogalusa Heart Study, 2000–2010. Results were adjusted for race/ethnicity, sex, age, body mass index, heart rate, smoking, and diabetes. P-trend = 0.052 for ΔC1R; P-trend = 0.746 for ΔSBP.
Figure 6 illustrates yearly rates of change (adjusted for race/ethnicity, sex, age, BMI, heart rate, smoking, and diabetes) in C2R and SBP according to quartiles of their baseline values. As can be seen in Figure 6A, the trend in the rate of decrease in C2R during the follow-up period was not significant (P = 0.875) across increasing quartiles of baseline SBP; the trend was also not significant for the rate of change in SBP by increasing quartile of baseline C2R (P = 0.331) (Figure 6B). The rates of change in DBP and C2R (data not shown) had trend patterns similar to those noted for SBP and C2R. The results for yearly rates of change in SBP and C2R by their baseline quartiles shown in Figure 6 were consistent with the parameters of the cross-lagged path analyses shown in Table 2 and Figure 3. C2R is a measure related to small-artery elasticity; as for ΔC1R, the greater absolute value of the negative ΔC2R is worse with respect to vascular function.
Figure 6.

Yearly rates of change (Δ) in small-artery elasticity (C2R) (A) and systolic blood pressure (SBP) (B) according to quartiles of their baseline values in the total sample (n = 381), Bogalusa Heart Study, 2000–2010. Results were adjusted for race/ethnicity, sex, age, body mass index, heart rate, smoking, and diabetes. P-trend = 0.875 for ΔC2R; P-trend = 0.331 for ΔSBP.
DISCUSSION
Although the role of arterial stiffness in isolated systolic hypertension and pulse pressure amplitude has been well documented in elderly populations (1, 2, 18–21), the temporal relationship between arterial stiffening and BP elevation during childhood and early adulthood has been incompletely elucidated. In the present study, we examined the temporal relationship between BP and arterial function measures in a longitudinal cohort of black and white middle-aged adults using a cross-lagged path analysis model, a powerful statistical approach in dissecting a causal relationship between intercorrelated variables. The results indicated that elevated BP preceded increased large-artery stiffness during young adulthood, with blacks and whites showing similar patterns of this 1-directional relationship. These findings on the BP → arterial stiffness pathway were partly confirmed using large- (C1R) and small- (C2R) artery elasticity, as measured by the HDI device, in this longitudinal study cohort. The observations from the current study suggest that the mechanisms underlying the development of hypertension might be different during younger and older age periods.
BP levels and arterial vascular alterations are both influenced by aging processes and cardiovascular risk factors (3–6). In a systematic review of 77 cross-sectional studies in adults, age and BP were found to be consistently, independently associated with aortic pulse wave velocity in 91% and 90% of studies, respectively (3). The Bogalusa Heart Study has shown that BP is one of the important risk factors for arterial stiffness in children and young adults (5, 6). An important question raised by these cross-sectional studies is whether an increase in arterial stiffness precedes increases in BP or vice versa, or whether the relationship is bidirectional. The observations from cross-sectional studies limit inference regarding the temporal relationship between BP and arterial function changes. Although BP has been used as a predictor variable in previous cross-sectional studies (3, 4), it is largely unknown whether changes in mechanical properties of the arterial wall or increased BP occurs first or whether the causal relationship varies in different age periods.
Several longitudinal studies have analyzed the temporal relationship between BP and arterial stiffness and elasticity; however, their results have not been consistent. In the Framingham Study, Kaess et al. (18) found that higher aortic stiffness, forward pressure-wave amplitude, and augmentation index were associated with higher risk of future incident hypertension. However, initial BP was not independently associated with risk of progressive aortic stiffening in a cohort of participants with a mean age of 60 years followed over a 7-year period (18). In another large epidemiologic study, the Atherosclerosis Risk in Communities (ARIC) Study, Liao et al. (19) reported that higher carotid artery stiffness was associated with future incident hypertension in the elderly. The Multi-Ethnic Study of Atherosclerosis (MESA) showed that lower large- and small-artery elasticity (C1 and C2) was associated with incident hypertension in a cohort aged 45–84 years (mean age = 58.1 years) with a mean follow-up time of 4.3 years (20). Other investigators have also reported similar results regarding the relationship between arterial vascular alteration and BP (21–23). In contrast, some studies have shown a relationship between BP and arterial stiffness in an opposite direction; that is, elevated BP resulted in increased arterial stiffening (24–27). Annual rates of progression in pulse wave velocity over a 6-year follow-up period among persons with treated hypertension were significantly higher than in normotensive persons (27). By comparing the ages of participants in the 2 groups of studies mentioned above, one can see that the cohorts for which an arterial vascular alteration–BP relationship was reported were relatively older (18–20, 23) than those in studies reporting a BP–pulse wave velocity relationship (24–27).
Interestingly, a few studies, including ours, found that childhood BP levels predicted adult arterial stiffness (28–30). In our previous longitudinal analysis, childhood systolic BP showed the highest correlation (r = 0.111, P < 0.01) with adult brachial-ankle pulse wave velocity among cardiovascular risk factors (28). The controversy surrounding the temporal relationship between BP and arterial stiffness is mainly explained by the different age groups under study (27, 31). Further, in longitudinal studies, exclusion of hypertension patients receiving pharmacological treatment at baseline favors arterial vascular alteration-to-BP directionality but limits BP-to-arterial vascular alteration directionality, which makes it difficult to detect the temporal relationship consistently.
BP levels and the structure-function properties of the large-arterial wall are highly interrelated during the development of hypertension. The strong association suggests that their temporal relationship is bidirectional, like a “2-way street,” based on vascular wall biology and hemodynamics; that is, they are mutually influenced during the aging process (7, 8). It is generally thought that elevated BP from childhood to young adulthood accelerates arterial stiffness due to increased “wear and tear” on the artery walls, subsequently leading to muscle cell hypertrophy, collagen synthesis in the vascular wall, and fatigue fracture of the elastic elements within the media. In turn, arterial stiffness increases systolic BP, leading to widening of pulse pressure due to alterations in the “buffering” function of the conduit artery walls among older individuals (1, 2, 7, 8). A 1-way direction from elevated BP to increased arterial stiffness was found in the current study cohort of adults aged 32–51 years. Furthermore, a subset of 381 adults had large- and small-arterial compliance measurements available at baseline and follow-up in this study cohort. The decreased arterial elasticity (C1 and C2) measured by the HDI device has been demonstrated to be associated with incident hypertension, cardiovascular disease, stroke, heart failure events, and kidney function decline in MESA (20, 32, 33). In the current study, the 1-way direction of BP to afPWV was partly confirmed using C1R and C2R, measures related to large- and small-artery elasticity, respectively. The observation in this and our previous study (28) supports the notion that elevated BP levels result in an accelerated arterial stiffening process that begins in early life. However, the data do not preclude arterial stiffening resulting in isolated systolic hypertension in older adults.
Blacks outpace other racial/ethnic groups in the United States in terms of prevalence, early onset, and severity of hypertension (34). The black-white difference in BP is seen even in childhood, with blacks showing higher levels and a faster rate of change than whites (35, 36). Furthermore, a greater BP-dependent increase in aortic stiffness in blacks than in whites was observed in a cohort of young adults aged 19–50 years, pointing towards differences in mechanical properties of large arteries between these racial/ethnic groups (37). In the present study cohort of middle-aged adults, blacks showed higher levels of BP, afPWV, and systemic vascular resistance but lower levels of C1 and C2 than whites (Table 1). The black-white difference in C1 and C2 in this study cohort was consistent with the racial/ethnic difference in C1 and C2 observed in the MESA cohort (38). With respect to the temporal parameters, however, the cross-lagged path coefficients (ρ1 and ρ2), as shown in Appendix Table 1, did not differ significantly between blacks and whites, except for ρ2 in the DBP-C1R model. Further studies are needed to understand the temporal relationships between BP and arterial stiffness and elasticity in black and white populations.
This community-based longitudinal cohort study provided a unique opportunity to examine temporal relationships; however, it also had certain limitations. First, exclusion of hypertensive persons receiving pharmacological treatment might have resulted in a loss of information, because these individuals represent a subgroup who, without treatment, would be expected to have the highest BP levels; thus, this may have led to underestimation of the BP–arterial stiffness relationship. Second, the relatively small sample size, especially for blacks, meant that we had limited statistical power to detect the weak-to-moderate associations. Third, data on physical activity, serum lipid concentrations, and diet were either not available or only partly available in the present study cohort, which might have led to bias in the association analyses.
In summary, in a longitudinal assessment of the temporal relationship between BP and vascular stiffness using a cross-lagged path analysis model, we demonstrated that elevated SBP and DBP levels precede increased large-arterial stiffness in middle-aged adults. This 1-directional relationship was supported in part by analyses of the associations between BP and large- and small-artery elasticity. The results suggest that the hemodynamic and vascular functional changes underlying hypertension differ between younger and older age periods in that the arterial wall may not be stiff enough in youth to alter BP levels during young adulthood. These findings underscore the influence of BP elevation on the arterial stiffening process during young adulthood, which improves our understanding of the mechanisms involved and has implications for treating and preventing hypertension by targeting causal factors to delay subsequent arterial stiffening, especially early in life.
ACKNOWLEDGMENTS
Author affiliations: Department of Epidemiology, School of Public Health and Tropical Medicine, Tulane University, New Orleans, Louisiana (Wei Chen, Shengxu Li, Camilo Fernandez, Dianjianyi Sun, Chin-Chih Lai, Tao Zhang, Lydia Bazzano); Department of Epidemiology and Biostatistics, School of Public Health, Peking University Health Science Center, Beijing, China (Dianjianyi Sun); Department of Cardiology, Peking Union Medical College Hospital, Beijing, China (Chin-Chih Lai); Department of Biostatistics, School of Public Health, Shandong University, Jinan, China (Tao Zhang); Preventive Cardiology Program, Cincinnati Children's Hospital Medical Center, Cincinnati, Ohio (Elaine M. Urbina); and Department of Biostatistics and Bioinformatics, School of Public Health and Tropical Medicine, Tulane University, New Orleans, Louisiana (Hong-Wen Deng).
This study was supported by grant 5R01ES021724 from the National Institute of Environmental Health Sciences, grant 2R01AG016592 from the National Institute on Aging, and grant 13SDG14650068 from the American Heart Association. S.L. is a scholar of the Building Interdisciplinary Research in Women's Health program, supported by grant K12HD043451 from the Eunice Kennedy Shriver National Institute of Child Health and Human Development. L.B. was supported by grant R01AG041200 from the National Institute on Aging.
Conflict of interest: none declared.
Appendix Table 1.
Cross-Lagged Path Coefficients for the Association of Blood Pressure With Aortic-Femoral Pulse Wave Velocity (n = 446) and Arterial Elasticity (n = 381), by Race/Ethnicity, With Adjustment for Covariates,a Bogalusa Heart Study, 2000–2010
| Model | Whites (n = 277) |
Blacks (n = 104) |
Racial/Ethnic Difference |
|||||
|---|---|---|---|---|---|---|---|---|
| ρ1b | ρ2c | P Valued | ρ1b | ρ2c | P Valued | P for ρ1 | P for ρ2 | |
| SBP-afPWV | 0.12e | 0.22e | 0.180 | −0.08 | 0.13 | 0.134 | NSf | NS |
| DBP-afPWV | 0.10g | 0.19e | 0.231 | −0.09 | 0.14 | 0.100 | NS | NS |
| SBP-C1Rh | −0.06 | −0.07 | 0.906 | 0.10 | −0.15 | 0.074 | NS | NS |
| DBP-C1R | 0.05 | −0.04 | 0.292 | 0.11 | −0.21g | 0.021 | NS | NS |
| SBP-C2Rh | −0.08 | −0.02 | 0.481 | −0.10 | −0.18g | 0.562 | NS | NS |
| DBP-C2R | −0.08 | −0.08 | 0.986 | 0.03 | −0.16 | 0.174 | NS | NS |
Abbreviations: afPWV, aortic-femoral pulse wave velocity; DBP, diastolic blood pressure; NS, not significant; SBP, systolic blood pressure.
a Covariates included age, sex, body mass index, heart rate, smoking, diabetes, and duration of follow-up.
b ρ1 represents the path from afPWV, C1R, or C2R to BP.
c ρ2 represents the path from BP to afPWV, C1R, or C2R.
d P value for difference between ρ1 and ρ2 within racial/ethnic groups.
e For ρ1 and ρ2 being different from 0, P < 0.01.
f P > 0.05.
g For ρ1 and ρ2 being different from 0, P < 0.05.
h C1R, large-artery (capacitive) compliance × systemic vascular resistance; C2R, small-artery (oscillatory) compliance × systemic vascular resistance.
REFERENCES
- 1.Arnett DK, Evans GW, Riley WA. Arterial stiffness: a new cardiovascular risk factor? Am J Epidemiol. 1994;1408:669–682. [DOI] [PubMed] [Google Scholar]
- 2.O'Rourke MF, Mancia G. Arterial stiffness. J Hypertens. 1999;171:1–4. [DOI] [PubMed] [Google Scholar]
- 3.Cecelja M, Chowienczyk P. Dissociation of aortic pulse wave velocity with risk factors for cardiovascular disease other than hypertension: a systematic review. Hypertension. 2009;546:1328–1336. [DOI] [PubMed] [Google Scholar]
- 4.Mitchell GF, Guo CY, Benjamin EJ et al. Cross-sectional correlates of increased aortic stiffness in the community: the Framingham Heart Study. Circulation. 2007;11520:2628–2636. [DOI] [PubMed] [Google Scholar]
- 5.Urbina EM, Srinivasan SR, Kieltyka RL et al. Correlates of carotid artery stiffness in young adults: the Bogalusa Heart Study. Atherosclerosis. 2004;1761:157–164. [DOI] [PubMed] [Google Scholar]
- 6.Li S, Chen W, Srinivasan SR et al. Influence of metabolic syndrome on arterial stiffness and its age-related change in young adults: the Bogalusa Heart Study. Atherosclerosis. 2005;1802:349–354. [DOI] [PubMed] [Google Scholar]
- 7.Mitchell GF. Arterial stiffness and hypertension: chicken or egg? Hypertension. 2014;642:210–214. [DOI] [PMC free article] [PubMed] [Google Scholar]
- 8.Franklin SS. Arterial stiffness and hypertension: a two-way street? Hypertension. 2005;453:349–351. [DOI] [PubMed] [Google Scholar]
- 9.Berenson GS, McMahan CA, Voors AW et al. Cardiovascular Risk Factors in Children: The Early Natural History of Atherosclerosis and Essential Hypertension. New York, NY: Oxford University Press; 1980:47–123. [Google Scholar]
- 10.Jo CO, Lande MB, Meagher CC et al. A simple method of measuring thoracic aortic pulse wave velocity in children: methods and normal values. J Am Soc Echocardiogr. 2010;237:735–740. [DOI] [PubMed] [Google Scholar]
- 11.Hypertension Diagnostics, Inc. HD/PulseWave CR-2000 Research CardioVascular Profiling System Operator's Manual. Eagan, MN: Hypertension Diagnostics, Inc.; 1999. [Google Scholar]
- 12.Kenny DA. Cross-lagged panel correlation: a test for spuriousness. Psychol Bull. 1975;826:887–903. [Google Scholar]
- 13.Kivimäki M, Feldt T, Vahtera J et al. Sense of coherence and health: evidence from two cross-lagged longitudinal samples. Soc Sci Med. 2000;504:583–597. [DOI] [PubMed] [Google Scholar]
- 14.Li CC. Path Analysis—A Primer. Pacific Grove, CA: Boxwood Press; 1975. [Google Scholar]
- 15.Joreskog K, Sorbom D. LISREL 8.52: Structural Equation Modeling with the SIMPLIS Command Language. Chicago, IL: Scientific Software International; 1993. [Google Scholar]
- 16.Joreskog K, Sorbom D. LISREL 8.52: User's Reference Guide. Chicago, IL: Scientific Software International; 2001. [Google Scholar]
- 17.Chen W, Srinivasan SR, Berenson GS. Path analysis of metabolic syndrome components in black versus white children, adolescents, and adults: the Bogalusa Heart Study. Ann Epidemiol. 2008;182:85–91. [DOI] [PubMed] [Google Scholar]
- 18.Kaess BM, Rong J, Larson MG et al. Aortic stiffness, blood pressure progression, and incident hypertension. JAMA. 2012;3089:875–881. [DOI] [PMC free article] [PubMed] [Google Scholar]
- 19.Liao D, Arnett DK, Tyroler HA et al. Arterial stiffness and the development of hypertension. The ARIC Study. Hypertension. 1999;342:201–206. [DOI] [PubMed] [Google Scholar]
- 20.Peralta CA, Adeney KL, Shlipak MG et al. Structural and functional vascular alterations and incident hypertension in normotensive adults: the Multi-Ethnic Study of Atherosclerosis. Am J Epidemiol. 2010;1711:63–71. [DOI] [PMC free article] [PubMed] [Google Scholar]
- 21.Takase H, Dohi Y, Toriyama T et al. Brachial-ankle pulse wave velocity predicts increase in blood pressure and onset of hypertension. Am J Hypertens. 2011;246:667–673. [DOI] [PubMed] [Google Scholar]
- 22.Dernellis J, Panaretou M. Aortic stiffness is an independent predictor of progression to hypertension in nonhypertensive subjects. Hypertension. 2005;453:426–431. [DOI] [PubMed] [Google Scholar]
- 23.Najjar SS, Scuteri A, Shetty V et al. Pulse wave velocity is an independent predictor of the longitudinal increase in systolic blood pressure and of incident hypertension in the Baltimore Longitudinal Study of Aging. J Am Coll Cardiol. 2008;5114:1377–1383. [DOI] [PMC free article] [PubMed] [Google Scholar]
- 24.Nürnberger J, Dammer S, Opazo Saez A et al. Diastolic blood pressure is an important determinant of augmentation index and pulse wave velocity in young, healthy males. J Hum Hypertens. 2003;173:153–158. [DOI] [PubMed] [Google Scholar]
- 25.Tomiyama H, Yoshida M, Yamada J et al. Arterial-cardiac destiffening following long-term antihypertensive treatment. Am J Hypertens. 2011;2410:1080–1086. [DOI] [PubMed] [Google Scholar]
- 26.Tomiyama H, Hashimoto H, Hirayama Y et al. Synergistic acceleration of arterial stiffening in the presence of raised blood pressure and raised plasma glucose. Hypertension. 2006;472:180–188. [DOI] [PubMed] [Google Scholar]
- 27.Benetos A, Adamopoulos C, Bureau JM et al. Determinants of accelerated progression of arterial stiffness in normotensive subjects and in treated hypertensive subjects over a 6-year period. Circulation. 2002;10510:1202–1207. [DOI] [PubMed] [Google Scholar]
- 28.Li S, Chen W, Srinivasan SR et al. Childhood blood pressure as a predictor of arterial stiffness in young adults: the Bogalusa Heart Study. Hypertension. 2004;433:541–546. [DOI] [PubMed] [Google Scholar]
- 29.Aatola H, Hutri-Kähönen N, Juonala M et al. Lifetime risk factors and arterial pulse wave velocity in adulthood: the Cardiovascular Risk in Young Finns Study. Hypertension. 2010;553:806–811. [DOI] [PubMed] [Google Scholar]
- 30.Koivistoinen T, Hutri-Kähönen N, Juonala M et al. Metabolic syndrome in childhood and increased arterial stiffness in adulthood: the Cardiovascular Risk in Young Finns Study. Ann Med. 2011;434:312–319. [DOI] [PubMed] [Google Scholar]
- 31.Mitchell GF, Wang N, Palmisano JN et al. Hemodynamic correlates of blood pressure across the adult age spectrum: noninvasive evaluation in the Framingham Heart Study. Circulation. 2010;12214:1379–1386. [DOI] [PMC free article] [PubMed] [Google Scholar]
- 32.Duprez DA, Jacobs DR Jr, Lutsey PL et al. Association of small artery elasticity with incident cardiovascular disease in older adults: the Multi-Ethnic Study of Atherosclerosis. Am J Epidemiol. 2011;1745:528–536. [DOI] [PMC free article] [PubMed] [Google Scholar]
- 33.Peralta CA, Jacobs DR Jr, Katz R et al. Association of pulse pressure, arterial elasticity, and endothelial function with kidney function decline among adults with estimated GFR >60 mL/min/1.73 m2: the Multi-Ethnic Study of Atherosclerosis (MESA). Am J Kidney Dis. 2012;591:41–49. [DOI] [PMC free article] [PubMed] [Google Scholar]
- 34.Pickering TG. Hypertension in blacks. Curr Opin Nephrol Hypertens. 1994;32:207–212. [DOI] [PubMed] [Google Scholar]
- 35.Voors AW, Berenson GS, Dalferes ER et al. Racial differences in blood pressure control. Science. 1979;2044397:1091–1094. [DOI] [PubMed] [Google Scholar]
- 36.Manatunga AK, Jones JJ, Pratt JH. Longitudinal assessment of blood pressures in black and white children. Hypertension. 1993;221:84–89. [DOI] [PubMed] [Google Scholar]
- 37.Ferreira AV, Viana MC, Mill JG et al. Racial differences in aortic stiffness in normotensive and hypertensive adults. J Hypertens. 1999;175:631–637. [DOI] [PubMed] [Google Scholar]
- 38.Duprez DA, Jacobs DR Jr, Lutsey PL et al. Race/ethnic and sex differences in large and small artery elasticity—results of the Multi-Ethnic Study of Atherosclerosis (MESA). Ethn Dis. 2009;193:243–250. [PMC free article] [PubMed] [Google Scholar]