

Abstract
In our program to develop non-invasive magnetic resonance imaging (MRI) methods for the diagnosis of Alzheimer’s disease (AD), we have synthesized antibody-conjugated, superparamagnetic iron oxide nanoparticles (SPIONs) for use as an in vivo agent for MRI detection of amyloid-β plaques in AD. Here we report studies in AβPP/PS1 transgenic mice, which demonstrate the ability of novel anti-AβPP conjugated SPIONs to penetrate the blood-brain barrier to act as a contrast agent for MR imaging of plaques. The conspicuity of the plaques increased from an average Z-score of 5.1 ± 0.5 to 8.3 ± 0.2 when the plaque contrast to noise ratio was compared in control AD mice with AD mice treated with SPIONs. The number of MRI-visible plaques per brain increased from 347 ± 45 in the control AD mice, to 668 ± 86 in the SPION treated mice. These results indicated that our SPION enhanced amyloid-β detection method delivers an efficacious, non-invasive MRI detection method in transgenic mice.
Keywords: Magnetic resonance imaging, transgenic mice, superparamagnetic iron oxide nanoparticles
INTRODUCTION
Alzheimer’s disease (AD), a slowly progressive and ultimately terminal neurological disorder, is the most prevalent form of cognitive impairment observed in elderly Americans, affecting more than 5.3 million people [1]. Hallmark histological abnormalities of AD include the deposition of amyloid plaques [2] and fibrillar aggregates of the microtubule associated protein tau [3]. The ‘amyloid cascade hypothesis’ [4, 5] is currently the most widely accepted AD etiology. Fundamental to this hypothesis is the incorrect processing of the amyloid-β protein precursor (AβPP) by γ-secretase, giving rise to the pathological 40–42 amino acid long cleaved peptide known as amyloid-β (Aβ) [6], which results in neurotoxic oligomers and the aggregated fibrils of plaques [7–11]. Genetic mutations associated with early-onset AD have been isolated to chromosome 21 in the gene for AβPP [7, 12], chromosome 14 in the gene for presenilin 1 (PS-1), and chromosome 1 in the gene for presenilin 2 (PS-2) [13]. Transgenic mice bearing these mutated human genes recapitulate most of the characteristic changes seen in humans with AD [14–16].
Because the clinical diagnosis of dementia could be due to other causes, the current definitive diagnosis of AD primarily occurs postmortem with histological findings of sufficient numbers of plaques [17], although recent consensus criteria emphasizing the use of peripheral and imaging biomarkers have increased the specificity and sensitivity of the in vivo diagnosis [18, 19]. Nevertheless, there are significant limits to the ability to longitudinally monitor the progression or treatment of AD because there are currently no FDA approved, non-radioactive techniques in widespread clinical practice that allow the non-invasive detection and measurement of AD pathology in the brains of living subjects. Magnetic resonance imaging (MRI) is widely used in other areas of medicine, including neuroradiology, and MRI instrumentation operating at 1.5–3 Tesla is now widely available in clinical practice. Thus, an MRI method for imaging AD inside the living brain could be widely applied and would open this research area to a great number of quantitative investigations in vivo where the efficacy of treatments could be determined and compared. Although it has been possible for more than a decade [20–31] to perform MRI of plaques in the brains of transgenic mice without the aid of contrast agents, the plaques are so small (<50 μm) that long imaging times (many hours) and very high magnetic fields (>9 T) are usually required in order to achieve the resolution (~60 μm/pixel) [26] and MRI signal to noise ratio needed in order to distinguish the plaques from the noise in the image of the brain tissue.
A method is needed to amplify the inherent magnetic susceptibility difference between the water in the plaque and the surrounding brain tissue so that MRI at lower field strengths, with shorter imaging times, could be used to determine plaque burden, distribution, and size in the clinic in vivo without the use of ionizing radiation. Molecular targeting of the plaques using gadolinium-containing contrast agents has demonstrated ex vivo and in vivo imaging of the Aβ plaques using high-field MRI [32–38, 76]. However, ionic gadolinium complexes can leak toxic Gd3+ ions, have low magnetic relaxivities, and relatively short half-lives. One potential solution is to encapsulate the Gd3+ ions within a fullerene cage [39]. Flourinated small molecules that bind to amyloid plaques can be detected by 19F MRI [40–42] although their low in vivo concentrations make this difficult to translate into human clinical medicine. Alternatively, superparamagnetic iron oxide nanoparticles (SPIONs) have superior magnetic properties [43, 44] and have low toxicity [45] since the contained ferric iron is a normal component of the body and the amounts of iron (~1–10 μM) needed for contrast agent administration are several orders of magnitude below the normal biological concentrations of iron (~5 mM) in the human brain. As an imaging contrast agent available for MRI biomedical applications, SPIONs demonstrate high relaxivity and can be covalently functionalized with antibodies or drug delivery systems [46, 47] avoiding the problems with ionic Gd3+ compounds. Additionally, SPIONs have recently been approved by the FDA for use as contrast agents for liver imaging [45], suggesting that FDA approval for human brain studies is feasible. Our study aims to address this area of AD research by developing an early detection method for AD that could improve prognosis and aid in treatment research.
Like in other neurodegenerative diseases, including multiple sclerosis and Parkinson’s disease [48], AD is accompanied by neuroinflammation [16, 49–51] which is manifested as a marked increase in the presence of activated microglia surrounding the Aβ plaques [52–56]. Since this inflammation compromises the blood-brain barrier (BBB) [57–61], it was logical to expect that suitably targeted, sufficiently-small MRI contrast agents could penetrate the BBB and recognize the Aβ plaques. It followed that one could then image the inflammatory component of AD using MRI [62, 63].
SPIONs targeted to either activated microglia [62, 64], cerebrovascular amyloid [65], or Aβ plaques [66–69] have been used in past attempts to enhance the conspicuity of the lesions in the brains of transgenic mice, but these earlier studies would be difficult to translate into human clinical practice because they were either invasive or required the use of poorly-tolerated osmotic agents, such as mannitol, to open the BBB [66]. Our results show that anti-AβPP conjugated SPIONs can cross the BBB, bind to Aβ plaques, and markedly enhance their contrast in MRI of the brains of our AβPP/PS1 transgenic mice. These non-toxic SPIONs have potential applications to human disease. Since clinical MRI systems with static fields in excess of 3 Tesla are widely available now, this opens the possibility that quantitative in vivo AD research that is non-invasive and non-toxic could finally be realized in humans.
MATERIALS AND METHODS
Reagents and antibodies
EZ Prep, SSC, liquid coverslip, cell conditioning-1 reagent (CC1), ultraView Universal DAB detection kit, and hematoxylin counterstain were obtained from Ventana Medical Systems, Inc. (Tucson, AZ, USA). Thioflavin-S was obtained from Sigma-Aldrich Corp. (St. Louis, MO, USA). Mouse anti-AβPP A4 monoclonal antibody, clone 22C11 was obtained from Millipore (Billerica, MA). Rabbit (polyclonal) anti-amyloid-β and rabbit (polyclonal) anti-amyloid-β precursor protein antibodies were obtained from Invitrogen Corp. (Camarillo, CA, USA). Mouse anti-tau AB-2, clone tau-5, N-hydroxysulfosuccinimide (Sulfo-NHS), and 1-Ethyl-3-[3-dimethylaminopropyl] carbodiimide hydrochloride (EDC) were obtained from Thermo Fisher Scientific (Fremont, CA, USA). Paraffin embedding, sectioning, immunohistochemistry (IHC), and Perl’s staining for iron were performed by TriCore Reference Laboratories (Albuquerque, NM, USA) using the Ventana BenchMark XT IHC/ISH system.
SPION modification
The SiMAG-TCL nanoparticles (Chemicell GmbH, Berlin, Germany) were labeled according to the manufacturer’s suggested protocol. Briefly, 5 mg of nanoparticles were added to 5 ml of double-distilled water. The EDC and Sulfo-NHS were dissolved separately at 1.25 mg in 50 μl of double-distilled water. These solutions were then added to the nanoparticle solution, which was mixed on a rotating mixer for 20 min at room temperature. The pH was adjusted to 8.0 by the addition of approximately 2 ml of 50 mM NaHCO3. Twenty-five μg of the appropriate antibody (either anti-AβPP or anti-tau) was added to the activated nanoparticle solution and mixed on a rotating mixer for 2 h at room temperature. The nanoparticles were washed twice with 10 ml double-distilled water by centrifugation at 7,500× g for 30 min at 4°C. The pellet was resuspended in 120 μl of phosphate buffered saline (PBS; pH 7.4) containing 0.5% fetal bovine serum and stored at 4°C. The iron concentration of the resulting nanoparticle solution was determined by the FerroZine Iron Assay method [70]. The batches of antibody labeled nanoparticles were tested for aggregation over time using a Superconducting Quantum Interference Device Magnetometer (see Acknowledgments). No aggregation of these modified SiMAG nanoparticles was detected. In our experience, these particle solutions were stable for several years when stored at 4°C. Transmission electron microscopy showed that the SPIONs had a core diameter of 9.5 ± 1.0 nm. Dynamic light scattering measurements using a Zetatrac (Microtrac Inc., Largo, FL, USA) indicated that these SPIONs had a zeta potential of –42 mV indicating a positive surface charge which favored passage through the BBB.
Animals
All animal procedures were approved by the UNM IACUC. Six-week old, double transgenic AD mice (B6C3-Tg(APPswe, PSEN1dE9) 85Dbo/Mmjax) were obtained from Jackson Laboratory (Bar Harbor, ME, USA) for these studies. One transgene encoded a mouse/human chimeric amyloid-β (A4) precursor protein containing the double Swedish mutations (APPswe; K595 N/M596 L). The second transgene for human PS1 contained a deletion of exon 9 (dE9) which corresponded to an early-onset form of AD. Expression of both transgenes was driven by a mouse prion promoter. According to the vendor (http://jaxmice.jax.org/strain/004462.html), substantial expression of Aβ peptide and human presenilin was detected after 20 weeks of age, preceding the appearance of numerous plaques in the hippocampus and cortex by 9 months of age; astrocytosis was measurable by 12 months and by 13 months these animals showed significant cognitive impairment. Twelve mice were allowed to progress to AD pathological fruition for 14 months, after which time they were either killed for MRI and histology or treated with either of the two SPION preparations (n = 6) by tail vein injection (vide supra) and were killed 24 h later. The brains were then quickly harvested and fixed in buffered formalin for three days. Brains used for MRI were rehydrated in PBS overnight, embedded in 2% agarose gel containing PBS at pH 7.40, 3 mM NaN3 and stored at 4°C until imaged and then returned to formalin. Plaque densities were measured (vide infra) for all the brains using thioflavin-S staining. The amount of iron injected into the mice (in 100 μl of PBS) was 15.2 μg for the anti-AβPP-SPIONs and 70.7 μg for the anti-tau SPIONs.
Histology
The fixed brains were embedded in paraffin, sectioned into 7 μm thick slices, and mounted on glass slides. Immunohistochemistry to detect plaque was performed by Tricore Reference Laboratories, Inc. (Albuquerque, NM, USA), a CAP certified clinical laboratory, using rabbit anti-human Aβ or mouse anti-human AβPP (clone 22C11) antibodies (See Reagents and Antibodies). Digital images of the brain sections were taken with the aid of a spatially calibrated Zeiss Axiostar-plus microscope equipped with an Axiocam ICc3 firewire camera and Zeiss AxioVs40 Software.
Iron staining of anti-AβPP SPION-treated mouse brain
A tissue rehydration procedure was applied to the brain sections prior to incubation of the slices with the anti-AβPP SPIONs and subsequent Perl’s staining for iron. The tissue rehydration procedure was determined by translating the automated program of the Ventana BenchMark XT IHC/ISH Staining Module into a manual method using the proprietary Ventana bulk reagents (http://www.ventana.com/product/list/30: EZ Prep (Catalog# 950–100), SSC (Sodium citrate, sodium chloride buffer: Catalog# 950–110), CC1 (Cell Conditioning 1: Catalog# 950–124), Liquid Coverslip (Catalog# 650–010), and Reaction Buffer (Tris, acetic acid, proclin 300: Catalog# 950–300)). Paraffin was removed from 7 μm thick brain sections by heating to 75°C for 4 min. EZ Prep was then added to the slide, rinsed off with SSC, and this was repeated once. EZ Prep was added again, covered with Liquid Coverslip, incubated at 75°C for 4 min and rinsed with SSC. Antigen retrieval was performed by adding CC1 and then covering the section with Liquid Coverslip and incubating at 95°C for 8 min. The slides were washed with SSC, after which the sections were layered with CC1, covered with Liquid Coverslip and incubated at 100°C for 8 min. This was repeated with incubation at 100°C for 12 min, washing with Reaction Buffer, incubation in Reaction Buffer at 37°C for 4 min and washing with Reaction Buffer. The slides were then incubated in a solution containing 1.1 ml of Universal DAB Inhibitor in 4.4 ml of Reaction Buffer. The slides were twice incubated at 37°C for 4 min with rinsing in Reaction buffer.
In order to detect the in vitro binding of SPIONs to brain plaques, we incubated the rehydrated sections with 50 μl of an anti-AβPP conjugated SPION solution for 30 min. The slides were washed three times with PBS and allowed to air dry. Control sections were incubated with 50 μl of isotype control SPIONs conjugated to mouse anti-human tau antibodies. The slides were then stained for iron using Perl’s reagent by Tricore, Inc., and examined using a Zeiss Axiostar-plus microscope as above. Perl’s staining of the extracted, fixed brains of the in vivo SPION-treated and control mice was also performed by Tricore, Inc.
Thioflavin-S staining of Aβ plaques
Paraffin removal was accomplished on paraffin-embedded, 7 μm thick sections of AβPP/PS1 mouse brain by heating to 75°C for 4 min. EZ Prep was then added to the slides and rinsed with SSC. The slides were washed once more with SSC and EZ Prep was added and rinsed with SSC. EZ Prep was added again and covered with Liquid Coverslip; the slides were incubated at 75°C for 4 min, rinsed with SSC and rehydrated in double-distilled water at room temperature for 5 min. A fresh, aqueous, 0.5% (w/v) thioflavin-S solution was prepared, filtered through a 45 μm filter [22], and applied to the slides, which were then incubated at room temperature for 5 min. The slides were rinsed with 70% ethanol, rehydrated in double-distilled water at room temperature for 5 min, and air-dried. After mounting the coverslips with Cytoseal XYL (Thermo Scientific, Pittsburgh, PA, USA), the slides were viewed using a Zeiss Axioskop 2 using the fluorescein isothiocyanate filter (Cancer Center Fluorescence Microscopy Facility, University of New Mexico, Albuquerque, NM, USA, http://hsc.unm.edu/crtc/microscopy/).
Magnetic resonance imaging
MRI studies of this line of transgenic mice were carried out at 9.4 Tesla at the Center for Magnetic Resonance Research at the University of Minnesota. The optimal sequence for plaque detection, free from artifacts or signal blooming, was a multiple asymmetric spin echo (mASE) protocol which gave T2-weighted images with a small amount of T2*-weighting [26]. The mASE pulse sequence is a fully-adiabatic spin echo pulse sequence where multiple echoes are acquired at each phase encoding step. This results in multiple, fully-encoded image volumes that can be independently reconstructed then summed together to increase SNR. A receive-only surface coil was used with a matrix of 256 × 96 pixels of 60 μm each (zero-filled to 30 μm each during post-processing) and 32 slices each 120 μm thick. The mASE protocol was used with TR = 2000 ms; TE = 15–90 ms (6 evenly spaced echoes); total acquisition time = 1 h 42 min. The six echoes were individually reconstructed then the resulting image volumes were added together to increase the contrast-to-noise ratio of the plaques. Plaques appeared as hypointense localized regions several pixels in diameter in the brain images due to the decreased T2 value of the plaques relative to the surrounding tissue [26]. One hundred and ninety two MRI slices were analyzed by counting plaques in each slice, and by computing the statistical significance of the intensity in the hypointense plaque core versus the noise level in the surrounding tissue. This latter method produced a statistic commonly called a Z-score, or contrast-to-noise ratio, which is the number of standard deviations the MRI signal decreased in the plaque’s core versus the background noise in the image of the surrounding tissue:
Only plaques with Z-scores greater than 2.5 were considered significant, which implied a p-value of 0.02, i.e., there was less than a 2% probability that a given hypointense region resulted solely from noise in the image. An example showing how these parameters were measured from a given plaque is given in Supplemental Figure 1.
Image analysis
Plaque number and area were measured on the CCD images of the IHC brain sections with the aid of ImageJ software [71] by thresholding and conversion of the images to binary images. The MRI data were analyzed with the aid of ImageJ, MaximDL® (Diffraction Limited, Ottawa, Canada) and Mathematica® (Wolfram Research, Champaign, IL, USA). The 3D plaque distribution data were embedded within a Mathematica-rendered surface plot of the mouse brain generated from coordinates obtained from the Allen Institute for Brain Science (http://www.alleninstitute.org). Briefly, the brain coordinates were stripped of interior points to produce the set of surface points that were then rendered using Delaunay tetrahedra (TetGen Delaunay).
RESULTS
Distribution of plaque sizes in AβPP/PS1 transgenic mouse brains
The number of plaques in the brains of the transgenic mice was determined by IHC optical microscopic examination of coronal brain sections stained with a monoclonal anti-Aβ primary antibody, which revealed the plaques as brown spots (Figs. 1A, 2A). Control sections from wild type, non-AD mouse brains showed a lack of IHC positive regions (Fig. 1B). Although plaques were observed throughout the brain, most of the plaques appeared in the cortex in this slice (Fig. 2A). Plaque counts and areas, determined using ImageJ software (Fig. 2B), showed that more than 90% of the plaques had areas less than 300 μm2 (radius <9.8 μm) but we did observe small numbers (5–15 per 7 μm slice) of plaques with areas up to 4,780 μm2 (radius ~39 μm). A Gaussian fit to the distribution (Fig. 2C) gave a mean plaque radius of 8 μm, corresponding to an area of 227 μm2, and a Gaussian width of 3.5 μm. These plaque sizes compared favorably with data (not shown) measured postmortem from the brains of humans diagnosed with AD (mean radius 8.0 μm, and width 3.5 μm for the Gaussian fit). Wengenack et al. [72] found that AβPP/PS1 transgenic mice show an age-dependent plaque radius that ranges from 4 to 20 μm in mice aged from 3 to 14 months, congruent with these findings.
Fig. 1.

Optical microscopy of AβPP/PS1 and control mouse brains. A) IHC stained cortical section (7 μm thick) of the fixed brain from a transgenic mouse used in these studies. Plaques stained brown with antibodies against human Aβ. The positive DAB signal at the cortical surface could represent some BBB leakage allowing passage of mouse IgGs. Scale bar = 1,000 μm. B) Control brain section from a wild-type mouse showing a complete lack of IHC positive regions. Scale bar = 1,000 μm. C) Section from the brain of a transgenic mouse stained in vitro for iron using Perl’s reagent demonstrating binding of our anti-AβPP conjugated SPIONs to plaque. Scale bar = 20 μm. D) Control brain section from a wild-type mouse demonstrating the lack of blue staining when incubated with the same SPIONs as in (C). Scale bar = 20 μm. E) Perl-stained section of a brain from an AβPP/PS1 transgenic mouse that was injected with anti-AβPP SPIONs. Note the large plaque with its associated SPIONs (arrow). Scale bar = 20 μm. F) Thioflavin-S stained brain section from a transgenic mouse demonstrating the presence of plaques as green regions. Scale bar = 10 μm. G) IHC of a cortical brain section stained for AβPP with the anti-AβPP antibodies used to modify the SPIONs showing plaque detection similar to (A). Scale bar = 10 μm. H) Perl’s stain for iron in an AβPP/PS1 brain showing no iron detection (Compare with (C)). Scale bar = 10 μm.
Fig. 2.

Histological plaque distribution in the AβPP/PS1 mouse brain. A) Optical microscopy of a 7 μm thick coronal section of a transgenic mouse brain stained, via immunohistochemistry, for human Aβ, which revealed the plaques as brown spots. B) A binary image, thresholded using ImageJ, showing the segmentation of the image in (A) into recognized plaques whose areas were subsequently measured. This particular slice contained a total of 198 plaques. C) Distribution of plaque sizes (radii) in the AβPP/PS1 mouse brain. The measured radii are shown as blue circles, while the red curve is a fitted Gaussian with a mean of 8.0 μm and a width of 3.5 μm. A Poisson fit gave essentially the same results as the Gaussian fit.
Plaques as large as ~4,800 μm2 would correspond to a region in the brain approximately 80 μm in diameter whose magnetic susceptibility difference would alter the adjacent water T2. These large plaques should therefore have been detectable with MRI since the area of perturbed water surrounding a plaque would have been approximately two to five 60 μm pixels in the slice dimension. Based on these results, we would have expected to detect only a small fraction of the existing plaques, without the use of contrast agents, in the AD mouse brains by MRI. An estimate of this MRI-observable number, based on the measured statistics of plaque area frequency, corrected for the difference between the optical and MRI slice thickness (7 μm versus 120 μm) was ~25–100 plaques per MRI slice. In fact, the maximum number of plaques per slice detected by MRI was ~40 (vide infra). Jack and colleagues [21] estimated that, at 9.4 T, MRI revealed plaques with a radius > 25 μm and detected ~10–15% of the actual plaque load.
Another method for plaque detection used the fact that plaques displayed green fluorescence when the Aβ peptide aggregates were stained with thioflavin-S [73]. The green, fluorescent aggregates displayed the classical plaque diffuse fibrillar periphery and a dense core structure (Fig. 1F). The size distribution (not shown) of 134 thioflavin-S stained plaques was fit to a Gaussian with a mean of 6.1 μm and width of 2.5 μm. These parameters are somewhat smaller than those found using IHC (vide supra), likely due to the different structures of the thioflavin-S vs. antibody interactions with the plaques; thioflavin-S intercalates into the dense protein core whereas antibodies decorate the plaque surfaces.
SPION binding to AD transgenic mouse brain
We explored a number of antibodies for use in IHC in vitro of both human AD and transgenic mouse brains and found that either anti-Aβ (Fig. 1A) or anti-AβPP (Fig. 1G) but not anti-tau, antibodies produced similar positive staining patterns for the plaques in paraffin-embedded, formalin-fixed tissue sections. Therefore, since attempts to use anti-AβPP antibodies to target plaques in vivo had not previously been reported in the literature, we conjugated our SPIONs with anti-AβPP antibodies in an attempt to use a novel approach. The anti-human AβPP antibodies were covalently attached to the surface of our SPIONs in order to generate a simple, easily-prepared contrast agent that would enhance the amyloid-containing brain lesions in vivo so that these lesions could be more readily observed by MRI. It was first necessary to ascertain that these chemically modified SPIONs would recognize lesions in vitro. Brain sections from both AβPP/PS1 and control mice were incubated with our modified SPIONs and washed and stained for iron using Perl’s reagent. These anti-AβPP conjugated SPIONs specifically bound to the plaques as shown by the blue regions in Fig. 1C. Control brain sections from a wild-type mouse demonstrated no blue staining when incubated with these same nanoparticles (Fig. 1D). In another control experiment, we used the same staining conditions as were used for staining the SPION-treated brains (Perl’s stain only, no diaminobenzidine (DAB) enhancement [74]) on brain tissue from AβPP/PS1 mice that were not treated with anti-AβPP SPIONs. These identical staining conditions showed a complete lack of blue color in 7 μm sections of the untreated brain tissues (Fig. 1H). We were initially surprised by this result because amyloid plaques are known to contain iron [74], but several investigators have found [21, 31, 74, 75] that simple Perl’s staining, without DAB enhancement, does not reveal the small amount of iron present in the cortical plaques from transgenic PS1/AβPP mice.
These histological results confirmed the presence of Aβ plaques, which could be detected with both IHC and thioflavin-S staining, and showed that our modified SPIONs specifically recognized plaques in AD brain sections in vitro. Therefore, there was support for an extension to in vivo studies to determine if the anti-human AβPP conjugated SPIONs were useful as an MRI contrast agent in AD transgenic mice.
MRI of control and SPION treated AβPP/PS1 transgenic mouse brains
Surface coil MR images taken at 9.4 Tesla of thirty 120 μm thick slices from control AβPP/PS1 brains demonstrated the presence of plaques without the aid of a contrast agent (Fig. 3A) as has been previously reported [20–31]. The brain whose MR image is shown in Fig. 3A contained a total of 355 MRI-detected plaques, whose Z-score exceeded 2.5, with a mean Z-score of 4.6 ± 0.6. When the data from this AβPP/PS1 mouse brain were combined with that from the other control brains from non-SPION-treated AβPP/PS1 mice, an average of 13 ± 6 plaques were found per MRI slice, with an average Z-score of 5.1 ± 0.5, and a total of 347 ± 45 plaques per brain. Therefore, the MRI of all of our transgenic mice would be expected to show the presence of this number of plaques if treatment with our anti-human AβPP conjugated SPIONs were not effective at enhancing plaque conspicuity.
Fig. 3.
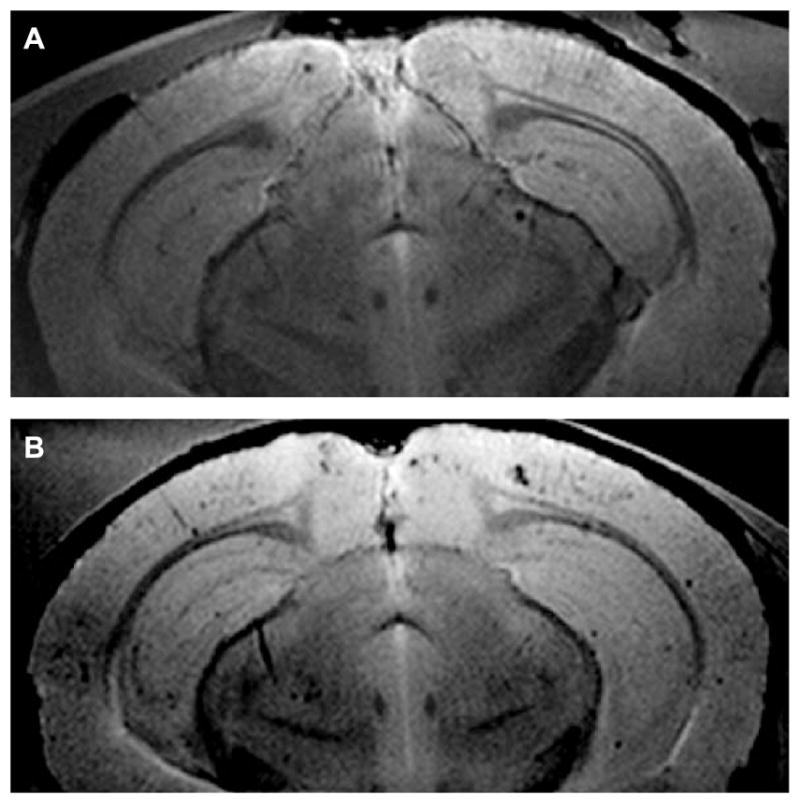
Surface coil MR images of AβPP/PS1 mouse brain at 9.4T. A) One of thirty, 120 μm thick, slices from an AβPP/PS1 mouse brain untreated with SPIONs, which demonstrated the MR imaging of plaques without the aid of a contrast agent. This brain contained 355 plaques whose Z-scores exceeded 2.5. The mean Z-score for this brain was 4.6 (See Fig. 4A–C for the 3D plaque distribution for this brain). B) One of thirty, 120 μm thick, slices from the brain of an AβPP/PS1 transgenic mouse that was treated with the injection of anti-AβPP conjugated SPIONs for 24 h and then sacrificed. Note how the SPIONs enhanced the conspicuity of the plaques. The mean Z-score for this brain was 8.0 (See Fig. 4D–F for the 3D plaque distribution for this brain).
For the MR imaging of brains from transgenic mice treated with SPIONs (Fig. 3B), mice were injected via their tail veins with anti-AβPP conjugated nanoparticles, allowed to roam freely in their cages for 24 h, and then sacrificed. The brains were quickly removed, fixed in formalin, and embedded in agarose. After MRI was completed, the brains were removed from the agarose, embedded in paraffin, and sections were cut and stained for iron. The Perl-stained slices demonstrated that our SPIONs crossed the BBB and decorated plaques in the brain parenchyma, beyond the brain vasculature (Fig. 1E). The arrow directs attention to a representative plaque that was decorated by SPIONs; the diameter of the plaque was about 80 μm which meant that this plaque would easily be seen in the MRI of this brain. The observed diameters of other SPION-decorated plaques in the brains from SPION-treated animals ranged from 10 to 80 μm.
Treatment of the transgenic animals with anti-AβPP SPIONs greatly enhanced the conspicuity of the plaques in the cortical and hippocampal regions as shown by coronal MRI (Fig. 3B). MRI of the brains of SPION-treated mice also revealed a larger number of plaques (29 ± 7 versus 13 ± 6 plaques per slice). This was particularly significant given that optical microscopy of thioflavin-S stained sections showed no significant differences in plaque densities between the SPION-treated (91 ± 5 plaques/mm2) and untreated brains (77 ± 5 plaques/mm2) and that these plaque areal densities were very similar to earlier values (109 ± 10 plaques/mm2) reported by Wengenack et al. [72] for 54-week old transgenic AβPP/PS1 mice.
In addition, MRI showed a larger total plaque count (668 ± 86) and a higher average Z-score (8.3 ± 0.2) in the SPION-treated brains relative to the controls (vide supra). Since Z-scores were very non-linear, these differences were very significant (p < 0.0001). This large difference between control mice without SPION injection and those with injection, in the number of detected Aβplaques and their corresponding pixel densities, once again indicated that our anti-AβPP SPIONs crossed the BBB and bound to the plaques. Also, the SPIONs increased the magnetic susceptibility difference between the plaques and the surrounding brain tissue. The binding of the anti-AβPP SPIONs to the plaques enhanced the T2* effect on the brain water and revealed a larger number of smaller plaques. These functionalized nanoparticles might therefore constitute a viable MRI contrast agent for the detection of AD lesions in vivo.
MRI of AβPP/PS1 transgenic mouse brain in the presence of anti-human tau conjugated SPIONs
The transgenic mice carried the human mutated forms of AβPP and PS1 but carried the wild-type mouse tau protein (see Experimental Procedures for details). Therefore, since the tau protein in these animals was both the murine form and an intracellular molecule inaccessible from the extracellular space, we expected that an isotype control SPION targeted to the human tau protein should not show increased detection of plaques. Mice were injected via their tail veins with anti-tau conjugated SPIONs, allowed to roam freely in their cages for 24 h, and then sacrificed. MRI of transgenic mouse brain after injection of anti-tau SPIONs closely resembled the image shown in Fig. 3A, and revealed 11 ± 4 plaques per MRI slice, with a total of 298 ± 36 per brain. These values were statistically indistinguishable from the non-SPION-treated transgenic controls (p > 0.3).
The 3D MRI-detected plaque distribution of AβPP/PS1 transgenic mice
It was clear from an examination of the large number of brain MR images generated in this study, such as those shown in Fig. 3A, B, that it was difficult to visualize the complete data set from the thirty MRI slices taken from a single brain. One could use modern computer software to scan through the MRI slices one by one, but that would not greatly aid comparisons of the plaque distributions among brains. A Mathematica® notebook for displaying the entire three-dimensional plaque distribution from a single brain was therefore developed. Three views (coronal, sagittal, and transverse) of the complete, MRI-detected 3D plaque distributions produced with the aid of this notebook are shown in Fig. 4(A–C) for transgenic mice untreated with SPIONs. There, the diameters and RGB colors of each plotted sphere were proportional to the Z-score of the plaque located at that set of (x, y, z) coordinates measured from the MR images. Red corresponded to the lowest Z = 2.5, while green, blue, and purple encoded Z-scores up to 20 using a rainbow scale. These plots are available as supplementary data and may be rotated and viewed in 3D with the Mathematica® CDF player (see Supplementary data for details; available online: http://www.j-alz.com/issues/34/vol34-2.html#supplementarydata01).
Fig. 4.

A–C) Three-dimensional displays of the complete plaque distribution in the brain of an AβPP/PS1 mouse untreated with SPIONs. The 3D plaque distribution data were embedded within a Mathematica-rendered surface plot of the mouse brain generated from coordinates obtained from the Allen Institute for Brain Science. The size and color of each sphere was proportional to the Z-score of the plaque located at that set of (x, y, z) coordinates measured from the MR images (given in Fig. 3A) showing that plaques (n = 355) were detected without the aid of a contrast agent (Z = 4.6 ± 0.6). Red corresponded to Z = 2.5, while purple coded Z = 20. The diameter of each sphere gave its Z-score in these coordinates. A) A coronal view of the brain from the front. Note the predominance of lesions in the cortex from this viewpoint. B) A sagittal view of the brain from the left side, the front was to the left. C) A transverse view of the brain from the top, the front was at the bottom. D–F) Three-dimensional displays of the complete plaque distribution in the brain of an AβPP/PS1 mouse treated with anti-human AβPP-conjugated SPIONs. Size and color correlate as in A, B, and C. SPION treatment demonstrated a marked increase in both the number (n = 668) and the Z-score (8.0 ± 0.1) of the detected lesions. D) A coronal view of the brain from the front. E) A sagittal view of the brain from the left side, the front was to the left. F) A transverse view of the brain from the top, the front was at the bottom.
Application of this Mathematica® code to an examination of the MRI data from a transgenic mouse brain without SPION treatment (a slice of whose MR image is given in Fig. 3A) illustrated the detection of Aβ plaques (n = 355, Fig. 4) without the aid of a contrast agent (Z = 5.2 ± 0.2). In accordance with the optical histology shown in Fig. 1A, the majority of the MRI detected plaques were also found in the cortical region of these brains (Fig. 4A). Views of the 3D plaque distribution in the brain of this control mouse from the radiological left side (sagittal) (Fig. 4B) and from the top (transverse) (Fig. 4C) are also shown. The longitudinal fissure between the left and right cerebral hemispheres was visible in the data shown in Fig. 4A, C as a central gap in the plaque distribution.
The 3D MRI-detected plaque distribution of transgenic mice treated with anti-AβPP SPIONs
The 3D MRI data from mice treated with anti-human AβPP-conjugated SPIONs (Fig. 4, D–F) showed a significant increase in both the number (n = 668 ± 86; p < 0.0001) and the Z-score (8.3 ± 0.2; p < 0.002) of the detected lesions compared with the control transgenic mice without SPION injection (Fig. 4A–C). The view from the front of the brain (Fig. 4D) once again showed that most of the MRI-detected lesions appeared in the cortex, but by comparing the data in Fig. 4A with that in Fig. 4C, it can be appreciated that the SPIONs also enhanced the MRI appearance of other brain areas as well. The observed ~2-fold increase in the number of MRI-detected plaques when the control distribution (Fig. 4A–C) was compared with that measured in the presence of anti-human AβPP antibody conjugated SPIONs (Fig. 4D–F) indicated that these SPIONs penetrated the BBB, in agreement with the optical histology shown in Fig. 1(C, E), and were therefore useful as targeted contrast agents that revealed the presence of Aβplaques in the brains of these AβPP/PS1 transgenic mice.
In order to present these 3D data in their most-usable form, we have embedded representative plaque distributions within a brain surface (Fig. 4A–F), generated using Mathematica, from the coordinates of the mouse brain developed by the Allen Institute for Brain Science (http://www.alleninstitute.org). These data can also be viewed and rotated in 3D by downloading the notebooks (Supplementary Figure 2) and using the CDF player noted above. Note that we used a small, high-sensitivity surface coil for the MRI and therefore the images (Fig. 3A, B) and plaque distribution (Fig. 4) did not cover the entire 3D volume of the brain.
Effect of SPIONs on the distribution of MRI-derived Z-scores
Penetration of the BBB and binding of AβPP-targeted SPIONs to plaques in the brains of transgenic mice would be expected to perturb the water MRI signal in the vicinity of the plaques, enhancing the susceptibility-induced darkening of the brain lesions and increasing the Z-score and the number of MRI detected lesions. The averages of these values (vide supra) supported these expectations but further supporting evidence could be found through an examination of the complete plaque and Z-score frequency distributions. Representative, normalized Z-score frequency distributions from a control transgenic mouse without SPIONs (Blue), and a SPION treated transgenic mouse (Red) were fitted to Poisson distributions and displayed the expected increases in both Z-scores (5.2 versus 8.3; Fig. 5A) and total numbers of MRI-detected plaques (355 versus 668; Fig. 5B). Application of Student’s two-tailed t-test with unequal variance to these data gave a probability that they are the same of less than 2 × 10⁻⁷. In aggregate, for all the brains examined with MRI, the average Z-score rose 1.6-fold upon injection of the mice with anti-AβPP-conjugated SPIONs.
Fig. 5.
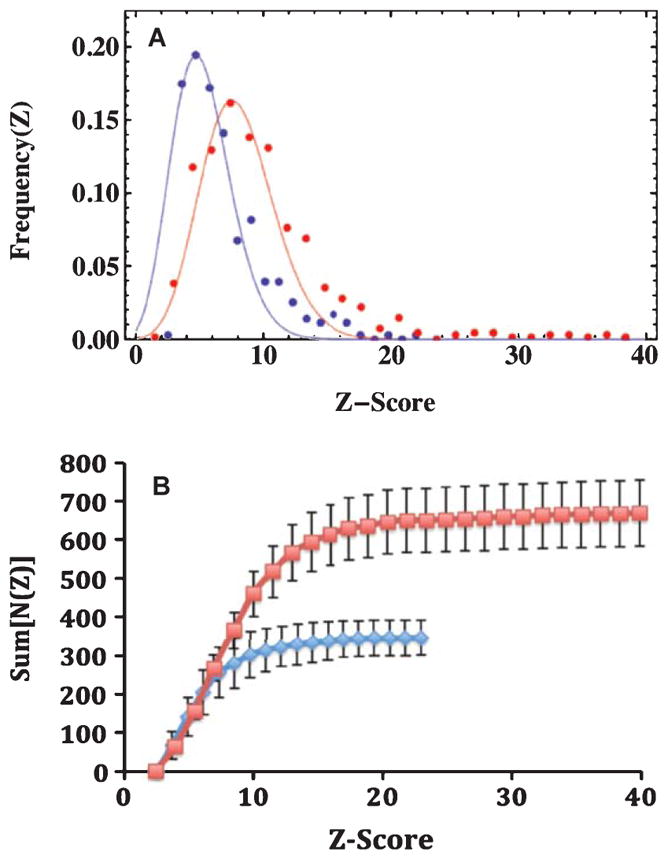
The distribution of Z-scores from the MRI data among brains from the AβPP/PS1 mice imaged for this study. A) Poisson fits to the normalized differential frequency distributions of Z-scores for MRI detected plaques in the brains of AβPP/PS1 mice comparing SPION treatment with controls. The Blue points and curve were data from control mice, with a mean of 5.1 (n = 355 plaques), while the Red points and curve were from mice treated with anti-AβPP SPIONs, with a mean of 8.3 (n = 668 plaques). Note how the presence of SPI-ONs in the brain markedly increased the conspicuity (Z-score) of the plaques. The normalized Z-score data were well fit by Poisson distributions, whose means were the only free parameters of the fits. Once the means were specified, the amplitudes and widths were fixed. The probability that the means of the two distributions were the same was p < 0.0001 as reported by Student’s t-test with unequal variances. B) The integral distributions of the MRI-determined plaque data. The colors indicate the treatment received: Blue diamonds were for control AβPP/PS1 mice, while the Red squares denote the data from AβPP/PS1 mice injected with anti-human AβPP conjugated SPI-ONs. The errors shown are the standard deviations (n = 4). The brains from the SPION injected mice displayed twice as many lesions (668) as the control mice (347) with a marked increase in the maximum Z-score from 23 to 40.
Further examination of the distribution of Z-scores from the MRI data among brains from the transgenic mice imaged for this study revealed additional interesting trends (Fig. 5B). The integral distribution of Z-scores (Fig. 5B) provided a view of both the total number of plaques and the maximum Z-score value. The presence of anti-human AβPP antibody-conjugated SPIONs increased both the total number of MRI-detected plaques from 347 ± 45 to 668 ± 86 (Fig. 5B, Blue versus Red curves) and the maximum Z-score for the mice by 1.6-fold from 24 ± 4 to 38 ± 3 (p < 0.025). Here, as in Fig. 5A, the effect of the penetration of the BBB by the SPIONs was clearly observed.
DISCUSSION
In the present study we have demonstrated a novel MRI contrast agent in an AβPP/PS1 murine model of AD. This model of AD is known to recapitulate the pathological manifestations commonly observed in AD, including a compromise of the BBB [57–61]. Our functionalized SPIONs targeted AD plaques specifically and efficiently, exposing even very small plaques previously only detectable using ex vivo staining methods. The SPIONs were not expected to be toxic because they contained ferric rather than ferrous iron, and the iron concentrations (<5 μM) resulting from their usage was several orders of magnitude below the normal biological iron concentrations in the brain (~5 mM). Additionally, due to their magnetic effectiveness, the SPIONs induced Z-score shifts large enough that MRI detection and quantification of plaques improved significantly.
The doubly transgenic mouse strain used for these studies had mutations in the human forms of both AβPP and PS1 simulating the early onset form of the disease. The time period required for plaque appearance was 6–9 months during which the plaque density in the brain was not actually known. We therefore sacrificed a control, untreated mouse at 12 months and removed its brain in order to confirm the presence of plaques and to measure their properties. In our hands, these mice developed approximately 200, primarily cortical, plaques per 7 μm optical section and these plaques were predominantly less than 300 μm2 in area, although we observed small numbers of plaques with areas up to ~3,500 μm2. The in-plane pixel resolution of high-field (9.4T) MRI was limited to around 60 μm so it was unlikely that we would have been able to detect any but the largest plaques with MRI. Nevertheless, we were able to detect several hundred plaques per brain without contrast enhancement with our multiple asymmetric spin echo image acquisition scheme in agreement with previous investigations [20–31]. Previous investigations of AD mouse brains have led to estimates that only plaques larger than 38 μm [37] or ~50 μm [21] are visible using high-field (>7 T) MRI and that these constitute ~10–15% of the total plaque load [21].
The plaques displayed known histological features, including recognition by anti-human AβPP and Aβ antibodies, fluorescent staining with thioflavin-S, and the presence of activated microglia as detected by immunofluorescence (to be reported separately). These plaques specifically bound anti-AβPP conjugated SPI-ONs in vitro demonstrating the specificity of our particles to plaque. We explored a number of antibodies for use in IHC in vitro of both human AD and transgenic mouse brains and found that either anti-Aβor anti-AβPP, but not anti-tau, antibodies produced similar positive staining patterns for the plaques in paraffin-embedded, formalin-fixed tissue sections. Therefore, since attempts to use anti-AβPP antibodies to target plaques in vivo had not previously been reported in the literature, we conjugated our SPIONs with anti-AβPP antibodies. The antibodies used were specific for human AβPP; the anti-AβPP conjugated SPIONs did not stain normal mouse brain tissue in IHC. These observations supported the specificity of this method for the detection of AD lesions; it is unlikely that lesions resulting from other neurological diseases, such as multiple sclerosis or Huntington’s disease would cross-react with these antibody-conjugated SPIONs.
One of the control experiments performed used anti-tau SPIONs. We prepared anti-tau SPIONs along with the other SPIONs because we wondered if they might reveal associated tau pathology in vivo since these mice might also present with some discrete tau anomalies like accumulation of hyperphosphorylated tau in dystrophic neurites surrounding the plaques. It was found from our early IHC experiments that the various forms of tau were only found inside cells, while the amyloid plaques were deposited outside the cells. This was congruent with the literature and our experience that showed that the anti-tau SPIONs did not stain the plaques in vitro, but PERL’s staining of the transgenic mouse AD brain tissue treated with anti-tau SPIONs only showed intracellular blue color. Since the anti-tau antibodies did not stain the amyloid plaques in vitro, and were of the same isotype (Mouse anti-human IgG1), we believed that they would serve as a stringent isotype control for the anti-AβPP SPIONs. The injection of anti-tau SPIONs did not result in changes in the Z-scores of the AβPP/PS1 mouse brains so that these brains were included in the analysis of the controls. Furthermore, Takeuchi et al. [77] have reported that phospho-tau is only weakly associated with the plaques in these PS1/AβPP transgenic mice.
MR imaging of the brains from control AβPP/PS1 mice showed the expected small hypointense regions previously reported [20–31] for this strain of mice in the absence of contrast agents. This decrease in the water MRI signal arose from the altered magnetic susceptibility of the plaques, which was thought to be due to the presence of proteins, or paramagnetic and other metals [31, 37, 74] bound to the Aβ aggregates that mainly comprise the plaque. The number of MRI-detected plaques (average = 347) in the untreated control brains was constant within ~15% so that we could expect to be able to measure changes in plaque number of about 75 or greater, simply on the basis of statistical criteria.
The MRI-detected plaques appeared dark in our mASE images against the brighter background contributed by the surrounding brain tissue. Manifestation of the SPION’s efficacy was found from the examination of the plaque population Z-scores, or contrast to noise ratio, a commonly used measure of the statistical significance of this signal decrease. We set a lower limit of 2.5 as the cutoff for the consideration of a Z-score as significant. The control AD brains showed a mean Z-score of 5.1, indicating that the water signal in the plaque decreased by about five times the image noise level. If our treatments with SPIONs proved to have no effect on the plaques, then all of the brains from the treated animals would show mean Z-scores close to five. When we treated transgenic mice with anti-human AβPP conjugated SPIONs, the mean Z-score was found to increase to 8.3, a value that was significant at the level of less than one part per million with respect to the controls. The number of MRI-detected plaques approximately doubled in the presence of our anti-human AβPP conjugated SPIONs. The mean maximum Z-score increased from a control value of 24 to 38 in the presence of our active SPIONs. These clear differences between the data from controls and brains treated with SPIONs served as a strong indication that our antibody-conjugated nanoparticles crossed the BBB.
Other reports of the use of SPIONs as contrast agents for the detection of amyloid in vivo [36, 69] have used mannitol to open the BBB, a procedure that is poorly-tolerated in humans. Furthermore, these investigators were unable to detect plaques without contrast agents so that no comparisons were made between the conspicuity of the plaques prior to and after SPION injection.
Although there were still many unknowns as to both mechanism and resulting pathology involved in the disrupted vasculature of AD, there was ample evidence to support its compromise in AD [58, 59]. Findings suggesting that Aβ itself was a component of the basement layer of the BBB [78] and that in AD disrupted microfibrils could be involved, suggested that Aβ itself might be responsible for this breach. Indeed, in our own immunofluorescence microscopy we have found that the endothelial linings of brain blood vessels stained positively for Aβ by thioflavin-S (not shown), a fact that could result in the free penetration of plasma proteins into the brain parenchyma [79]. Anti-Aβ conjugated SPIONs can be used to label vascular amyloid [65]. It is possible that accumulation of the contrast agent in blood vessels after intravenous injection might mask the measures in brain parenchyma and the detection of amyloid plaques. We therefore examined the optical histology of the brains after the MRI data were taken to determine if contrast agent accumulated in blood vessels. We found no accumulation of the SPIONs in blood vessels. This is consistent with the small size of the SPIONs used and the fact that Beckmann et al. [75] have found no detectable cerebral amyloid angiopathy or MRI-detectable lesions in singly-transgenic AβPP mice for mice less than 15 months of age. Our mice were only 14 months old when killed for this study. Note also that the addition of PS1 mutations to AβPP transgenic to produce doubly-transgenic mice serves to decrease the presence of cerebral amyloid angiopathy [75].
The normal functional pore size of the BBB of ~0.8 nm is known to increase to ~10 nm with brain tumorigenesis [80] and to ~20 nm with osmotic opening [81, 82]. In AD, neuroinflammation also increases the functional pore size of the compromised BBB [55–59]. Therefore, given the small size of our SPION cores (9.5 ± 1.0 nm, see Methods), it was not surprising to successfully label Aβ plaques in vivo. Treatment of the transgenic mice with anti-AβPP targeted SPIONs enhanced the conspicuity of the MRI-detected lesions in vivo. Brain-wide enhancement of the visibility of the treated plaques by the SPIONs was obvious, even to the naked eye, in Fig. 3, and particularly when Fig. 4A–C and D–F were compared.
There is considerable interest in nanoparticles for the delivery into the brain of otherwise impermeable substances [83–88]. Several other groups have successfully designed and utilized nanoparticles that penetrate the BBB. For example, colloidal polybutyl-cyanoacrylate nanoparticles penetrated into the brain parenchyma and transported dalargin, plaque-staining dyes, and anti Aβ antibodies by phagocytic uptake by endothelial cells in an apolipoprotein E dependent manner [84, 85, 87].
Given the large number (>5 million) of AD patients currently present in the US, a widely-applicable detection method is needed in order to deliver early detection and treatment monitoring to patients afflicted with AD. The superiority of the targeted SPION technique over previous attempts to non-invasively detect plaques in vivo is suggested both by its penetration of the BBB without the use of mannitol and by the statistically measured increase in plaque conspicuity. It performs as well as Gadolinium-based methods, whose plaque Z-scores have been reported to be 7.6 ± 2.6 [89] with an increase in Z by a factor of two [32]. Although positron emission tomography (PET) imaging using [N-Methyl-11C]2-(4′-methylamoniophenyl)-6-hydroxybenzothiazole (otherwise known as “Pittsburg Compound B”, PiB) has been effectively utilized for in vivo plaque imaging [90, 91], its requirement for expensive and scarce radioactive 11 C production and detection facilities limits this method to a research setting. Other positron-emitting compounds, such as 18F-AV45 [92, 93], do not possess some of these drawbacks, and have received FDA approval for clinical use. Targeted, brain-permeable SPION contrast agents might be able to replace Gadolinium ions or PET imaging techniques. Moreover, our SPION method offers a greater statistical robustness compared to other detection methods such as 23Na MRI [94] or PiB PET [95].
These studies open the way to the development of targeted SPIONs as MRI contrast agents able to reveal plaque density in vivo, without the use of radiation, and to monitor the efficacy of treatments directed at lowering plaque density. Although effective treatments for AD are still lacking, an early detection method is an obvious requirement. The fact that SPIONs were non-toxic, nanoscale, and inexpensive to manufacture has broad implications for early plaque detection in human patients. Considering that our SPIONs showed effectiveness when imaging at 9.4 T, it is useful to consider that lower-field MR instruments are widely distributed in medicine. It is well-known that SPIONs perform even better at these lower fields. This method could therefore be widely implemented at relatively low cost.
Supplementary Material
Acknowledgments
This research was supported by the National Institutes of Health (SBIR AG032139 to DLVJ; R01 CA123194 to LOS), the UNM Brain and Behavioral Health Institute (to LOS), and by The New Mexico Fraternal Order of Eagles (to LOS). The MRI studies at the University of Minnesota were supported in part by Biotechnology Research Resource Center (BTRC) grant P41 RR008079 (NCRR) and P41 EB015894 (NIBIB). Optical images in this paper were generated in the UNM Cancer Center Fluorescent Microscopy shared resource: http://hsc.unm.edu/crtc/microscopy/. It is always a pleasure to thank Karen Buehler, of TriCore, for her enthusiastic histological assistance. The SQUID measurements, showing the lack of aggregation of the SPIONs, were kindly performed by K. Butler and E. Flynn of Senior Scientific, Albuquerque, NM. We would like to thank Terri Gilbert of the Allen Institute for Brain Science for providing the mouse brain coordinates, and Jesus Hernandez of Wolfram Inc. for assistance with brain surface rendering in Mathematica. Human Alzheimer’s brain tissue was provided by Dr. R. Reichert of the New Mexico Office of the Medical Investigator.
Footnotes
Supplementary data available online: http://www.j-alz.com/issues/34/vol34-2.html#supplementarydata01
Authors’ disclosures available online (http://www.j-alz.com/disclosures/view.php?id=1565).
References
- 1.Hebert LE, Scherr PA, Bienias JL, Bennett DA, Evans DA. Alzheimer’s disease in the U.S. population: Prevalence estimates using the 2000 census. Arch Neurol. 2003;60:1119–1122. doi: 10.1001/archneur.60.8.1119. [DOI] [PubMed] [Google Scholar]
- 2.Fodero-Tavoletti AT, Villemagne VL, Rowe CC, Masters CL, Barnham KJ, Cappai R. Amyloid-β: The seeds of darkness. Int J Biochem Cell Biol. 2011;43:1247–1251. doi: 10.1016/j.biocel.2011.05.001. [DOI] [PubMed] [Google Scholar]
- 3.Iqbal K, Liu F, Gong C, Grundke-Iqbal I. Tau in Alzheimer disease and related tauopathies. Curr Alzheimer Res. 2010;7:656–664. doi: 10.2174/156720510793611592. [DOI] [PMC free article] [PubMed] [Google Scholar]
- 4.Masters CL, Cappai R, Barnham KJ, Villemagne VL. Molecular mechanisms for Alzheimer’s disease: Implications for neuroimaging and therapeutics. J Neurochem. 2006;106:1700–1725. doi: 10.1111/j.1471-4159.2006.03989.x. [DOI] [PubMed] [Google Scholar]
- 5.Karran E, Mercken M, De Strooper B. The amyloid cascade hypothesis for Alzheimer’s disease: An appraisal for the development of therapeutics. Nat Med. 2011;10:698–712. doi: 10.1038/nrd3505. [DOI] [PubMed] [Google Scholar]
- 6.Mattson MP. Pathways towards and away from Alzheimer’s disease. Nature. 2004;430:631–639. doi: 10.1038/nature02621. [DOI] [PMC free article] [PubMed] [Google Scholar]
- 7.Selkoe DJ, Schenk D. Alzheimer’s disease: Molecular understanding predicts amyloid-based therapeutics. Annu Rev Pharmacol Toxicol. 2003;43:545–584. doi: 10.1146/annurev.pharmtox.43.100901.140248. [DOI] [PubMed] [Google Scholar]
- 8.Lührs T, Ritter C, Adrian M, Riek-Loher D, Bohrmann B, Döbeli H, Schubert D, Riek R. 3D structure of Alzheimer’s amyloid-β (1–42) fibrils. Proc Natl Acad Sci U S A. 2005;102:17342–17347. doi: 10.1073/pnas.0506723102. [DOI] [PMC free article] [PubMed] [Google Scholar]
- 9.Gaspar RC, Villarreal SA, Bowles N, Hepler RW, Joyce JG, Shughrue PJ. Oligomers of β-amyloid are sequestered into and seed new plaques in the brains of an AD mouse model. Exp Neurol. 2010;223:394–400. doi: 10.1016/j.expneurol.2009.09.001. [DOI] [PubMed] [Google Scholar]
- 10.Urbanc B, Betnel M, Cruz L, Bitan G, Teplow DB. Elucidation of amyloid-β protein oligomerization mechanisms: Discrete molecular dynamics study. J Am Chem Soc. 2010;132:4266–4280. doi: 10.1021/ja9096303. [DOI] [PMC free article] [PubMed] [Google Scholar]
- 11.Schnabel J. Amyloid: Little proteins, big clues. Nature. 2011;475:S12–S14. doi: 10.1038/475S12a. [DOI] [PubMed] [Google Scholar]
- 12.Hardy J, Allsop D. Amyloid deposition as the central event in the aetiology of Alzheimer’s disease. Trends Pharmacol Sci. 1991;12:383–388. doi: 10.1016/0165-6147(91)90609-v. [DOI] [PubMed] [Google Scholar]
- 13.Hardy J. Amyloid, the presenilins and Alzheimer’s disease. Trends Neurosci. 1997;20:154–159. doi: 10.1016/s0166-2236(96)01030-2. [DOI] [PubMed] [Google Scholar]
- 14.Hsaio K, Chapman P, Nilsen S, Eckman C, Harigaya Y, Younkin S, Yang F, Cole G. Correlative memory deficits, Aβ elevation, and amyloid plaques in transgenic mice. Science. 1996;274:99–102. doi: 10.1126/science.274.5284.99. [DOI] [PubMed] [Google Scholar]
- 15.Holcomb L, Gordon MN, McGowan E, Yu X, Benkovic S, Jantzen P, Wright K, Saad I, Mueller R, Morgan D, Sanders S, Zehr C, O’Campo K, Hardy J, Prada CM, Eckman C, Younkin S, Hsiao K, Duff K. Accelerated Alzheimer-type phenotype in transgenic mice carrying both mutant amyloid precursor protein and presenilin 1 transgenes. Nat Med. 1998;4:97–100. doi: 10.1038/nm0198-097. [DOI] [PubMed] [Google Scholar]
- 16.Bornemann KD, Wiederhold KH, Pauli C, Ermini F, Stalder M, Schnell L, Sommer B, Jucker M, Staufenbiel M. Abeta-induced inflammatory processes in microglia cells of APP23 transgenic mice. Am J Pathol. 2001;158:63–73. doi: 10.1016/s0002-9440(10)63945-4. [DOI] [PMC free article] [PubMed] [Google Scholar]
- 17.Dickson DW. Neuropathological diagnosis of Alzheimer’s disease: A perspective from longitudinal clinicopathological studies. Neurobiol Aging. 1997;18:S21–S26. doi: 10.1016/s0197-4580(97)00065-1. [DOI] [PubMed] [Google Scholar]
- 18.Dubois B, Feldman HH, Jacova C, Dekosky ST, Barberger-Gateau P, Cummings J, Delacourte A, Galasko D, Gauthier S, Jicha G, Meguro K, O’brien J, Pasquier F, Robert P, Rossor M, Salloway S, Stern Y, Visser PJ, Scheltens P. Research criteria for the diagnosis of Alzheimer’s disease: Revising the NINCDS-ADRDA criteria. Lancet Neurol. 2007;6:734–746. doi: 10.1016/S1474-4422(07)70178-3. [DOI] [PubMed] [Google Scholar]
- 19.Jack CR, Jr, Albert MS, Knopman DS, McKhann GM, Sperling RA, Carrillo MC, Thies B, Phelps CH. Introduction to the recommendations from the National Institute on Aging-Alzheimer’s Association workgroups on diagnostic guidelines for Alzheimer’s disease. Alzheimers Dement. 2011;7:257–262. doi: 10.1016/j.jalz.2011.03.004. [DOI] [PMC free article] [PubMed] [Google Scholar]
- 20.Benveniste H, Einstein G, Kim KR, Hulette C, Johnson GA. Detection of neuritic plaques in Alzheimer’s disease by magnetic resonance microscopy. Proc Natl Acad Sci U S A. 1999;96:14079–14084. doi: 10.1073/pnas.96.24.14079. [DOI] [PMC free article] [PubMed] [Google Scholar]
- 21.Jack CR, Garwood M, Wengenack TM, Borowski B, Curran GL, Lin J, Adriany G, Gröhn OH, Grimm R, Poduslo JF. In vivo visualization of Alzheimer’s amyloid plaques by MRI in transgenic mice without a contrast agent. Magn Reson Med. 2004;52:1263–1271. doi: 10.1002/mrm.20266. [DOI] [PMC free article] [PubMed] [Google Scholar]
- 22.Jack CR, Wengenack TM, Reyes DA, Garwood M, Curran GL, Borowski BJ, Lin J, Preboske GM, Holasek SS, Adriany G, Poduslo JF. In vivo magnetic resonance microimaging of individual amyloid plaques in Alzheimer’s transgenic mice. J Neurosci. 2005;25:10041–10048. doi: 10.1523/JNEUROSCI.2588-05.2005. [DOI] [PMC free article] [PubMed] [Google Scholar]
- 23.Borthakur A, Gur T, Wheaton AJ, Corbo M, Trojanowski JQ, Lee VM, Reddy R. In vivo measurement of plaque burden in a mouse model of Alzheimer’s disease. J Magn Reson Imag. 2006;24:1011–1017. doi: 10.1002/jmri.20751. [DOI] [PMC free article] [PubMed] [Google Scholar]
- 24.Braakman N, Matysik J, van Duinen SG, Verbeek F, Schliebs R, de Groot HJ, Alia A. Longitudinal assessment of Alzheimer’s beta-amyloid plaque development in transgenic mice monitored by in vivo magnetic resonance microimaging. J Magn Reson Imag. 2006;24:530–536. doi: 10.1002/jmri.20675. [DOI] [PubMed] [Google Scholar]
- 25.Benveniste H, Ma Y, Dhawan J, Gifford A, Smith SD, Feinstein I, Du C, Grant SC, Hof PR. Anatomical and functional phenotyping of mice models of Alzheimer’s disease by MR microscopy. Ann N Y Acad Sci. 2007;1097:12–29. doi: 10.1196/annals.1379.006. [DOI] [PubMed] [Google Scholar]
- 26.Chamberlain R, Reyes D, Curran GL, Marjanska M, Wengenack TM, Poduslo JF, Garwood M, Jack CR. Comparison of amyloid plaque contrast generated by T2-weighted, T2*-weighted, and susceptibility-weighted imaging methods in transgenic mouse models of Alzheimer’s disease. Magn Reson Med. 2009;61:1158–1164. doi: 10.1002/mrm.21951. [DOI] [PMC free article] [PubMed] [Google Scholar]
- 27.Dhenain M, El Tannir El Tayara N, Wu TD, Guégan M, Volk A, Quintana C, Delatour B. Characterization of in vivo MRI detectable thalamic amyloid plaques from APP/PS1 mice. Neurobiol Aging. 2009;30:41–53. doi: 10.1016/j.neurobiolaging.2007.05.018. [DOI] [PubMed] [Google Scholar]
- 28.Zhang J, Yarowsky P, Gordon MN, Di Carlo G, Munireddy S, van Zijl PC, Mori S. Detection of amyloid plaques in mouse models of Alzheimer’s disease by magnetic resonance imaging. Magn Reson Med. 2004;51:452–457. doi: 10.1002/mrm.10730. [DOI] [PubMed] [Google Scholar]
- 29.Faber C, Zahneisen B, Tippmann F, Schroeder A, Fahrenholz F. Gradient-echo and CRAZED imaging for minute detection of Alzheimer plaques in an APPV717I x ADAM10-dn mouse model. Magn Reson Med. 2007;57:696–703. doi: 10.1002/mrm.21201. [DOI] [PubMed] [Google Scholar]
- 30.Chamberlain R, Wengenack TM, Poduslo JF, Garwood M, Jack CF. Magnetic resonance imaging of amyloid plaques in transgenic mouse models of Alzheimer’s disease. Curr Med Imaging Rev. 2011;7:3–7. doi: 10.2174/157340511794653522. [DOI] [PMC free article] [PubMed] [Google Scholar]
- 31.Wengenack TM, Reyes DA, Curran GL, Borowski BJ, Lin J, Preboske GM, Holasek SS, Gilles EJ, Chamberlain R, Marjanska M, Jack CR, Garwood M, Poduslo JF. Regional differences in MRI detection of amyloid plaques in AD transgenic mouse brain. Neuroimage. 2011;54:113–122. doi: 10.1016/j.neuroimage.2010.08.033. [DOI] [PMC free article] [PubMed] [Google Scholar]
- 32.Poduslo JF, Wengenack TM, Curran GL, Wisniewski T, Sigurdsson EM, Macura SI, Borowski BJ, Jack CR. Molecular targeting of Alzheimer’s amyloid plaques for contrast-enhanced magnetic resonance imaging. Neurobiol Dis. 2002;11:315–329. doi: 10.1006/nbdi.2002.0550. [DOI] [PubMed] [Google Scholar]
- 33.Poduslo JF, Curran GL, Peterson JA, McCormick DJ, Fauq AH, Khan MA, Wengenack TM. Design and chemical synthesis of a magnetic resonance contrast agent with enhanced in vitro binding, high blood-brain permeability, and in vivo targeting to Alzheimer’s disease amyloid plaques. Biochemistry. 2004;43:6064–6075. doi: 10.1021/bi0359574. [DOI] [PMC free article] [PubMed] [Google Scholar]
- 34.Petiet A, Santin M, Bertrand A, Wiggins CJ, Petit F, Houitte D, Hantraye P, Benavides J, Debeir T, Rooney T, Dhenain M. Gadolinium-staining reveals amyloid plaques in the brain of Alzheimer’s transgenic mice. Neurobiol Aging. 2012;33:1533–1544. doi: 10.1016/j.neurobiolaging.2011.03.009. [DOI] [PubMed] [Google Scholar]
- 35.Dhenain M, Delatour B, Walczak C, Volk A. Passive staining: A novel ex vivo MRI protocol to detect amyloid deposits in mouse models of Alzheimer’s disease. Magn Reson Med. 2006;55:687–693. doi: 10.1002/mrm.20810. [DOI] [PubMed] [Google Scholar]
- 36.Wadghiri YZ, Sigurdsson EM, Sadowski M, Elliott JI, Li Y, Scholtzova H, Tang CY, Aguinaldo G, Pappolla M, Duff K, Wisniewski T, Turnbull DH. Detection of Alzheimer’s amyloid in transgenic mice using magnetic resonance microimaging. Magn Reson Med. 2003;50:293–302. doi: 10.1002/mrm.10529. [DOI] [PubMed] [Google Scholar]
- 37.Meadowcroft MD, Connor JR, Smith MB, Yang QX. Magnetic resonance imaging and histological analysis of beta- amyloid plaques in both human Alzheimer’s disease and APP/PS1 transgenic mice. J Magn Reson Imaging. 2009;29:997–1007. doi: 10.1002/jmri.21731. [DOI] [PMC free article] [PubMed] [Google Scholar]
- 38.Scholtzova H, Wadghiri YZ, Douadi M, Sigurdsson EM, Li Y-S, Quartermain D, Banerjee P, Wisniewski T. Memantine leads to behavioral improvement and amyloid reduction in Alzheimer’s disease model transgenic mice shown as by micromagnetic resonance imaging. J Neurosci Res. 2008;86:2784–2791. doi: 10.1002/jnr.21713. [DOI] [PMC free article] [PubMed] [Google Scholar]
- 39.Zhang J, Shu C, Reid J, Owens LS, Cai T, Gibson HW, Long GL, Corwin FD, Chen Z-J, Fatouros PP, Dorn HC. High relaxivity trimetallic nitride (Gd3N) metallofullerene MRI contrast agents with optimized functionality. Bioconjug Chem. 2010;21:610–615. doi: 10.1021/bc900375n. [DOI] [PMC free article] [PubMed] [Google Scholar]
- 40.Higuchi M, Iwata N, Matsuba Y, Sato K, Sasamoto K, Saido TC. 19F and 1H MRI detection of amyloid β plaques in vivo. Nat Neurosci. 2005;8:527–533. doi: 10.1038/nn1422. [DOI] [PubMed] [Google Scholar]
- 41.Amatsubo T, Yanagisawa D, Morikawa S, Taguchi H, Tooyama I. Amyloid imaging using high-field magnetic resonance. Magn Reson Med Sci. 2010;9:95–99. doi: 10.2463/mrms.9.95. [DOI] [PubMed] [Google Scholar]
- 42.Yanagisawa D, Amatsubo T, Morikawa S, Taguchi H, Urushitani M, Shirai N, Hirao K, Shiino A, Inubushi T, Tooyama I. In vivo detection of amyloid β deposition using 19F magnetic resonance imaging with a 19F-containing curcumin derivative in a mouse model of Alzheimer’s disease. Neuroscience. 2011;184:120–127. doi: 10.1016/j.neuroscience.2011.03.071. [DOI] [PubMed] [Google Scholar]
- 43.Petri-Fink A, Hofman H. Superparamagnetic Iron oxide Nanoparticles (SPIONs): From synthesis to in vivo studies- A summary of synthesis, characterization, in vitro and in vivo investigations of SPIONs with particular focus on surface and colloidal properties. IEEE Trans Nanobiosci. 2007;6:1536–1541. doi: 10.1109/tnb.2007.908987. [DOI] [PubMed] [Google Scholar]
- 44.Lin MM, Kim DK, El Haj AJ, Dobson J. Development of Superparamagnetic Iron Oxide Nanoparticles (SPIONS) for translation to clinical applications. IEEE Trans Nanobiosci. 2008;7:298–305. doi: 10.1109/TNB.2008.2011864. [DOI] [PubMed] [Google Scholar]
- 45.Brambilla D, Le Droumaguet B, Nicolas J, Hashemi SH, Wu LP, Moghimi SM, Couvreur P, Andrieux K. Nanotechnologies for Alzheimer’s disease: Diagnosis, therapy, and safety issues. Nanomedicine. 2011;7:521–540. doi: 10.1016/j.nano.2011.03.008. [DOI] [PubMed] [Google Scholar]
- 46.Skaat H, Margel S. Synthesis of fluorescent-maghemite nanoparticles as multimodal imaging agents for amyloid-beta fibrils detection and removal by a magnetic field. Biochem Biophys Res Commun. 2009;386:645–649. doi: 10.1016/j.bbrc.2009.06.110. [DOI] [PubMed] [Google Scholar]
- 47.Taylor RM, Huber DL, Monson TC, Ali AS, Bisoffi M, Sillerud LO. Multifunctional iron platinum stealth immunomicelles: Targeted detection of human prostate cancer cells using both fluorescence and magnetic resonance imaging. J Nanopart Res. 2011;13:4717–4729. doi: 10.1007/s11051-011-0439-3. [DOI] [PMC free article] [PubMed] [Google Scholar]
- 48.Kim YS, Joh TH. Microglia, major player in the brain inflammation: Their roles in the pathogenesis of Parkinson’s disease. Exp Mol Med. 2006;38:333–347. doi: 10.1038/emm.2006.40. [DOI] [PubMed] [Google Scholar]
- 49.Granic I, Dolga AM, Nijholt IM, van Dijk G, Eisel UL. Inflammation and NF-kappaB in Alzheimer’s disease and diabetes. J Alzheimers Dis. 2009;16:809–821. doi: 10.3233/JAD-2009-0976. [DOI] [PubMed] [Google Scholar]
- 50.Khandelwal PJ, Herman AM, Moussa CE. Inflammation in the early stages of neurodegenerative pathology. J Neuroimmunol. 2011;238:1–11. doi: 10.1016/j.jneuroim.2011.07.002. [DOI] [PMC free article] [PubMed] [Google Scholar]
- 51.Couturier J, Paccalin M, Morel M, Terro F, Milin S, Pontcharraud R, Fauconneau B, Page G. Prevention of the β-amyloid peptide-induced inflammatory process by inhibition of double-stranded RNA-dependent protein kinase in primary murine mixed co-cultures. J Neuroinflammation. 2011;8:72. doi: 10.1186/1742-2094-8-72. [DOI] [PMC free article] [PubMed] [Google Scholar]
- 52.Mrak RE, Griffin WST. Glia and their cytokines in a progression of neurodegeneration. Neurobiol Aging. 2005;26:349–354. doi: 10.1016/j.neurobiolaging.2004.05.010. [DOI] [PubMed] [Google Scholar]
- 53.El Khoury J, Luster AD. Mechanisms of microglia accumulation in Alzheimer’s disease: Therapeutic implications. Trends Pharmacol Sci. 2008;29:626–632. doi: 10.1016/j.tips.2008.08.004. [DOI] [PubMed] [Google Scholar]
- 54.Schlachetzki JC, Hüll M. Microglial activation in Alzheimer’s disease. Curr Alzheimer Res. 2009;6:554–563. doi: 10.2174/156720509790147179. [DOI] [PubMed] [Google Scholar]
- 55.Graeber MB. Changing face of microglia. Science. 2010;330:783–788. doi: 10.1126/science.1190929. [DOI] [PubMed] [Google Scholar]
- 56.Burguillos MA, Deierborg T, Kavanagh E, Persson A, Hajji N, Garcia-Quintanilla A, Cano J, Brundin P, Englund E, Venero JL, Joseph B. Caspase signalling controls microglia activation and neurotoxicity. Nature. 2011;472:319–324. doi: 10.1038/nature09788. [DOI] [PubMed] [Google Scholar]
- 57.Alafuzoff I, Adolfsson R, Grundke-Iqbal I, Winblad B. Blood-brain barrier in Alzheimer dementia and in non-demented elderly. An immunocytochemical study. Acta Neuropathol. 1987;73:160–166. doi: 10.1007/BF00693782. [DOI] [PubMed] [Google Scholar]
- 58.Kalaria RN. The blood-brain barrier and cerebrovascular pathology in Alzheimer’s disease. Ann N Y Acad Sci. 2006;893:113–125. doi: 10.1111/j.1749-6632.1999.tb07821.x. [DOI] [PubMed] [Google Scholar]
- 59.Anderson VC, Lenar DP, Quinn JF, Rooney WD. The blood-brain barrier and microvascular water exchange in Alzheimer’s disease. Cardiovasc Psychiatry Neurol. 2011;2011:Article ID 615829. doi: 10.1155/2011/615829. [DOI] [PMC free article] [PubMed] [Google Scholar]
- 60.Dalkara T, Gursoy-Ozdemir Y, Yemisci M. Brain microvascular pericytes in health and disease. Acta Neuropathol. 2011;122:1–9. doi: 10.1007/s00401-011-0847-6. [DOI] [PubMed] [Google Scholar]
- 61.del Valle J, Duran-Vilaregut J, Manich G, Pallàs M, Camins A, Vilaplana J, Pelegrí C. Cerebral amyloid angiopathy, blood-brain barrier disruption and amyloid accumulation in SAMP8 mice. Neurodegener Dis. 2011;8:421–429. doi: 10.1159/000324757. [DOI] [PubMed] [Google Scholar]
- 62.Mundt AP, Winter C, Mueller S, Wuerfel J, Tysiak E, Schnorr J, Taupitz M, Heinz A, Juckel G. Targeting activated microglia in Alzheimer’s pathology by intraventricular delivery of a phagocytosable MRI contrast agent in APP23 transgenic mice. Neuroimage. 2009;46:367–372. doi: 10.1016/j.neuroimage.2009.01.067. [DOI] [PubMed] [Google Scholar]
- 63.Stoll G, Bendszus M. Imaging of inflammation in the peripheral and central nervous system by magnetic resonance imaging. Neuroscience. 2009;158:1151–1160. doi: 10.1016/j.neuroscience.2008.06.045. [DOI] [PubMed] [Google Scholar]
- 64.Fleige G, Nolte C, Synowitz M, Seeberger F, Kettenmann H, Zimmer C. Magnetic labeling of activated microglia in experimental gliomas. Neoplasia. 2001;3:489–499. doi: 10.1038/sj.neo.7900176. [DOI] [PMC free article] [PubMed] [Google Scholar]
- 65.Poduslo JF, Hultman KL, Curran GL, Preboske GM, Chamberlain R, Marjanska M, Garwood M, Jack CR, Wengenack TM. Targeting vascular amyloid in artierioles of Alzheimer disease transgenic mice with amyloid-β protein antibody-coated nanoparticles. J Neuropathol Exp Neurol. 2011;70:653–661. doi: 10.1097/NEN.0b013e318225038c. [DOI] [PMC free article] [PubMed] [Google Scholar]
- 66.Sigurdsson EM, Wadghiri YZ, Mosconi L, Blind JA, Knudsen E, Asuni A, Scholtzova H, Tsui WH, Li Y, Sadowski M, Turnbull DH, de Leon MJ, Wisniewski T. A non-toxic ligand for voxel-based MRI analysis of plaques in AD transgenic mice. Neurobiol Aging. 2008;29:836–847. doi: 10.1016/j.neurobiolaging.2006.12.018. [DOI] [PMC free article] [PubMed] [Google Scholar]
- 67.Skaat H, Margel S. Synthesis of fluorescent-maghemite nanoparticles as multimodal imaging agents for amyloid-beta fibrils detection and removal by a magnetic field. Biochem Biophys Res Commun. 2009;386:645–649. doi: 10.1016/j.bbrc.2009.06.110. [DOI] [PubMed] [Google Scholar]
- 68.Yang C-C, Yang S-Y, Chieh J-J, Horng H-E, Hong C-Y, Yang H-C, Chen KH, Shih BY, Ta- Chen F, Chiu M-J. Biofunctionalized magnetic nanoparticles for specifically detecting biomarkers of Alzheimer’s disease in vitro. ACS Chem Neurosci. 2011;2:500–505. doi: 10.1021/cn200028j. [DOI] [PMC free article] [PubMed] [Google Scholar]
- 69.Yang J, Wadghiri YZ, Hoang DM, Tsui W, Sun Y, Chung E, Li Y, Wang A, de Leon M, Wisniewski T. Detection of amyloid plaques targeted by USPIO-Aβ1–42 in Alzheimer’s disease transgenic mice using magnetic resonance microimaging. Neuroimage. 2011;55:1600–1609. doi: 10.1016/j.neuroimage.2011.01.023. [DOI] [PMC free article] [PubMed] [Google Scholar]
- 70.Stookey LL. Ferrozine-a new spectrophotometric reagent for iron. Anal Chem. 1970;42:779–781. [Google Scholar]
- 71.Schneider CA, Rasband WS, Eliceiri KW. NIH Image to Image J: 25 years of image analysis. Nat Methods. 2012;9:671–675. doi: 10.1038/nmeth.2089. [DOI] [PMC free article] [PubMed] [Google Scholar]
- 72.Wengenack TM, Whelan S, Curran GL, Duff KE, Poduslo JF. Quantitative histological analysis of amyloid deposition in Alzheimer’s double transgenic mouse brain. Neuroscience. 2000;101:939–944. doi: 10.1016/s0306-4522(00)00388-2. [DOI] [PubMed] [Google Scholar]
- 73.Kelényi G. Thioflavin S fluorescent and congo red anisotropic stainings in the histologic demonstration of amyloid. Acta Neuropathol. 1966;7:336–348. doi: 10.1007/BF00688089. [DOI] [PubMed] [Google Scholar]
- 74.Falangola MF, Lee SP, Nixon RA, Duff K, Helpern JA. Histological co-localization of iron in Abeta plaques of PS/APP transgenic mice. Neurochem Res. 2005;30:201–205. doi: 10.1007/s11064-004-2442-x. [DOI] [PMC free article] [PubMed] [Google Scholar]
- 75.Beckmann N, Gerard C, Abramowski D, Cannet C, Staufenbiel M. Noninvasive magnetic resonance imaging detection of cerebral amyloid angiopathy-related microvascular alterations using superparamagnetic iron oxide particles in APP transgenic mouse models of Alzheimer’s disease: Application to passive Aβ immunotherapy. J Neurosci. 2011;31:1023–1031. doi: 10.1523/JNEUROSCI.4936-10.2011. [DOI] [PMC free article] [PubMed] [Google Scholar]
- 76.Ramakrishnan M, Wengenack TM, Kandimalla KK, Curran GL, Gilles EJ, Ramirez-Alvarado M, Lin J, Garwood M, Jack CR, Jr, Poduslo JF. Selective contrast enhancement of individual Alzheimer’s disease amyloid plaques using a polyamine and Gd-DOTA conjugated antibody fragment against fibrillar Abeta42 for magnetic resonance molecular imaging. Pharm Res. 2008;25:1861–1872. doi: 10.1007/s11095-008-9600-9. [DOI] [PMC free article] [PubMed] [Google Scholar]
- 77.Takeuchi A, Irizarry MC, Duff K, Saido TC, Ashe KH, Hasegawa M, Mann DMA. Age-related amyloid deposition in transgenic mice overexpressing both Alzheimer mutant presenilin 1 and amyloid precursor protein Swedish mutant is not associated with global neuronal loss. Am J Pathol. 2000;157:331–339. doi: 10.1016/s0002-9440(10)64544-0. [DOI] [PMC free article] [PubMed] [Google Scholar]
- 78.Inoue S, Kisilevsky R. Beta-amyloid fibrils of Alzheimer’s disease: Pathologically altered, basement membrane-associated microfibrils. Ital J Anat Embryol. 2001;106:93–102. [PubMed] [Google Scholar]
- 79.Zipser BD, Johanson CE, Gonzalez L, Berzin TM, Tavares R, Hulette CM, Vitek MP, Hovanesian V, Stopa EG. Microvasculature injury and blood-brain barrier leakage in Alzheimer’s disease. Neurobiol Aging. 2007;28:977–986. doi: 10.1016/j.neurobiolaging.2006.05.016. [DOI] [PubMed] [Google Scholar]
- 80.Sarin H, Kanevsky AS, Wu H, Sousa AA, Wilson CM, Aronova MA, Griffiths GL, Leapman RD, Vo HQ. Physiologic upper limit of pore size in the blood-tumor barrier of malignant solid tumors. J Transl Med. 2009;7:51. doi: 10.1186/1479-5876-7-51. [DOI] [PMC free article] [PubMed] [Google Scholar]
- 81.van Bree JBMM, de Boer AG, Danhof M, Ginsel LA, Breimer DD. Characterization of an in vitro blood-brain barrier: Effects of molecular size and lipophilicity on cerebrovascular endothelial transport rates of drugs. J Pharmacol Exp Ther. 1988;247:1233–1239. [PubMed] [Google Scholar]
- 82.Robinson PJ, Rapoport SI. Size selectivity of blood-brain barrier permeability at various times after osmotic opening. Am J Physiol. 1987;253:R459–R466. doi: 10.1152/ajpregu.1987.253.3.R459. [DOI] [PubMed] [Google Scholar]
- 83.Bhaskar S, Tian F, Stoger T, Kreyling W, de la Fuente JM, Grazu V, Borm P, Estrada G, Ntziachristos V, Razansky D. Multifunctional nanocarriers for diagnostics, drug delivery and targeted treatment across the blood-brain barrier: Perspectives on tracking and neuroimaging. Particle Fiber Technol. 2010;7:1–25. doi: 10.1186/1743-8977-7-3. [DOI] [PMC free article] [PubMed] [Google Scholar]
- 84.Kreuter J, Alyautdin RN, Kharkevich DA, Ivanov AA. Passage of peptides through the blood-brain barrier with colloidal polymer particles (nanoparticles) Brain Res. 1995;674:171–174. doi: 10.1016/0006-8993(95)00023-j. [DOI] [PubMed] [Google Scholar]
- 85.Kreuter J, Shamenkov D, Petrov V, Ramge P, Cychutek K, Koch-Brandt C, Alyautdin R. Apolipoprotein-mediated transport of nanoparticle-bound drugs across the blood-brain barrier. J Drug Target. 2002;10:317–325. doi: 10.1080/10611860290031877. [DOI] [PubMed] [Google Scholar]
- 86.Nazem A, Mansoori GA. Nanotechnology for Alzheimer’s disease detection and treatment. Insciences J. 2011;1:169–193. [Google Scholar]
- 87.Koffie RM, Farrar CT, Saidi L-J, William CM, Hyman BT, Spires-Jones TL. Nanoparticles enhance brain delivery of blood–brain barrier-impermeable probes for in vivo optical and magnetic resonance imaging. Proc Natl Acad Sci U S A. 2011;108:18837–18842. doi: 10.1073/pnas.1111405108. [DOI] [PMC free article] [PubMed] [Google Scholar]
- 88.Sahni JK, Doggui S, Ali J, Baboota S, Dao L, Ramassamy C. Neurotherapeutic applications of nanoparticles in Alzheimer’s disease. J Controlled Release. 2011;152:208–231. doi: 10.1016/j.jconrel.2010.11.033. [DOI] [PubMed] [Google Scholar]
- 89.Petiet A, Santin M, Bertrand A, Wiggins CJ, Petit F, Houitte D, Hantraye P, Benavides J, Debeir T, Rooney T, Dhenain M. Gadolinium-staining reveals amyloid plaques in the brain of Alzheimer’s transgenic mice. Neurobiol Aging. 2012;33:1533–1544. doi: 10.1016/j.neurobiolaging.2011.03.009. [DOI] [PubMed] [Google Scholar]
- 90.Weiner MW, Aisen PS, Jack CR, Jr, Jagust WJ, Trojanowski JQ, Shaw L, Saykin AJ, Morris JC, Cairns N, Beckett LA, Toga A, Green R, Walter S, Soares H, Snyder P, Siemers E, Potter W, Cole PE, Schmidt M. The Alzheimer’s disease neuroimaging inititative: Progress report and future plans. Alzheimers Dement. 2010;6:201–211. doi: 10.1016/j.jalz.2010.03.007. [DOI] [PMC free article] [PubMed] [Google Scholar]
- 91.Miller G. Alzheimer’s biomarker initiative hits its stride. Science. 2009;326:386–389. doi: 10.1126/science.326_386. [DOI] [PubMed] [Google Scholar]
- 92.Choi SR, Golding G, Zhuang Z, Zhang W, Lim N, Hefti F, Benedum TE, Kilbourn MR, Skovronsky D, Kung HF. Preclinical properties of 18F-AV-45: A PET agent for Abeta plaques in the brain. J Nucl Med. 2009;50:1887–1894. doi: 10.2967/jnumed.109.065284. [DOI] [PMC free article] [PubMed] [Google Scholar]
- 93.Yang L, Rieves D, Ganley C. Brain amyloid imaging–FDA approval of florbetapir F18 injection. N Engl J Med. 2012;367:885–887. doi: 10.1056/NEJMp1208061. [DOI] [PubMed] [Google Scholar]
- 94.Mellon EA, Pilkinton DT, Clark CM, Elliot MA, Witschley WR, Borthakur A, Reddy R. Sodium MR imaging detection of mild Alzheimer disease: Preliminary study. Am J Neuroradiol. 2009;30:978–984. doi: 10.3174/ajnr.A1495. [DOI] [PMC free article] [PubMed] [Google Scholar]
- 95.Maeda J, Zhang M-R, Okauchi T, Ji B, Ono M, Hattori S, Kumata K, Iwata N, Saido TC, Trojanowski JQ, Lee VM, Staufenbiel M, Tomiyama T, Mori H, Fukumura T, Suhara T, Higuchi M. In vivo positron emission tomographic imaging of glial responses to amyloid-β and tau pathologies in mouse models of Alzheimer’s disease and related disorders. J Neurosci. 2011;31:4720–4730. doi: 10.1523/JNEUROSCI.3076-10.2011. [DOI] [PMC free article] [PubMed] [Google Scholar]
Associated Data
This section collects any data citations, data availability statements, or supplementary materials included in this article.