Abstract
Introduction
While increasingly popular among mid- to large-size employers, using financial incentives to induce health behavior change among employees has been controversial, in part due to poor quality and generalizability of studies to date. Thus, fundamental questions have been left unanswered: to generate positive economic returns on investment, what level of incentive should be offered for any given type of incentive program and among which employees?
Methods
We constructed a novel modeling framework that systematically identifies how to optimize marginal return on investment from programs incentivizing behavior change by integrating commonly-collected data on health behaviors and associated costs. We integrated “demand curves” capturing individual differences in response to any given incentive with employee demographic and risk factor data. We also estimated the degree of self-selection that could be tolerated, i.e., the maximum percentage of already-healthy employees who could enroll in a wellness program while still maintaining positive absolute return on investment. In a demonstration analysis, the modeling framework was applied to data from 3,000 worksite physical activity programs across the nation.
Results
For physical activity programs, the incentive levels that would optimize marginal return on investment ($367/employee/year) were higher than average incentive levels currently offered ($143/employee/year). Yet a high degree of self-selection could undermine the economic benefits of the program; if more than 17% of participants came from the top 10% of the physical activity distribution, the cost of the program would be expected to always be greater than its benefits.
Discussion
Our generalizable framework integrates individual differences in behavior and risk to systematically estimate the incentive level that optimizes marginal return on investment.
Keywords: financial incentives, behavior change, workplace wellness programs, physical activity, mathematical model
Introduction
Modifiable behaviors—such as physical inactivity, excess calorie intake, and tobacco smoking—are responsible for up to 40% of premature deaths in the United States (1), and contribute to billions of dollars in healthcare, sick pay and disability costs (2). To reduce disease incidence and costs, private employers are increasingly using financial incentives such as cash bonuses to encourage their employees to participate in physical activity classes, nutritional counseling, tobacco cessation, or other health-promoting activities (3–5).
In a recent national survey of medium and large-size employers not yet offering such incentives, half of respondents reported they planned to introduce incentives within the next year, and over 90% planned to do so within the next five years (6). The extensive interest in using financial incentives to motivate health behavior change at worksites has led to a number of case studies and field-based trials. These studies typically describe different incentive approaches, often applying behavioral economics and psychological theories to induce participation (7). However, according to recent commentaries, there are several pressing dilemmas in the research literature which remain unresolved to date (8,9).
First, many studies focus on the efficacy of particular approaches for delivering incentives, such as using lotteries rather than direct cash or offering immediate rewards rather than delayed rewards. But these studies may vary in efficacy not just due to differences in incentive delivery approach, but also due to differences in the populations enrolled, the disease risks of those populations, and different levels of participation within those populations in response to similar incentives. Indeed, most existing case studies and field trials report results from just one company or worksite (3–5), making it difficult to determine whether results may generalize to different populations. Hence, a standardized framework is needed to compare the efficacy of incentives across different populations.
Second, despite the appeal of incentives, employers may only experience increasing returns on investment for each dollar spent on incentives up to a maximum point. Beyond this maximum, the cost of the incentives themselves will likely exceed savings from averted healthcare and absenteeism costs. Thus, a systematic method for identifying the “optimal” incentive size is critical.
Third, some incentive programs suffer from “self-selection”, meaning that primarily healthy employees enroll in the programs whereas employees most in need of behavior change tend not to enroll. Thus, employers not only seek novel strategies to overcome self-selection, but they need to determine a self-selection threshold, i.e., the degree of self-selection that can be tolerated in a given program while still generating a positive return on investment (10,11).
These dilemmas inform two fundamental questions unanswered in the research literature: what level of incentive should be offered, and among which employees, to maximize marginal returns on investment? Answering these questions will provide benchmarks for behavior change programs that use financial incentives.
Here, we developed a first-generation, “backbone” microsimulation model to provide a generalizable framework to address this question for any given type of incentive program. We developed the model by combining insights and techniques from psychology, behavioral economics and operations research. First, we developed a standardized modeling approach that would incorporate commonly-collected data from programs that use financial incentives to motivate health behavior change. The model standardizes the comparison of these data using individual “demand curves” that capture differences in behavioral responses among individuals to any given type of incentive. Second, we linked these demand curves to employee demographics and risk factors that permit us to estimate chronic disease risk and associated healthcare and absenteeism costs over time related to a health behavior of interest, and help explain variations in outcomes when the same incentive program is applied to different populations. Third, we constructed an optimization approach to estimate how—using both behavior change and cost data—an employer can estimate the size of the incentive to be offered that would maximize their marginal return on investment from the incentive program over a specified budget planning horizon. Finally, we estimated the degree of self-selection that could be tolerated, i.e., the maximum percentage of already-healthy employees who could enroll, while still maintaining positive absolute returns on investment. To test the utility of this modeling approach, we conducted a demonstration analysis using data from 3,000 worksite financial incentive programs across the United States that offer incentives to motivate employees to be more physically active.
Methods
We developed a stochastic microsimulation model to incorporate data from incentivized workplace wellness programs and calculate marginal returns on investment based on demographic, behavioral, and cost data. First, we constructed a generalized modeling framework applicable to any given form of incentive delivered to modify any given behavior. Second, we applied this generalized framework to the demonstration analysis of a specific, common type of incentivized workplace wellness program: direct cash incentives provided to employees for participation in physical activity programs. The Appendix contains all input data and complete technical details consistent with international model reporting guidelines (12). Modeling was performed using the program R (v. 3.0.2, the R Project for Statistical Computing, Vienna). Figure 1 provides an overview of the model design.
Figure 1.
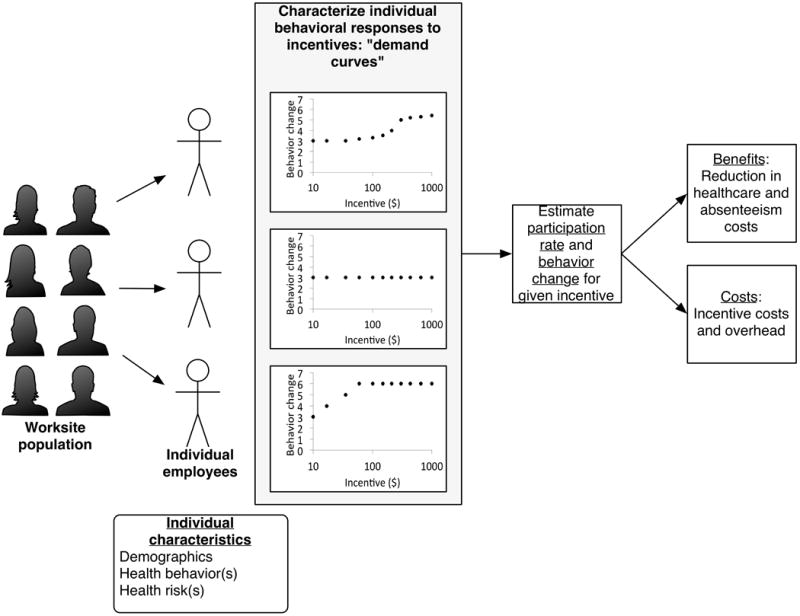
The modeling framework incorporates individual-level behavior and disease risk to estimate program-level health and economic outcomes.
Part A: Generalized framework for modeling incentivized behavior change programs
From the employer perspective, the benefits of a program in terms of marginal return on investment (ROI) may be defined by the equation:
| [1] |
where costs averted include healthcare and absenteeism costs averted through improved health behaviors among employees, and expenditures on the incentive program include the cost of the financial incentives per employee, along with associated overhead expenditures. Additional costs averted and expenditures can be added to this general framework as desired. We found the point at which this marginal return on investment equals one, which is the point before which each $1 spent results in at least $1 return on investment, and beyond which each $1 spent results in less than $1 in return. This is the point that maximizes the total benefits of the program minus the total costs (net benefits).
Although individual employers will choose the marginal return on investment level that exceeds their individual corporate hurdle rate (the minimum acceptable rate of return on a project), in our generalized model we plotted the overall marginal ROI across all available incentive levels, identifying the incentive level that would allow this marginal ROI to equal one. We additionally present the absolute ROI (total costs averted divided by total program expenditures) and the net benefits (total costs averted minus total program expenditures) to compare against the extant literature on workplace wellness programs and ensure that the benefits of the program exceed its costs.
The costs averted are a function of three key parameters: the proportion of employees who participate in the program at any given incentive level, the degree to which employees who participate change their behavior in response to the incentive, and how much each incremental improvement in their behavior results in an incremental reduction in healthcare and absenteeism costs from each of the participants. To estimate these parameters, we incorporated an approach that has not been previously incorporated into models of health behavior change, but allows us to integrate observed behavioral data from any given incentive-based behavior change program rather than assuming rational behavior. In other words, we did not assume that employees necessarily calculate their own objective function to determine their probability of participation or degree of behavior change to maximize their income or health. We instead characterized individual responses to a given incentive using demand curves (Figure 2), which empirically characterize how different individuals respond differently to the same incentive. These demand curves offer a systematic and easily-generalized approach that can be used to capture the effects of any given type of incentive (direct cash, lottery rewards, etc.).
Figure 2.
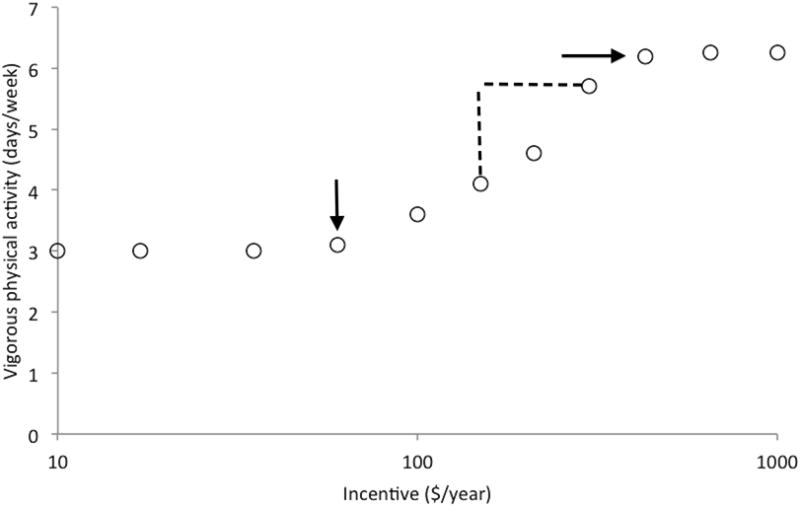
Demand curves capture key aspects of individual behavioral responses to incentives. Key points captured in individual demand curves are: pre-existing levels of physical activity, the amount of monetary incentive required to initiate an increase in activity (breakpoint, vertical arrow), change in behavior given incremental change in incentive level (elasticity, dashed line vertical length divided by horizontal length), steady-state maximum activity that an individual is capable of or willing to perform at the highest levels of incentive deemed feasible by the program (intensity, horizontal arrow).
As shown in Figure 2, each demand curve is shaped by four variables: baseline behavior (e.g., pre-incentive physical activity), breakpoint (minimum incentive size observed to change behavior from the baseline level), elasticity (change in behavior for an incremental change in incentive size above breakpoint, e.g., increased amount of physical activity per each additional $1 of incentive offered per employee per year), and intensity (the maximum behavior level that the individual will or can undergo after the incentive, e.g., the most physical activity a person is willing or able to undertake per unit time).
For any given incentive size, we can use the demand curves from a population of employees to determine the proportion of employees who participate (the proportion for whom the incentive is greater than the breakpoint). In addition we can estimate the degree of behavior change for each participating employee at each incentive level (calculated by the elasticity multiplied by the difference between the incentive size and the breakpoint, up to the maximum intensity level). The change in each employee’s costs is then estimated as their baseline level of cost (e.g., dollars of healthcare spent per year), multiplied by their behavior change at the given incentive level (e.g., increased days per week of physical activity), multiplied by the relative risk reduction for healthcare and absenteeism costs given each unit change in behavior (e.g., change in dollars of healthcare spent for each additional day of physical activity (13)).
Part B: Demonstration analysis for incentivized physical activity programs
To demonstrate the utility of this generalized modeling framework, we conducted an analysis using data from 3,000 worksite programs across the United States that use incentives to motivate employees to be more physically active. To demonstrate the utility of the model, we constructed demand curves of a simulated employee population participating in a physical activity program for a direct cash incentive. We used data published in a review of incentivized programs that included 58,858 employees from 3,000 firms with at least 50 employees in all four industrial categories in the North American Industrial Classification System, studied over the period 2005 to 2010 (11). As detailed in the referenced publication, the change in behavior associated with the incentives was evaluated using propensity score matching between participants and non-participants to reduce possible selection biases; composite analyses also used employee- and employer-level fixed effects to isolate the impact of the incentives on changes in physical activity. We estimated the key parameters for the model from these data: the estimated demand curves for individual employees, the proportion of the population in need of increased vigorous physical activity as defined by standard CDC criteria (14), as well as typical participation and retention rates and costs of program operation (see Appendix Table 1 for parameter estimates). Using repeated Monte Carlo sampling from the probability distributions of each demand curve parameter, including their estimated joint distribution using a copula function (15), we constructed individual demand curves for a simulated employer with 3,300 employees (the average size of medium-to-large size firms in the U.S., which we varied in subsequent sensitivity analyses) (16). Figure 3 illustrates the individual demand curves. As shown, the demand curves capture the breadth of variation in individual responses to the same incentive, including individuals who do not participate.
Figure 3.
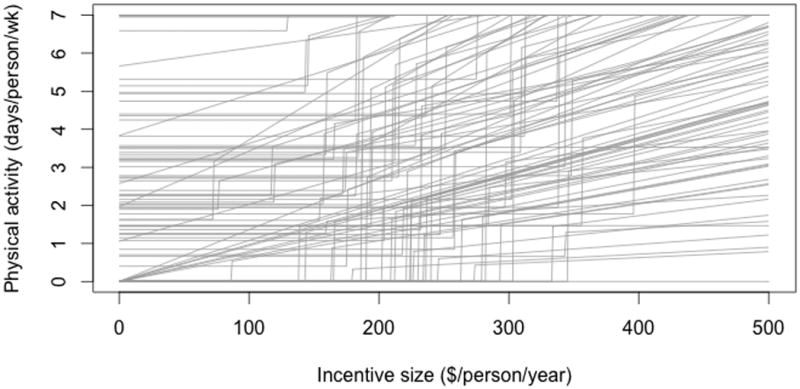
Individual demand curves reveal that different people have different responses to the same incentive program, as well as different degrees of behavior change in response to increases in incentive size. The figure shows an example of individual-level demand curves among a subset of simulated employees participating in an incentive program, reflecting the increased number of days of vigorous physical activity (>20 min/day) per person as a function of incentive size offered.
To calculate costs averted per individual employee, individuals in our simulated population were assigned demographic, employment, and disease characteristics correlated with their physical activity levels. Demographic characteristics were age and sex, matching Bureau of Labor Statistics data for the U.S. workforce at the end of 2013, to generate a nationally-representative population (Appendix Table 2) (17). Individual employment characteristics included the probability per year of leaving the company or having a new person enter the company, using nationally-representative labor participation data (18,19). We estimated the total healthcare and absenteeism costs using estimates of employer-paid healthcare expenditures and absenteeism costs attributable to physical inactivity (20). We chose these two metrics as they are the most common outcomes reported for incentivized behavior change programs. Model users can add additional company-level costs besides healthcare and absenteeism costs to the model, as data become available.
We used a vector search algorithm in which the employee population was simulated 10,000 times, repeatedly sampling from the input parameters defining individual demand curves and associated cost outcomes at each incremental incentive size along the range of user-defined incentive size options. We included the range of incentive sizes observed in the literature review of cash-based physical activity programs ($0 to $2,000/person/year). We then searched for the incentive size that would lead to a marginal ROI equal to one (the point before which each $1 spent results in at least $1 return on investment, and beyond which each $1 spent results in less than $1 in return, Figure 4A). We included an adjustable 30% overhead rate. All costs were expressed in 2014 US dollars and integrated at a standard 3% annual discount rate over a 10-year time horizon (21).
Figure 4.
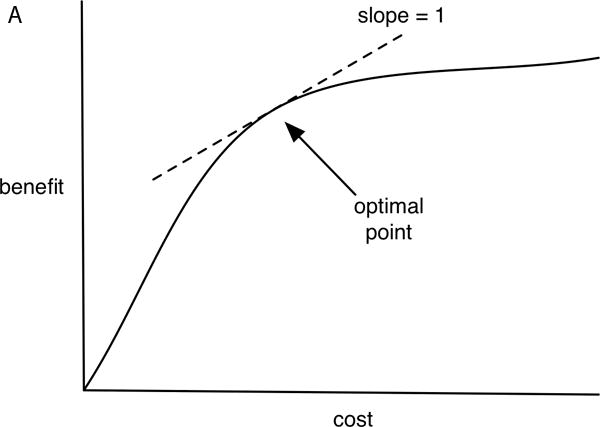
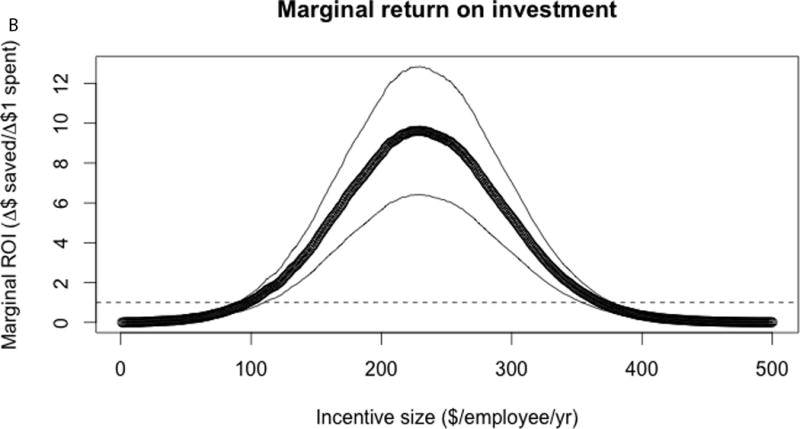
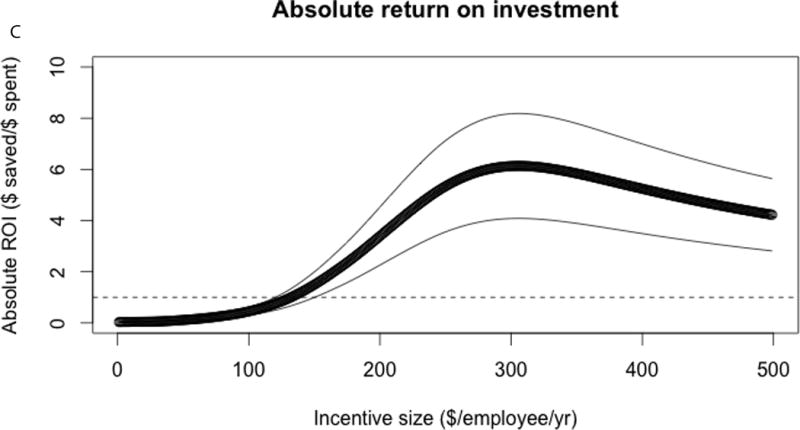
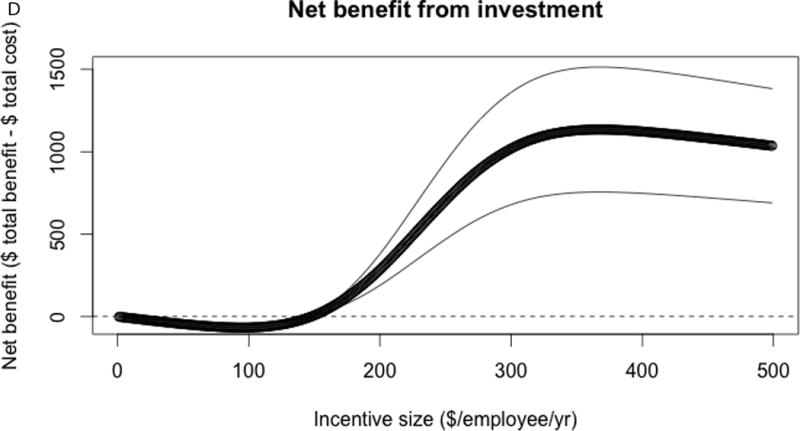
Optimization of the model. The optimization process attempts to find (A) the point where marginal return on investment (the slope of the cost v. benefit curve) equals 1, which is the point where net benefits (total dollars of cost averted minus total dollars spent) is maximized. (B) Marginal return on investment (dollars of costs averted for each additional $1 spent) increases then decreases with greater incentive size, ultimately falling below $1 of savings for each $1 spent on incentives. Here we use physical activity program data from a national sample of cash-benefit physical activity programs as inputs to the model (11). The mean result from 10,000 repeated replications of the model is illustrated as a thick black line, with 95% confidence intervals as thin gray lines. For reference, we also show the (C) absolute return on investment (total dollars of costs averted divided by total dollars spent), and (D) net benefit (total dollars of costs averted minus total dollars spent) per employee. Total benefits and total costs are plotted in Appendix Figure 2.
Sensitivity analyses
In our first sensitivity analysis, we examined how much self-selection could be tolerated in a given incentive program while still achieving a positive absolute ROI. We calculated what percent of program participants could be among the top 10% of the physical activity distribution within the employee population (the most active 10%) while still ensuring net positive absolute ROI. We altered the distribution of demand curves such that an increasing proportion of program participants in the incentive scenarios were individuals in the top 10% of the activity distribution in the population, by assigning a number of the lower breakpoints to this high activity group. The baseline results we report are for a scenario in which 10% of the participant population is “self-selected”. We then varied the level of self-selection from 0% to 50% to examine the impact of lower or higher self-selection on costs and ROI estimates.
Second, we conducted a standard multivariate sensitivity analysis, in which we performed repeated Monte Carlo sampling from log-normal probability distributions of each input parameter (provided in the Appendix tables) to identify how variations the value of each inputed parameter affected primary outcomes from the model (22).
Results
Face validity of the demonstration analysis of physical activity programs
We tested the model for internal validity by ensuring that outcome estimates from the model matched available outcomes from a systematic review from which the input data were obtained (11). We observed that the model estimated a pre-incentive mean of 2.6 days per week of physical activity (95% CI: 0.5–3.9) as compared to the observed rate of 2.4 days. The model also estimated a participation rate of 9.4% (95% CI: 1.1–19.5%) after applying the average annual incentive of $143 per employee observed among employers in the dataset; the observed rate was 9.7%, suggesting that the demand curve approach provided a reasonable estimate of participation. The model further estimated that physical activity among participants in the incentive program would average 4.2 days per week (95% CI: 2.7–6.3), which was close to the observed 4.4 days, suggesting that the demand curve approach was also able to provide reasonable estimates of behavior change. Finally, the model estimated an annual $144 (95% CI: $16–314) per employee healthcare cost reduction due to the incentive program, as compared to the observed level of $157, suggesting that the hazard function approach to calculating costs provided reasonable estimates of healthcare cost reduction. Outcome costs for absenteeism were not reported in the systematic review of input data; the model estimated an annual $269 (95% CI: $137–421) in absenteeism cost savings, versus the reported $294 in an independent systematic review of similar programs (10).
Optimization
The model revealed a non-linear relationship between the incentive size offered to employees and the marginal ROI to the company (Figure 4). As shown in Figure 4B, the simulated company had a peak marginal ROI of $9.62 per incremental dollar spent (95% CI: $6.41–$12.84) at an incentive size of $230 (95% CI: $221–$240); subsequently, the marginal ROI declined, reaching a value of $1 saved for each $1 spent at the incentive size of $367 per employee per year (95% CI: $352–$382). The $367 incentive was the level that maximized net benefits (total benefits minus the total costs), at $1,135 per employee per year (95% CI: $756–$1,514). The “optimal” incentive level of $367 contrasts with the currently reported average of $143 per year (11); at the current incentive level of $143, the marginal ROI is $3.49 (95% CI: $2.32–$4.66) and net benefit is −$5.69 per employee (95% CI: −$3.79 to −$7.58). Notably, as shown in Figure 4C and 4D, at incentive sizes below $145 dollars per year, the net benefit was negative, meaning the program lost net revenue.
At the “optimal” incentive size of $367, at most 72% of eligible individuals would be expected to enroll and participate in some capacity in the physical activity incentive program (versus 9.4%), which is similar to enrollment levels observed in the highest-return published programs at present (23). However, the actual degree of behavior change given participation was widely varying, with most participants still undertaking low to moderate levels of physical activity despite the incentive; average activity would increase by 3.0 days per week from baseline, but 73% of participants would not engage in physical activity on a weekly basis (in other words, they would be intermittent participants). Note, these results assume 10% self-selection, meaning that 10% of individuals in the program come from the top 10% of the physical activity distribution. The sensitivity analysis below provides alternative results at different selection levels.
Sensitivity analyses
In our first sensitivity analysis, we calculated how much self-selection could be tolerated while still maintaining a net positive absolute ROI from the program from the company perspective (Figure 5). We conducted 10,000 simulations of the model, varying the proportion of the incentive program participants who were from the top 10% of the physical activity distribution (the proportion least “in need” of incentives to change their activity). As shown in Figure 5, as higher proportions of the participant population “self-selected”, both the absolute and marginal ROI from the program dropped rapidly (Figure 5), such that the cost of the program exceeded its benefits. If greater than 17% of enrollees were from the top 10% of the activity distribution, the cost of the program would be expected to always be greater than its benefits in terms of absolute ROI. The maximum absolute ROI, as shown in Figure 5, approaches zero as the self-selection rate increases.
Figure 5.
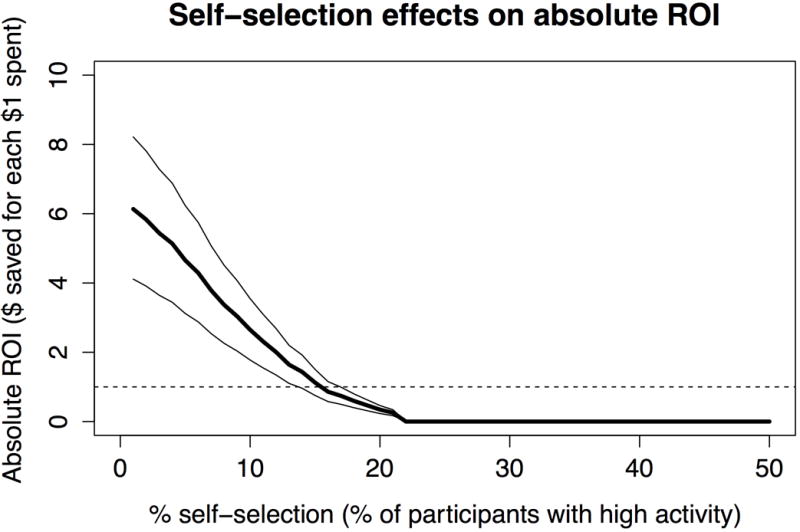
Self-selection can dramatically lower return on investment for a company sponsoring a physical activity incentive program. The proportion of the incentive program made up by those individuals in the top 10% of the physical activity distribution for the population (the “self-selection” proportion) was varied, and the model repeated 10,000 times to examine the effect of such self-selection on absolute return on investment. As shown, if more than 17% of the participants in the program were from the top 10% of the activity distribution, maximum absolute return on investment would fall below $1 returned for each $1 invested.
We additionally varied parameter values across their full ranges provided in the Appendix tables. As shown in Appendix Table 3, a critical parameter in the model was the baseline healthcare and absenteeism costs within the population. We found that worksite populations having very high baseline cost levels would achieve a marginal ROI of 1 at larger incentive sizes; that is, a larger incentive size would become the optimal size for any given incentive program from an employer’s perspective if the worksite population had a higher risk than the average U.S. risk level for accumulating healthcare costs. For each 10% increase in the baseline healthcare costs in the population, we observed the optimal incentive size would increase by 3%. We also observed how variations in age of the employer population would be expected to change the results. We observed that older employee populations would be expected to have greater benefits from the program from the employer perspective. For example, if the mean age of the employer population increased by 10 years over the national average, the optimal incentive size would increase by 9%.
Discussion
While increasingly popular among mid- to large-size employers, using financial incentives to induce health behavior change at worksites has been controversial, in part due to poor scientific quality and generalizability of the studies conducted in the field to date (24). Thus two fundamental questions have been left unanswered: what level of incentive should be offered for any given type of incentive program, and among which employees, to generate net economic returns on investment? Here, we constructed the first modeling framework that can systematically identify how to optimize economic outcomes from behavior change programs using financial incentives by integrating commonly-collected data on behavior and associated costs.
In applying this approach to data from a national sample of worksite physical activity programs, the model provided internally-valid estimates of participation rates, behavior change, and associated costs. Levels of incentive size at which marginal return on investment reached 1 (the point before which each $1 spent results in at least $1 return on investment, and beyond which each $1 spent results in less than $1 in return) are potentially higher than current average incentive sizes offered to individual employees for participation in such physical activity programs. Using the national physical activity program data, we found that if more than 17% came from the top 10% of the physical activity distribution, the absolute return on investment would fall below $1 saved for each $1 spent. While a model cannot determine how to solve the self-selection problem (an important task for behavioral economic and psychological field experiments), the model assisted in understanding what goals might be set for real-world trials and implementation projects to achieve long-term desired economic results. Once high-quality, independent, and long-term data become available from the wellness program field, as a complement to the review we used of existing physical activity programs, it will be possible to further externally validate the model’s estimated outcomes and refine this first-stage, “backbone” model to account for more complexities of programs that offer health incentives.
Our generalized approach to modeling programs using financial incentives to motivate behavior change adds significant new insights to the existing literature. First, it offers an opportunity to create a systematic framework for the wide-scale study of programs that have typically been evaluated through short-term single-site case studies. By using the framework for characterizing individual demand curves for any given incentive type (e.g., direct cash, penalties, participation lotteries, outcomes rewards, etc.) and any given health behavior (e.g., physical activity, tobacco smoking, etc.), the proposed modeling framework can be applied to numerous behavior change programs, and can be easily extended to cover multiple programs and multiple behaviors, as each set of demand curves are generated and associated costs can be integrated and analyzed with the optimization approach.
Second, our modeling framework offers the opportunity to integrate individual-level observed behavior changes to system-level economic costs because the simulation approach includes age-specific behavior and cost risk tabulation over longer time durations than is typically feasible to study in a single case study or field trial; most behavior changes of interest are related to chronic disease risk, and therefore take significant periods of time to manifest population-level health benefits. While we used the demographic factors of age and sex in our assessment to characterize demand curves, a variety of more complex features can be used to decompose the drivers of behavior, such as motivational interviewing scales, various psychological metrics of propensity to participate, and data on co-morbid conditions among employees. These factors are straightforward to incorporate into the microsimulation framework we describe here, but would be otherwise challenging to include in a standard spreadsheet-type analysis.
Third, studies estimating returns on investment from wellness programs in the past have been heavily criticized for poor methodological quality as short-term outcomes estimates that are confounded by unequal disease risks between participating and non-participating subjects (24–26). Systematic reviews of such programs have found wide variations in outcomes, from net economic losses to very high absolute ROI values that independent reviewers have found difficult to validate or replicate (3–5,10,27,28). The differences between these results are likely not only due to publication biases and differences in evaluation methodology, but also to differences in how incentives are delivered, what incentive sizes are offered, what health behaviors are incentivized, whether participation alone or actual outcomes are incentivized, and what population characteristics are manifest in the incentivized population. Our framework allows for systematic comparisons across programs, such that each of these factors can be understood in isolation and in combination, allowing program managers to identify which key “levers” in their specific system might be pulled to make the most improvements to their existing or planned wellness programs.
Finally, our framework offers the opportunity to develop benchmarks and targets for program design, such as the self-selection threshold we estimated from existing physical activity program data.
As with any simulation model, our analysis is based on the premise that simulation modeling can simplify a complex reality to allow for its systematic evaluation, yet simulation modeling requires assumptions. First, in our baseline model, we assumed that employers would wish to optimize their financial return on investment from the incentive programs. While the time horizon in the model can be adjusted to suit more myopic or more hyperopic planners, the optimization approach is designed to focus on financial returns only, and does not account for the fact that some employers may use incentives for other purposes, such as to attract new hires or for general sentiments of well-being in a company even if net returns in terms of healthcare or absenteeism cannot be achieved. However, even if this is the case, the model will still assist in estimating healthcare and absenteeism costs averted, along with any additional user-defined costs averted by the program. This output can be useful in helping employers plan for expected costs over time, and maintain realistic expectations of program impact, which has been a persistent problem in the field (5). Second, our model assumes that individuals in a company confer healthcare and absenteeism costs directly onto the company. Yet some employers pay fixed per member costs that are not varied by health behaviors, such that only absenteeism-related expenditures would be included in the return on investment calculations. Our model is easily modified to accept more types of costs or be simplified by the user as needed. The parameters and input data to the model also focus on mid- to large-size employers, who have been the focus of incentivized wellness programs to date (6); further data are needed from smaller employers to generalize our findings. Third, our model includes non-linear relationships between incentive size and costs, as overhead expenditures per each incremental dollar is lowered with larger incentive sizes. This assumption may not be true for inefficient incentive delivery approaches. Despite these limitations, our model serves as the first, systematic backbone simulation framework to analyze economic outcomes from programs using financial incentives for health behavior change, to inform future analyses and extensions.
Our findings prompt several questions for further experimental research. First, given that variations in disease risk among program participants will critically influence return on investment, it is essential to determine how to successfully enroll “high disease risk” employees through improvement of current screening and recruitment tools (29). At the same time, an ethical dilemma needs to be resolved, as offering incentives more vigorously to some employees more than others may be discriminatory under current labor law (30). Second, the current literature in the field does not include a valid instrument or metric for self-selection, which would be useful in future analyses. This would help establish benchmarks for inclusion and help identify which programs are most effective at targeting the employees with highest needs. Third, it would be compelling to identify which incentive programs are particularly useful for shifting individual demand curves over time, such that incentives can be ultimately removed. That is, temporary rather than permanent incentives, in which briefly offered incentives optimally induce long-term behavior change, would be a major advance that would dramatically improve the return on investment estimates presented here.
Regardless of these future tasks for experimental research, our model provides an initial framework for integrating data from incentive programs into a generalized model of disease outcomes and net costs. Given both the large financial costs of incentive programs, and their potentially large health benefits, it appears critical to study the value of different types of incentive programs, and define how strategies for offering such programs may be better designed to improve health and economic welfare into the future.
Supplementary Material
Acknowledgments
Research reported in this publication was supported by the National Heart, Lung, And Blood Institute of the National Institutes of Health under Award Number K08HL121056. The content is solely the responsibility of the authors and does not necessarily represent the official views of the National Institutes of Health. The funders had no role in the study design, analysis, interpretation, or decision to submit for publication.
References
- 1.Yoon PW, Bastian B, Anderson RN, Collins JL, Jaffe HW, Division of Epidemiology A et al. Potentially Preventable Deaths from the Five Leading Causes of Death—United States, 2008–2010. MMWR Morb Mortal Wkly Rep. 2014;63(17):369–74. [PMC free article] [PubMed] [Google Scholar]
- 2.Cawley J, Ruhm C. The economics of risky health behaviors [Internet] National Bureau of Economic Research. 2011 Available from: http://www.nber.org/papers/w17081.
- 3.Ozminkowski RJ, Ling D, Goetzel RZ, Bruno JA, Rutter KR, Isaac F, et al. Long-term impact of Johnson & Johnson’s Health & Wellness Program on health care utilization and expenditures. J Occup Environ Med Am Coll Occup Environ Med. 2002 Jan;44(1):21–9. doi: 10.1097/00043764-200201000-00005. [DOI] [PubMed] [Google Scholar]
- 4.Goetzel RZ, Baker KM, Short ME, Pei X, Ozminkowski RJ, Wang S, et al. First-year results of an obesity prevention program at The Dow Chemical Company. J Occup Environ Med Coll Occup Environ Med. 2009;51(2):125. doi: 10.1097/JOM.0b013e3181954b03. [DOI] [PMC free article] [PubMed] [Google Scholar]
- 5.Caloyeras JP, Liu H, Exum E, Broderick M, Mattke S. Managing Manifest Diseases, But Not Health Risks, Saved PepsiCo Money Over Seven Years. Health Aff (Millwood) 2014;33(1):124–31. doi: 10.1377/hlthaff.2013.0625. [DOI] [PubMed] [Google Scholar]
- 6.Aon Hewitt Health care survey: better health, better results. New York: Aon Hewitt; 2012. [Google Scholar]
- 7.Volpp KG, Asch DA, Galvin R, Loewenstein G. Redesigning Employee Health Incentives – Lessons from Behavioral Economics. N Engl J Med. 2011 Aug 4;365(5):388–90. doi: 10.1056/NEJMp1105966. [DOI] [PMC free article] [PubMed] [Google Scholar]
- 8.Hagger MS, Keatley DA, Chan DC, Chatzisarantis NL, Dimmock JA, Jackson B, et al. The Goose Is (Half) Cooked: a Consideration of the Mechanisms and Interpersonal Context Is Needed to Elucidate the Effects of Personal Financial Incentives on Health Behaviour. Int J Behav Med. 2013:1–5. doi: 10.1007/s12529-013-9317-y. [DOI] [PubMed] [Google Scholar]
- 9.Lynagh MC, Sanson-Fisher RW, Bonevski B. What’s good for the goose is good for the gander. Guiding principles for the use of financial incentives in health behaviour change. Int J Behav Med. 2011:1–7. doi: 10.1007/s12529-011-9202-5. [DOI] [PubMed] [Google Scholar]
- 10.Baicker K, Cutler D, Song Z. Workplace Wellness Programs Can Generate Savings. Health Aff (Millwood) 2010 Feb 1;29(2):304–11. doi: 10.1377/hlthaff.2009.0626. [DOI] [PubMed] [Google Scholar]
- 11.Mattke S, Liu H, Caloyeras JP. Workplace wellness programs study, final report. RAND Health. 2013 May;:2013. [PMC free article] [PubMed] [Google Scholar]
- 12.Rahmandad H, Sterman JD. Reporting guidelines for simulation-based research in social sciences. Syst Dyn Rev. 2012;28(4):396–411. [Google Scholar]
- 13.Lim SS, Vos T, Flaxman AD, Danaei G, Shibuya K, Adair-Rohani H, et al. A comparative risk assessment of burden of disease and injury attributable to 67 risk factors and risk factor clusters in 21 regions, 1990–2010: a systematic analysis for the Global Burden of Disease Study 2010. The Lancet. 2012 Dec;380(9859):2224–60. doi: 10.1016/S0140-6736(12)61766-8. [DOI] [PMC free article] [PubMed] [Google Scholar]
- 14.CDC. Physical activity guidelines for Americans. Atlanta: CDC; 2008. [Google Scholar]
- 15.Hofert M, Mächler M. Nested Archimedean copulas meet R: The nacopula package. J Stat Softw. 2011;39(9):1–20. [Google Scholar]
- 16.U. S. Census Bureau. Statistics about Business Size (including Small Business) [Internet] Washington D.C.: U.S. Census Bureau; 2013. Available from: http://www.census.gov/econ/smallbus.html. [Google Scholar]
- 17.US Bureau of Labor Statistics. Demographics (CPS) [Internet] 2012 [cited 2013 Jul 21]. Available from: http://www.bls.gov/cps/demographics.htm#age.
- 18.Bureau of Labor Statistics. Job Openings and Labor Turnover Survey Home Page [Internet] 2013 [cited 2013 Aug 14]. Available from: http://www.bls.gov/jlt/
- 19.Gallup Research Service. Economy and Personal Finance survey. Washington D.C.: Gallup; 2013. [Google Scholar]
- 20.Chenoweth D, Sugerman SB. The economic costs of physical inactivity, obesity, and overweight in california adults: Health care, workers’ compensation, and lost productivity. California Department of Health Services; 2005. [Google Scholar]
- 21.Siegel JE, Weinstein MC, Russell LB, Gold MR. Recommendations for reporting cost-effectiveness analyses. JAMA J Am Med Assoc. 1996;276(16):1339–41. doi: 10.1001/jama.276.16.1339. [DOI] [PubMed] [Google Scholar]
- 22.Blower SM, Dowlatabadi H. Sensitivity and uncertainty analysis of complex models of disease transmission: an HIV model, as an example. Int Stat Rev Int Stat. 1994:229–43. [Google Scholar]
- 23.The Commonwealth Fund. Safeway Senior Vice President Ken Shachmut Talks about Holding Health Care Costs Steady, for Four Straight Years, Do-It-Yourself Health Reform, and $8,000 Colonoscopies. Purch High Perform. 2009 Nov 3; [Google Scholar]
- 24.Engbers LH, van Poppel MN, Chin A, Paw MJ, van Mechelen W. Worksite health promotion programs with environmental changes: a systematic review. Am J Prev Med. 2005;29(1):61–70. doi: 10.1016/j.amepre.2005.03.001. [DOI] [PubMed] [Google Scholar]
- 25.Benedict MA, Arterburn D. Worksite-based weight loss programs: a systematic review of recent literature. Am J Health Promot. 2008;22(6):408–16. doi: 10.4278/ajhp.22.6.408. [DOI] [PubMed] [Google Scholar]
- 26.Proper KI, Staal BJ, Hildebrandt VH, Van der Beek AJ, Van Mechelen W. Effectiveness of physical activity programs at worksites with respect to work-related outcomes. Scand J Work Environ Health. 2002;28(2):75–84. doi: 10.5271/sjweh.651. [DOI] [PubMed] [Google Scholar]
- 27.Osilla KC, Van Busum K, Schnyer C, Larkin JW, Eibner C, Mattke S. Systematic review of the impact of worksite wellness programs. Am J Manag Care. 2012 Feb;18(2):e68–81. [PubMed] [Google Scholar]
- 28.Chapman LS. Meta-evaluation of worksite health promotion economic return studies: 2005 update. Am J Health Promot. 2005;19(6):1–11. doi: 10.4278/0890-1171-19.4.TAHP-1. [DOI] [PubMed] [Google Scholar]
- 29.Hooper JM, Veneziano L. Distinguishing starters from nonstarters in an employee physical activity incentive program. Health Educ Behav. 1995;22(1):49–60. doi: 10.1177/109019819502200106. [DOI] [PubMed] [Google Scholar]
- 30.Horwitz JR, Kelly BD, DiNardo JE. Wellness Incentives In The Workplace: Cost Savings Through Cost Shifting To Unhealthy Workers. Health Aff (Millwood) 2013 Mar 1;32(3):468–76. doi: 10.1377/hlthaff.2012.0683. [DOI] [PubMed] [Google Scholar]
Associated Data
This section collects any data citations, data availability statements, or supplementary materials included in this article.


