Significance
In addition to their well-documented roles in energy metabolism and heme biogenesis, mitochondria also play an important role in intracellular signaling, which is important for tissue and organ development. We previously showed that a cytosolic siderophore facilitates mitochondrial iron import in eukaryotes. Depletion of the siderophore by inactivating 3-hydroxy butyrate dehydrogenase 2 (bdh2), whose gene product is necessary for siderophore biogenesis, results in heme deficiency and delays erythroid maturation in developing zebrafish embryo. Here we show that inactivation of bdh2 results in mitochondrial dysfunction, triggers their degradation by mitophagy, and hampers erythroid maturation. Reestablishment of bdh2 restores mitochondrial function, prevents premature mitochondrial degradation, and promotes erythroid maturation. Our results demonstrate that mitochondrial communication with the nucleus is critical for erythroid development.
Keywords: bdh2; 2,5-DHBA; mitophagy; retrograde signaling; erythroid maturation
Abstract
Mitochondria are the site of iron utilization, wherein imported iron is incorporated into heme or iron–sulfur clusters. Previously, we showed that a cytosolic siderophore, which resembles a bacterial siderophore, facilitates mitochondrial iron import in eukaryotes, including zebrafish. An evolutionarily conserved 3-hydroxy butyrate dehydrogenase, 3-hydroxy butyrate dehydrogenase 2 (Bdh2), catalyzes a rate-limiting step in the biogenesis of the eukaryotic siderophore. We found that inactivation of bdh2 in developing zebrafish embryo results in heme deficiency and delays erythroid maturation. The basis for this erythroid maturation defect is not known. Here we show that bdh2 inactivation results in mitochondrial dysfunction and triggers their degradation by mitophagy. Thus, mitochondria are prematurely lost in bdh2-inactivated erythrocytes. Interestingly, bdh2-inactivated erythroid cells also exhibit genomic alterations as indicated by transcriptome analysis. Reestablishment of bdh2 restores mitochondrial function, prevents premature mitochondrial degradation, promotes erythroid development, and reverses altered gene expression. Thus, mitochondrial communication with the nucleus is critical for erythroid development.
The zebrafish (Danio rerio) is a well-established model system to study vertebrate hematopoiesis: zebrafish hematopoiesis is strikingly similar to mammalian hematopoiesis, and zebrafish have inherent experimental advantages (1). In the zebrafish embryo, hematopoiesis occurs in spatially distinct steps: the primitive or first wave of hematopoiesis occurs in two distinct anatomical locations, the posterior lateral mesoderm, which forms the intermediate cell mass (ICM) and is the site of erythroid development, and the anterior lateral mesoderm, which is the site of myeloid development. The definitive or second wave of hematopoiesis arises from self-renewing hematopoietic stem cells located in the wall of dorsal aorta (2, 3). These two waves of hematopoiesis are tightly controlled at the transcriptional level (4, 5).
In erythropoiesis, pluripotent hematopoietic stem cells give rise to committed erythroid progenitor cells and to additional progenitors and precursors (6). The earliest committed erythroid progenitor is the burst-forming unit erythroid, which differentiates to produce CFU-erythroid (7). Terminal erythropoiesis begins at this stage and involves as many as six terminal divisions, differential regulation of erythroid-specific genes, nuclear changes, and extrusion of mitochondria (all species) and the nucleus (mammals) (6). Terminal erythropoiesis involves predominantly three cell types: proerythroblasts, basophilic erythroblasts, and polychromatophilic erythroblasts, which undergo morphologically distinguishable pattern of differentiation (8). In terminal erythropoiesis, polychromatophilic/orthochromatophilic erythroblasts give rise to reticulocytes. Reticulocytes lose all of their organelles, including mitochondria (8). The primary method used to eliminate mitochondria is mitophagy, a form of macroautophagy in which cell lysosomes engulf defunct or disabled organelles in an orderly process (9). The importance of autophagy in erythropoiesis is exemplified by the fact that mice bearing deletions in autophagy genes retain mitochondria in mature erythrocytes (10). Mitochondria retention in erythrocytes significantly reduces their life span because of the elevation of reactive oxygen species (ROS) (11).
Paradoxically, mitochondria also play an important role during early erythroid development. In addition to their roles in heme biogenesis and energy metabolism, they influence nuclear gene expression through mechanisms collectively known as “retrograde signaling” (12). This mode of signaling is implicated in disparate biological processes, including development and aging, and its deregulation contributes to a variety of diseases associated with mitochondrial dysfunction (13). The significance of this signaling in erythropoiesis is not known.
Iron is the binding site for gases in carrier proteins and a cofactor for many important cellular enzymes, thus making it indispensable for organisms living in oxygen-rich environments (14, 15). Eukaryotic cells acquire iron from transferrin (Tf), and the newly acquired iron then enters into a cytosolic labile iron pool (LIP) (14, 16). This pool of iron, which is metabolically active, is chelated by a variety of low molecular weight compounds, including siderophores, to prevent iron from being reactive (17, 18). The majority of LIP is used by mitochondria for heme and iron sulfur cluster biogenesis (19). Although proteins that facilitate mitochondrial iron import such as mitoferrin (Mfn) are known, the mechanism by which elemental iron is imported into mitochondria remains unknown (14). We previously showed that a siderophore-like molecule, 2,5-dihydroxybenzoic acid (2,5-DHBA) ferries iron into mitochondria (18). Interestingly, 2,5-DHBA is synthesized by an evolutionarily conserved pathway, and BDH2, a homolog of bacterial EntA, catalyzes a rate-limiting step (18). Knockdown of bdh2 results in siderophore depletion and as a consequence confers heme deficiency, an iron-dependent mitochondrial process, in cultured cells, yeast, zebrafish, and mice (18, 20). We also found that bdh2 inactivation increased erythrocyte immaturity in zebrafish embryos. Collectively, these observations suggest that the siderophore plays an important role in mitochondrial iron import.
In this report, we investigated the basis for a defect in erythroid maturation in bdh2-inactivated zebrafish embryos. We found that mitochondria are prematurely lost via mitophagy during erythroid development. Premature loss of mitochondria in erythroid cells results in altered nuclear gene expression, specifically the transcription program controlled by the transcription factor B-myb. Reintroduction of bdh2 reverses this defect and promotes erythroid development.
Results
Delayed Erythrocyte Maturation in bdh2 Inactivated Zebrafish Embryos.
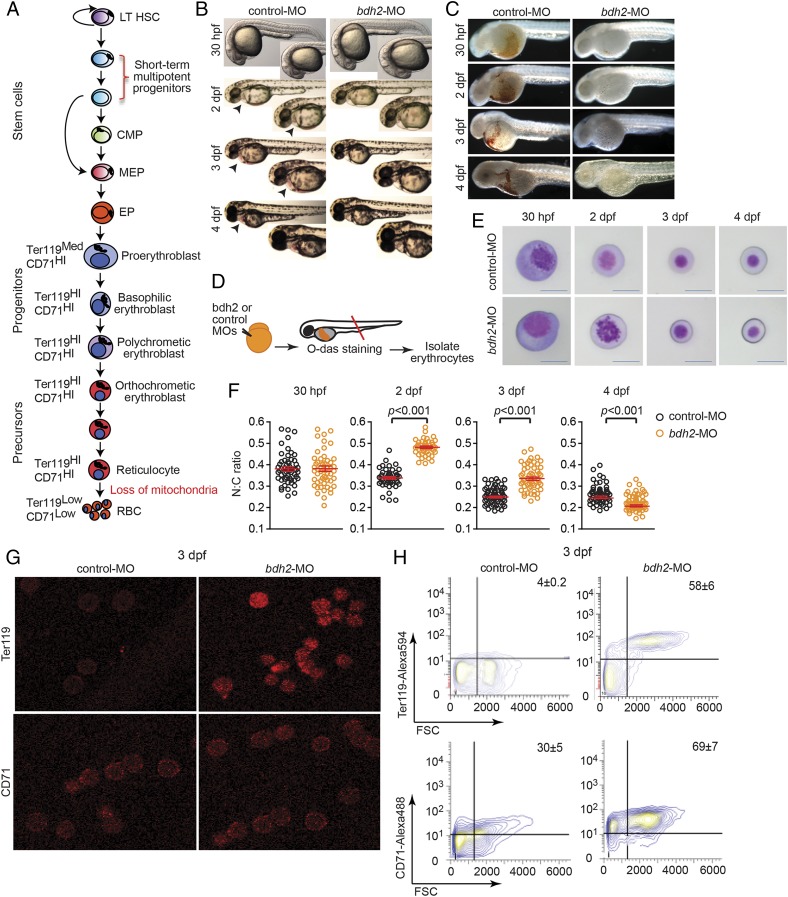
We have previously shown that bdh2 is a critical regulator of the siderophore 2,5-DHBA and that its absence results in complete abrogation of 2,5-DHBA biogenesis in cultured cells, yeast, zebrafish embryo, and mice (18, 20). We also found that bdh2 inactivation results in hypohemoglobinization and reduced erythrocyte maturation in zebrafish embryos (18). To study the requirement of bdh2 in the development of erythroid cells, we systematically scrutinized erythrocyte development in bdh2-inactivated embryos. Each stage is characterized by distinct morphological, biochemical, and surface marker expression changes (Fig. 1A) (21, 22). Proerythroblasts, which are basophilic and contain a large, granular nucleus, differentiate into mature cells, which are acidophilic and contain a dense nucleus. The change in nucleus-to-cytoplasm (N:C) ratio is a quantifiable marker for differentiation (22). In addition to these changes, there is an overall reduction in the diameter of the cells from proerythroblasts to erythrocytes (22).
Fig. 1.
Bdh2 inactivation alters erythroid maturation. (A) Schematic depiction of vertebrate erythropoiesis. (B) Morphology of zebrafish embryos injected with control or bdh2 (to deplete the siderophore) MOs. Representative embryos at 2 dpf are shown in lateral views. Embryos are representative of at least 50 embryos per MO. Note absence of red color in bdh2 morphants. (C). Hemoglobin deficiency in bdh2 morphants is demonstrated by O-dianisidine (O-das) staining. Hemoglobin deficiency is reversed by coinjection of synthetic bdh2 mRNA. Representative embryos at 2 dpf are shown in lateral views. Embryos are representative of at least 50 embryos per MO. (D) Functional analysis of isolated erythrocytes from control or bdh2 morphants. Schematic depiction of experimental design. (E) Analysis of circulating erythrocytes from progressively aged morphants expressing control (Top) or bdh2 (Bottom) MOs. Erythrocytes from control MO-injected embryos progressively matured, whereas the immature morphology of erythrocytes persisted in bdh2 morphants. Erythrocytes are representative of the mean groups depicted in F (May–Grunwald/Giemsa stain). (Scale bars: 5 μM.) (F) The N:C ratio is a robust parameter of erythrocyte maturity during early zebrafish hematopoiesis. Scatter plots of the N:C area ratio in control or bdh2 morphants from 30 hpf to 4 dpf are shown. The N:C ratio decreased in both groups but was always greater in bdh2 morphants. Erythrocytes whose morphology was influenced by neighboring cells were excluded in N:C ratio calculations. Horizontal lines indicate mean values. Data are mean ± SD for 300 cells. P < 0.05 was considered significant. (G) Surface staining of erythrocytes isolated from control and bdh2 morphants at 3 dpf with anti-Ter119 and anti-TfR1 (CD71) antibodies. Representative images are depicted. (H) Flow cytometry analysis of erythrocytes isolated from control and bdh2 morphants at 3 dpf stained with anti-Ter119 antibody coupled to Alexa 594 or anti-CD71 antibody coupled to Alexa 488. Cell counts were calculated (mean ± SD).
In conformity with previous findings, bdh2 inactivation resulted in hypohemoglobinization and reduced erythrocyte maturation in zebrafish embryos (Fig. 1 B and C) (18). Stage-specific comparison of circulating erythrocytes from WT and bdh2-inactivated zebrafish embryos revealed delayed maturation in the latter (Fig. 1 D and E). Bdh2-inactivated erythrocytes were larger and contained more basophilic cytoplasm and granular, open nucleus (Fig. 1E). In addition to these morphological changes, we also found that the N:C ratio was higher in bdh2-inactivated erythrocytes at 2 and 3 d post fertilization (dpf), further confirming the delay in maturation (Fig. 1F).
We also examined erythrocyte maturation in erythrocytes isolated from control and bdh2 morphants by assessing expression of erythroid cell markers glycophorin A-associated Ter119 and Tf receptor 1 (TfR1; CD71). Down-regulation of Ter119 and CD71 mark terminal erythroid differentiation (23, 24). We first assessed Ter119 and CD71 expression by immunofluorescence confocal imaging of erythroid cells fixed and stained with anti-Ter119 or anti-CD71 antibodies. We found that Ter119+ and CD71+ cells are rare in control morphants and, in contrast, bdh2 morphants contained a significantly higher number of Ter119+ and CD71+ cells (Fig. 1G). In addition, the intensity of staining is different in control and bdh2 morphants, with erythrocytes from bdh2 morphants displaying higher intensity of staining compared with erythrocytes from control morphants (Fig. 1G). We next quantified cells expressing Ter119 and CD71 by flow cytometry. Bdh2-inactivated zebrafish embryos contained a higher number of Ter119+ and CD71+ erythroid cells (Fig. 1H). In contrast, control morphants contained more Ter119− CD71− erythrocytes (Fig. 1H). Together, these data indicate a developmental delay in bdh2-inactivated erythrocytes.
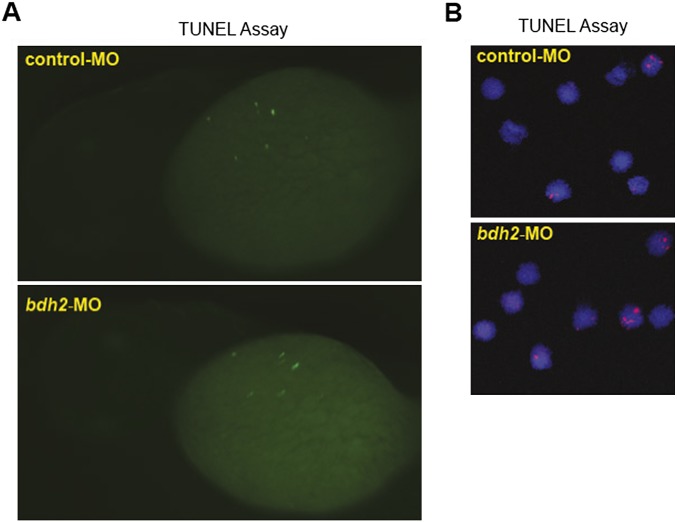
To determine whether the increased percentage of immature erythrocytes in bdh2 inactivated embryos was the result of a population-skewing effect from loss of mature erythrocytes by apoptosis, we analyzed whole embryos injected with control or bdh2 morpholinos (MOs) or isolated erythrocytes from control or bdh2 morphants by TUNEL staining (Fig. S1A). TUNEL staining failed to show excess death of ICM hematopoietic cells or later erythroid cells (Fig. S1B). Combined, these observations suggest that bdh2 is required for hemoglobinization and erythroid maturity, but not for survival.
Fig. S1.
(A) TUNEL staining for apoptotic cells in control and bdh2 morphants. Control or bdh2 morphant embryos at 3 dpf were stained for apoptotic cells by using the TUNEL assay. Despite significant TUNEL staining in the nervous system, there is no excess staining of hematopoietic cells. Embryos are shown in lateral views. (B) TUNEL staining for apoptosis in erythrocytes isolated from control and bdh2 morphants at 3 dpf. Cells were counterstained with DAPI to visualize nuclei.
Reestablishment of bdh2 Reverses the Maturation Defect in bdh2-Inactivated Erythrocytes.
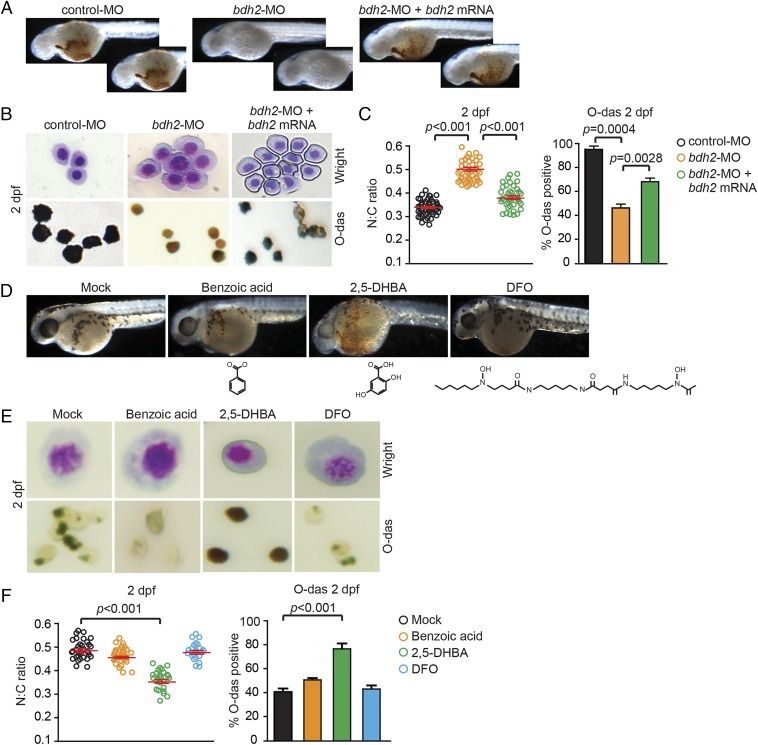
Hypohemoglobinization and erythroid immaturity in bdh2 morphants provided a model for testing whether introduction of bdh2 mRNA is sufficient to rescue hemoglobinization and erythroid maturation in bdh2-inactivated embryos. Reestablishment of bdh2 was achieved by microinjecting a synthetic bdh2 mRNA that is not targeted by the bdh2 MO into bdh2 morphants (18). We found that injection of synthetic bdh2 mRNA partially restored hemoglobinization in bdh2 morphants as demonstrated by O-dianisidine staining of whole embryos as well as isolated erythrocytes (Fig. 2 A–C). Additionally, bdh2 reinstatement resulted in a decrease in immature erythrocyte in bdh2 morphants as demonstrated by morphological assessment following May–Grunwald/Giemsa staining (Fig. 2B). Computation of N:C ratio indicated that restoring bdh2 promoted erythroid maturation in bdh2 morphants (Fig. 2C).
Fig. 2.
Overexpression of bdh2 or siderophore supplementation is sufficient to partially rescue hemoglobinization and erythroid maturation block in bdh2 morphants. (A) Morphological assessment of embryos injected with control or bdh2-specific MOs and bdh2-overexpressing bdh2 morphants. O-dianisidine (O-das) staining confirmed partial restoration of hemoglobinization in bdh2-overexpressing bdh2 morphants. (B) Analysis of circulating erythrocytes from embryos injected with control or bdh2-specific MOs and bdh2-overexpressing bdh2 morphants demonstrating decreased erythrocyte immaturity and partial restoration of hemoglobinization in bdh2-overexpressing bdh2 morphants. (Top) May–Grunwald/Giemsa stain. (Scale bars: 5 μM.) (Bottom) O-das staining. Erythrocytes are representative of the mean groups depicted in C. (C) (Left) The N:C ratio is an indicator of one aspect of a range of morphological features reflecting erythrocyte maturity. Tabulation of the N:C area ratio for erythrocytes isolated from embryos injected with control or bdh2-specific MOs and bdh2-overexpressing bdh2 morphants. Replenishment of bdh2 decreased the N:C ratio in bdh2 morphants. Data are mean ± SD for 300 cells. P < 0.05 was considered significant. (Right) Quantification of O-dianisidine–positive erythrocytes isolated from embryos injected with control or bdh2-specific MOs and bdh2-overexpressing bdh2 morphants. Replenishment of bdh2 restored hemoglobinization in bdh2 morphants. Data are mean ± SD for 300 cells. P < 0.05 was considered significant. (D–F) Supplementation with siderophore but not its chemical paralogs rescues hemoglobinization defect and erythrocyte maturation block in bdh2 morphants. (D) Analysis of whole of embryos. (E and F) Analysis of isolated erythrocytes. Image and data analyses are as in A–C.
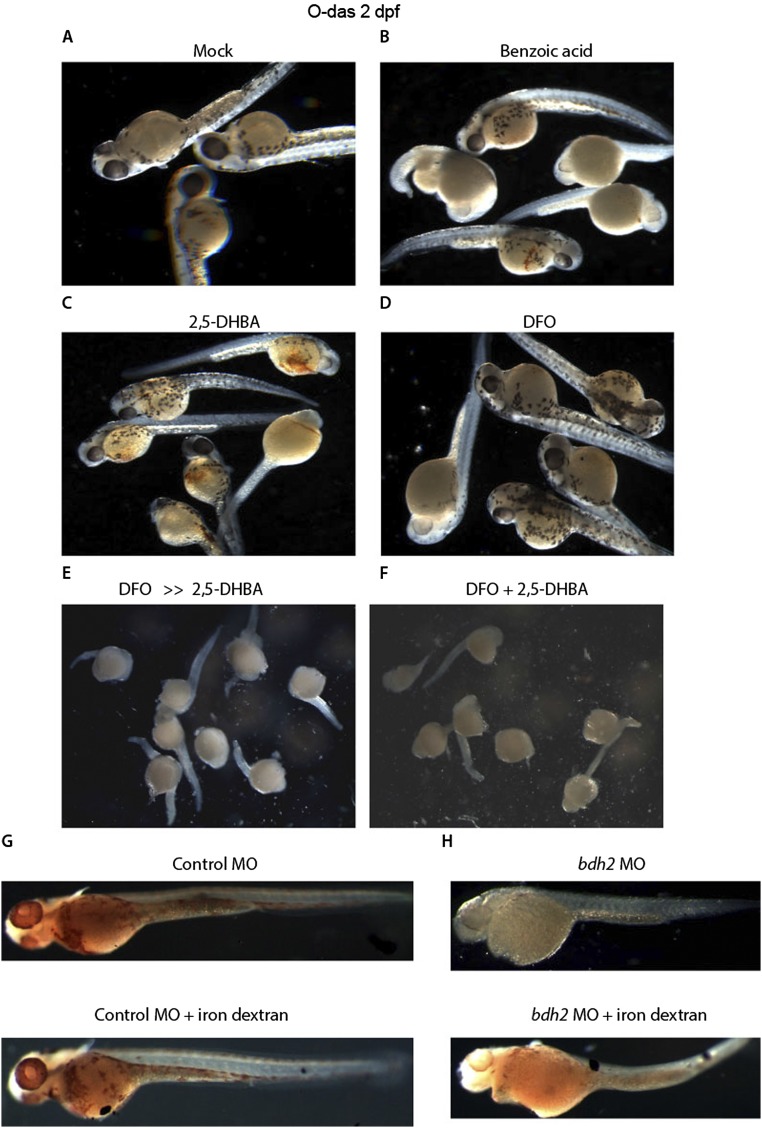
Bdh2 is important for biogenesis of the siderophore 2,5-DHBA (18, 20). We next asked whether supplementation with exogenous siderophore can also rescue the hemoglobinization defect and erythrocyte maturation in bdh2 morphants. To address this question, we coinjected siderophore or its chemical paralogs [benzoic acid or desferrioxamine (DFO), an iron chelator] along with bdh2 MOs into one- or two-cell embryos. The data presented in Fig. 2 D–F and Fig. S2 A–D demonstrate that supplementation with the siderophore, but not its chemical paralogs, resulted in hemoglobinization and erythrocyte maturation in bdh2 morphants. Addition of DFO and 2,5-DHBA, either sequentially or simultaneously, to bdh2 morphants failed to restore hemoglobinization (Fig. S2 E and F). DFO, a hexadentate iron chelator that binds iron more avidly than a bidentate iron chelator such as 2,5-DHBA, abrogated rescue effect of 2,5-DHBA in bdh2 morphants. Interestingly, addition of both DFO and 2,5-DHBA resulted in premature death of embryos associated with iron deprivation. As expected, injection of bdh2 morphants with iron dextran, which bypasses Tf-mediated cellular iron update, did not alleviate mitochondrial iron deficiency in bdh2 morphants (Fig. S2 G and H), confirming that lack of bdh2 results in mitochondrial but not cytoplasmic iron deficiency.
Fig. S2.
(A–F) O-dianisidine staining of bdh2 morphants supplemented with the siderophore or its chemical paralogs. Randomly selected bdh2 morphant embryos showing hypohemoglobinization. Injection of siderophore but not its chemical paralogs restored hemoglobinization. (G and H) Injection of iron dextran (100 mg/mL; Sigma) into bdh2 morphants failed to restore hemoglobinization as judged by O-dianisidine staining.
Together, these observations suggest a requirement for bdh2 for erythroid maturation and hemoglobinization. The partial rescue by introducing bdh2 mRNA or siderophore supplementation in bdh2 morphants indicates that bdh2 alone is sufficient to promote erythroid maturation and normal hemoglobinization.
Reduced Oxygen Consumption in bdh2-Inactivated Zebrafish Erythrocytes.
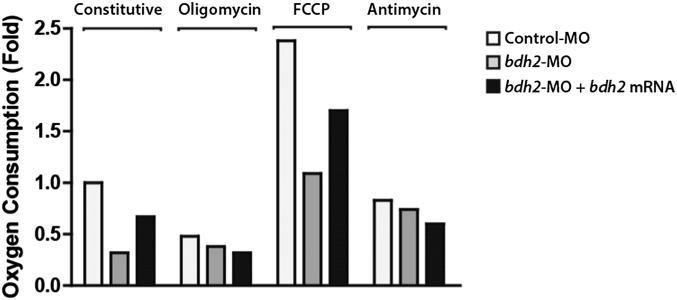
We next sought to determine the molecular basis of the erythroid developmental delay in bdh2-inactivated embryos. Iron-mediated redox reactions are integral for mitochondrial respiration, and mitochondrial iron deficiency often manifests as altered oxygen consumption (11). Thus, we hypothesized that the mitochondrial iron deficiency resulting from bdh2 inactivation contributes to mitochondrial dysfunction. To test this idea, and to assess mitochondrial function in more detail, we measured oxygen consumption in intact erythrocytes isolated from control and bdh2 morphants at 60 h postfertilization (hpf) in the absence or presence of the ATP synthase inhibitor oligomycin and the uncoupling agent carbonyl cyanide p-trifluoromethoxyphenylhydrazone. We found that constitutive oxygen consumption rate of erythrocytes isolated from bdh2 morphants was approximately threefold lower than that of erythrocytes from control morphants (Fig. S3). Upon treatment with oligomycin, this rate was not changed, indicating that oxygen consumption is uncoupled from ATP generation (Fig. S3). The uncoupled respiration of erythrocytes from bdh2 morphants was ∼2.18-fold lower than that of erythrocytes from control morphants, providing evidence that erythrocytes from bdh2 morphants have lower oxidative capacity (Fig. S3). Finally, the low levels of residual oxygen consumption in erythrocytes from both morphants after inhibition of complex III with antimycin A indicates that the measured oxygen consumption was caused almost completely by mitochondrial respiration (Fig. S3). In sum, erythrocytes from bdh2 morphants have a lower level of respiration that is uncoupled from ATP synthesis and lower oxidative capacity than erythrocytes from control morphants.
Fig. S3.
Analysis of mitochondrial activity. Oxygen consumption was measured in intact erythrocytes collected from control or bdh2 morphants or bdh2 morphants injected with synthetic bdh2 mRNA. The fold change in oxygen consumption (basal respiration of erythrocytes from control morphants, n = 1) for erythrocytes collected from morphants with indicated genotype is shown. Data from a representative experiment performed under constitutive or basal conditions, following the addition of oligomycin (2 μg/mL), uncoupler p-trifluoromethoxyphenylhydrazone (FCCP; increments of 0.5 μM), or the complex III inhibitor antimycin A (2.5 μM) is depicted in a histogram. “Constitutive” represents untreated cells.
If the basis for lower oxygen consumption in erythrocytes from bdh2 morphants is indeed lack of bdh2, reestablishment of bdh2 should reverse this defect. To test this prediction, we injected synthetic bdh2 mRNA into bdh2 morphants and measured oxygen consumption in isolated intact erythrocytes. Quantification of oxygen consumption showed that the rate of respiration in erythrocytes from bdh2-restored morphants had nearly the same pattern as erythrocytes from control morphants (Fig. S3).
Mitochondrial Clearance Is Impaired in bdh2-Inactivated Zebrafish Erythrocytes.
Terminal differentiation of reticulocytes involves coordinated elimination of organelles, including mitochondria (10). Although the time required for erythroid differentiation in zebrafish has been established (22), the timeline for mitochondrial removal remains unknown. Therefore, we examined mitochondrial clearance in erythrocytes isolated from embryos at various time points after fertilization by immunofluorescence confocal imaging of anti-OXPHOS complex IV subunit 1 antibody–stained cells. We found that erythrocytes started losing mitochondria as early as 3 dpf and that, by 4 dpf, the majority of erythrocytes had lost mitochondria (Fig. S4). This information enabled us to study mitochondrial clearance in erythrocytes isolated from bdh2-inactivated embryos.
Fig. S4.
Immunofluorescence analysis of erythrocytes isolated from WT embryos at indicated times with OXPHOS subunit 1 antibody.
The reduced oxygen consumption of erythroid cells from bdh2-inactivated zebrafish embryos suggested mitochondrial dysfunction (Fig. S3). Defective mitochondria are eliminated by autophagy (9). To examine the loss of siderophore on mitochondrial clearance, we analyzed erythroid cells isolated from control and bdh2 morphants at 48 hpf by using flow cytometry with mitochondria-specific dyes such as MitoTracker red (MTR) or MitoTracker green (MTG). Staining with MTR or MTG alone provides optimal separation between unstained and stained cells. We found that, in control and bdh2 morphants, 60% (±2%) and 20 (±7%) of circulating erythroid cells were stained, respectively (Fig. 3A). These results suggested that mitochondria are prematurely lost in bdh2 morphants.
Fig. 3.
Mitochondrial clearance is increased in bdh2-inactivated erythrocytes. (A) Flow cytometry of circulating erythrocytes stained with MTR from control and bdh2 morphants. Cell counts are presented as mean ± SD (B) Confocal imaging of MTR-stained circulating erythrocytes from control and bdh2 morphants. Erythrocytes are representative of the mean groups. (C) Immunofluorescence of anti-OXPHOS complex IV subunit 1 antibody–stained circulating erythrocytes from control and bdh2 morphants. Erythrocytes are representative of the mean groups.
To confirm these findings, we performed confocal imaging of circulating erythroid cells isolated from control and bdh2 morphants. Mitochondria were visualized by staining with MTR. We found that erythrocytes isolated from bdh2 morphants are almost devoid of mitochondria, whereas erythrocytes from control morphants had abundant mitochondria (Fig. 3B). Additionally, staining with anti-OXPHOS complex IV subunit 1 antibody also confirmed the loss of mitochondria in erythrocytes from bdh2-inactivated zebrafish embryos (Fig. 3C). Collectively, these results suggest that mitochondria from bdh2-inactivated embryos are lost prematurely.
Ultrastructural Analysis Revealed Localization of Mitochondria in Autophagic Vesicles.
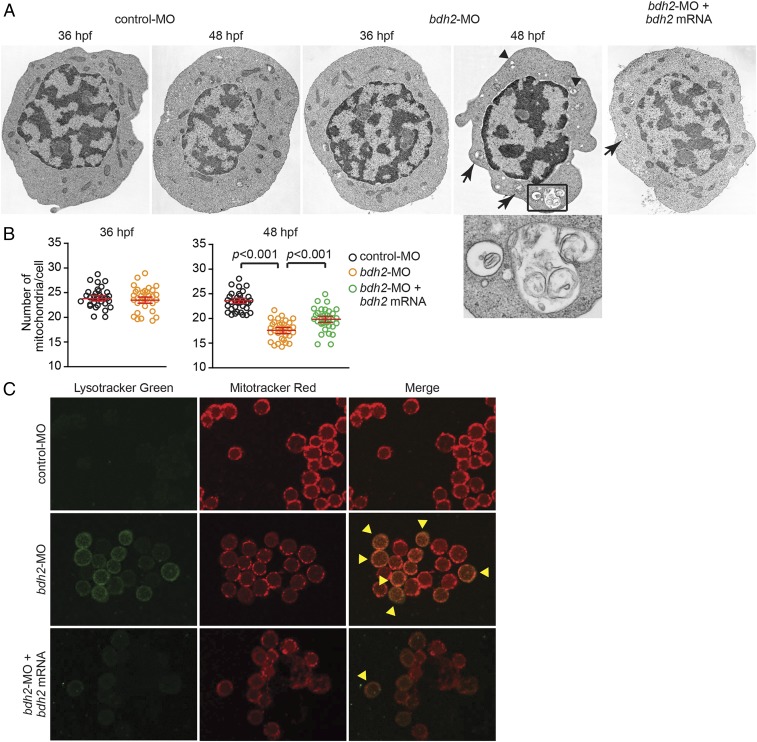
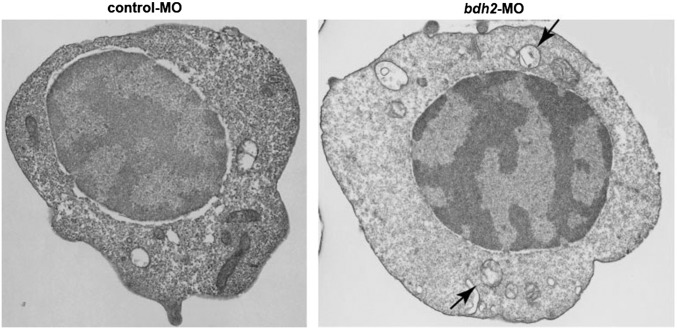
To confirm the role of mitophagy in loss of mitochondria, we performed EM. We found that mitochondrial loss was first observed at 72 hpf in control morphants (Fig. 4 and Fig. S5). Moreover, in comparison with control morphants, a higher number of mitochondria in erythrocytes isolated from bdh2 morphants were found in autophagosomal vesicles as judged by EM analysis at 48 hpf (Fig. 4A, Inset). By contrast, autophagosomes were first detected in erythrocytes isolated from control morphants at 72 hpf (Fig. S5). Interestingly, by 72 hpf, all mitochondria were inside autophagosomes in bdh2 morphants (Fig. S5). These results suggest that mitochondria are prematurely lost in erythroid development in bdh2-inactivated embryos. Restoration of bdh2 by coinjecting synthetic bdh2 mRNA into bdh2 morphants partially prevented the premature loss of mitochondria (Fig. 4 A and B).
Fig. 4.
Bdh2-inactivated erythrocytes contain mitochondria in autophagosomal vesicles. (A) Representative EM images of erythrocytes isolated from control and bdh2 morphants. Arrows indicate autophagosomal vesicles. Arrowheads indicate lysosomal vesicles. (Scale bars: 1 μM.) Area in rectangle is enlarged. (Scale bar: Inset, 100 nM.) (B) Total mitochondria count per cell counted by EM. Data are mean ± SD for 50 cells. P < 0.05 was considered significant. (C) Confocal fluorescent imaging of LysoTracker- and MitoTracker-stained erythrocytes isolated from control and bdh2 morphants or bdh2-overexpressing bdh2 morphants. Arrowheads indicate costained cells. Representative images are depicted.
Fig. S5.
Representative EM image of erythrocytes isolated from control and bdh2 morphants at 3 dpf. (Scale bars: 1 μM.)
The final step of mitophagy is the fusion of autophagosomes containing mitochondria with lysosomes in which the contents of mitochondria are degraded and reused (25). To analyze progression of mitophagy, we costained cells with dyes specific for mitochondria (i.e., MTR) and lysosomes (i.e., LysoTracker). Corroborating the results of EM analysis, we found that mitochondria and lysosomes were colocalized in bdh2 morphants as early as 48 hpf (Fig. 4C). By contrast, fewer mitochondria colocalized with lysosomes in bdh2-restored morphants (Fig. 4C). Lysosomes were barely detectable in control morphants (Fig. 4C).
Suppression of Mitophagy Decreases Erythrocyte Immaturity and Restores Hemoglobinization in bdh2 Morphants.
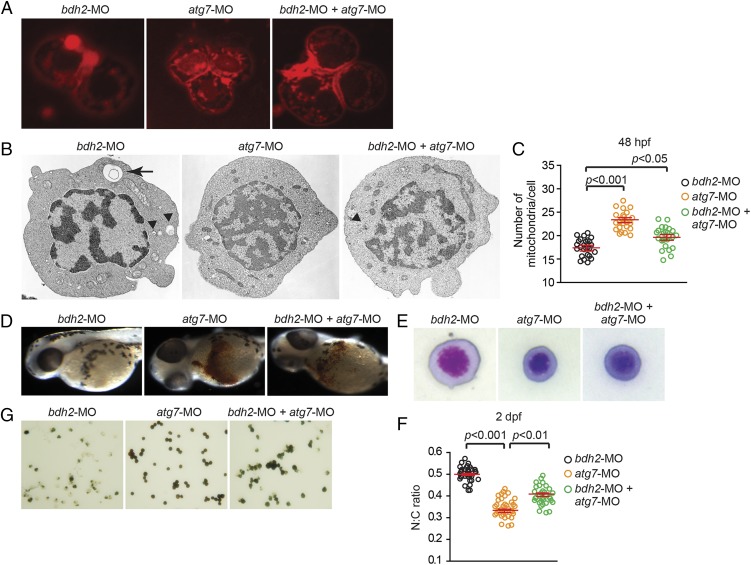
The observations described in Figs. 3 and 4 suggest that mitochondria are lost in erythrocytes at earlier stages by mitophagy. We next asked whether suppression of mitophagy delays the loss of mitochondria in bdh2 morphants. We suppressed autophagy in bdh2 morphants by coinjecting MOs against autophagy-related 7 (atg7). Atg7 is an E1-like ligase associated with autophagy, which is required for the formation of autophagosomes (26). Loss of atg7 decreases mitochondrial clearance in reticulocytes (26). We found that suppression of atg7 in bdh2 morphants diminished mitochondrial clearance as judged by confocal imaging of MTR-stained erythrocytes isolated from embryos at 48 hpf (Fig. 5A). Additionally, EM analysis confirmed the delay in loss of mitochondria in erythrocytes from bdh2 and atg7 morphants (Fig. 5B). There were also more mitochondria in these double morphants (Fig. 5C). We next studied hemoglobinization in bdh2 and atg7 morphants. Suppression of atg7 alone has no effect on hemoglobinization as judged by O-dianisidine staining of whole embryos or isolated erythrocytes (Fig. 5 D and E). By contrast, suppression of atg7 partially corrected the hemoglobinization defect in bdh2 morphants (Fig. 5 D and E and Fig. S6). Taken together, there is a strong correlation between loss of mitochondria and erythroid maturation and hypohemoglobinization in bdh2 morphants.
Fig. 5.
Suppression of atg7 inhibits mitophagy and rescues hemoglobinization defect in bdh2 morphants. (A) Confocal imaging of MTR-stained circulating erythrocytes from bdh2 or atg7 morphants. Erythrocytes are representative of the mean groups. (B) Representative EM images of erythrocytes isolated from bdh2 or atg7 morphants. (Scale bars: 1 μM.) (C) Total mitochondrial count per cell counted by EM. Mitochondria in autophagosomes were not included in the count. Data are mean ± SD for 50 cells. P < 0.05 was considered significant. (D) Morphological assessment of embryos injected with bdh2 or atg7 MOs. O-dianisidine (O-das) staining confirmed partial restoration of hemoglobinization in atg7-suppressed bdh2 morphants. (E–G) Analysis of circulating erythrocytes from embryos injected with bdh2 or atg7 MOs. (E) May–Grunwald/Giemsa stain (Scale bars: 5 μM.) (F) Tabulation of the N:C area ratio for erythrocytes isolated from embryos injected with bdh2 or atg7 MOs. Coinjection of atg7 MOs decreased the N:C ratio in bdh2 morphants. Data are mean ± SD for 300 cells. P < 0.05 was considered significant. (G) O-dianisidine staining confirmed partial restoration of hemoglobinization in atg7-suppressed bdh2 morphants. Erythrocytes are representative of the mean groups depicted in C. May–Grunwald/Giemsa stain. (Scale bars: 5 μM.)
Fig. S6.
O-dianisidine staining of bdh2 or atg7 morphants. Randomly selected bdh2 or atg7 morphants showing hypohemoglobinization. Suppression of atg7 restored hemoglobinization.
Bdh2 Inactivation Alters the Erythropoietic Transcriptional Program.
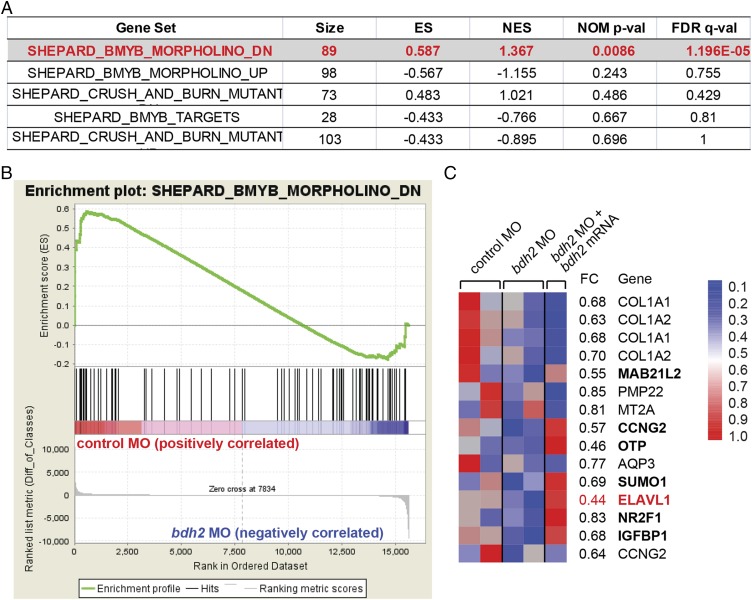
Mitochondria also play a role in the control of nuclear gene expression. The process by which mitochondria communicate with the nucleus is referred to as “mitochondrial retrograde signaling” (12). Our results thus far indicate a strong correlation between mitochondrial loss and erythrocyte immaturity in bdh2 morphants. Therefore, we hypothesized that premature loss of mitochondria adversely affects development of the erythrocyte. We therefore expect to see altered gene expression in control and bdh2 morphants. To test this idea, we performed global gene expression array analysis of isolated erythrocytes from control and bdh2 morphants at 72 hpf by using the Affymetrix GeneChip zebrafish whole transcript arrays. Reduction of bdh2 elicited rather a narrower transcriptional response in erythrocytes compared with control erythrocytes. Overall, ∼80 mRNA transcripts differed significantly in expression between control and bdh2-deficient erythrocytes (significance analysis of microarrays P < 0.05; Fig. 6).
Fig. 6.
Transcriptome analysis in erythrocytes from embryos injected with control or bdh2-specific MOs and bdh2-overexpressing bdh2 morphants. (A) Functional categories most significantly enriched in erythrocytes of bdh2 morphants. Gene sets that are statistically significant are indicated in red. “Size” indicates the number of genes. FDR, false discovery rate; NES, normalized enrichment score; p-val, P value. (B) Enrichment plot showing down-regulation of B-myb target genes in bdh2 morphants. Each vertical line represents a gene within the dataset. Leading edge of the curve indicates significantly down-regulated genes. (C) Heat-map representation of the expression of the top leading edge genes enriched in bdh2 morphants. Fold changes are indicated on the right. Elavl1a is highlighted in red. Expression of some of the down-regulated genes was restored upon reestablishment of bdh2.
We used the computational algorithm Gene Set Enrichment Analysis (GSEA) to assess whether any of several thousand predefined sets of genes representing biological pathways are differentially expressed in bdh2-deficient erythrocytes. One of the most significantly and consistently enriched gene sets in bdh2-deficient erythrocytes comprises targets of v-myb avian myeloblastosis viral oncogene homolog-like 2 (B-myb) (Fig. 6 A and B). These results are consistent with the notion that B-myb is important for erythropoiesis (27). The “leading edge” genes, the subset of the B-myb gene list that account for the enrichment, included transcription factors (Fig. 6). By contrast, the expression of the leading edge genes derived from the B-myb gene list was not increased when bdh2 was restored in bdh2 morphants (Fig. 6C). Interestingly, we found that embryonic lethal and abnormal vision (Elav) l1a, an important regulator of erythropoiesis (28), is severely repressed in bdh2 morphants, but reestablishment of bdh2 up-regulated Elavl1a expression (Fig. 6C).
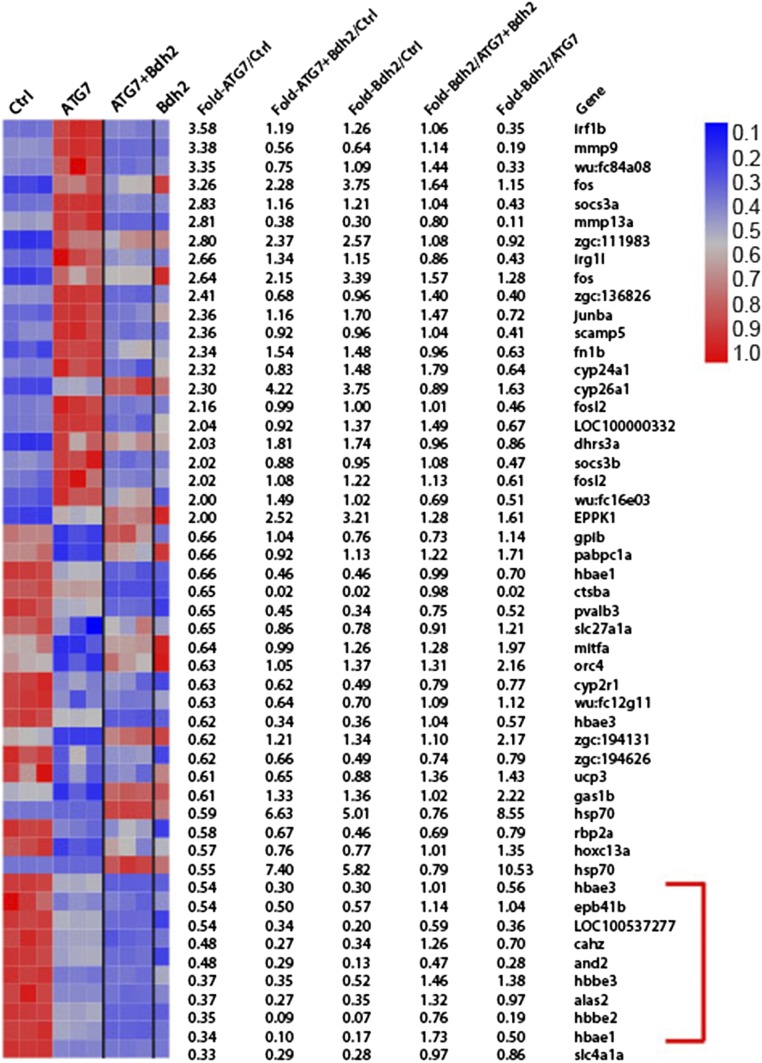
In a complimentary set of experiments, we performed additional gene array experiments to address whether observed changes in gene expression as presented in Fig. 6 are dependent on presence or absence of mitochondria. Comparison of transcriptional profiles of erythrocytes from bdh2 and atg7 double morphants with the profiles of erythrocytes from bdh2 or atg7 morphants yielded several differentially regulated genes in bdh2 morphants, atg7 morphants, and atg7 and bdh2 double morphants. Among these genes, we observed a set of genes involved in various aspects of hemoglobin biogenesis, which were down-regulated in erythrocytes from bdh2 morphants that seem to be rescued upon ablation of atg7 in bdh2 morphants (Fig. S7). Thus, these results, in part explain that preservation of mitochondria in bdh2 morphants by eliminating atg7 reverses altered gene expression.
Fig. S7.
Transcriptome analysis in erythrocytes from embryos injected with control or gene-specific MOs. Heat-map representation of the expression of significantly altered genes. Fold changes are indicated on the right. Genes involved various aspects of hemoglobin biogenesis are indicated by a red bracket.
Combined, gene expression profiling in erythrocytes isolated from bdh2- or bdh2- and atg7-inactivated embryos suggests that a transcriptional network important for erythrocyte development is differentially altered. Further studies are required to determine the significance of the altered genes.
Discussion
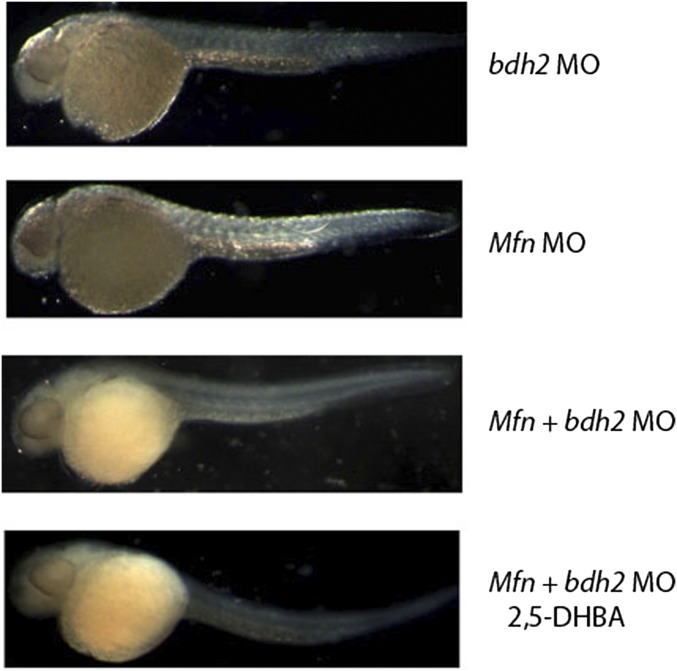
Mfn, a mitochondrial inner membrane protein, facilitates iron import into mitochondria. However, how elemental iron traverses the outer mitochondrial membrane is not known. Free iron is reactive; therefore, many cytosolic chaperones have been postulated to chelate iron and aid in its import (14, 17). We found that a cytosolic siderophore, which resembles a bacterial siderophore, facilitates mitochondrial iron import in eukaryotes (18). Additionally, the genetic machinery responsible for the biosynthesis of the siderophore is evolutionarily conserved (18). Reduction of BDH2, an enzyme critical for catalysis of 2,5-DHBA, the eukaryotic siderophore, results in heme deficiency in cultured cells, yeast, zebrafish, and mice (18, 20, 29). The relationship between mfn and the cytosolic siderophore is not known. Notably, addition of 2,5-DHBA fails to restore hemoglobinization to mfn morphants (Fig. S8), implying that 2,5-DHBA is not the ligand for Mfn. These results suggest that a yet-unidentified mitochondrial membrane protein mediates 2,5-DHBA import into the mitochondria.
Fig. S8.
O-dianisidine staining of bdh2 or mfn or bdh2 and mfn morphants supplemented with the siderophore. Injection of siderophore failed to restore hemoglobinization in mfn morphants.
We previously found that depletion of eukaryotic siderophore opposes erythrocyte maturation in the developing zebrafish embryo (18). Here we show that mitochondria, which are normally extruded during terminal differentiation of erythrocytes, play a pivotal role in early differentiation of erythrocytes. Premature loss of mitochondria decreases maturation and causes hypohemoglobinization. Iron supports mitochondrial function as well as biogenesis of ATP, heme, and iron–sulfur clusters. Mitochondrial iron deficiency results in mitochondrial dysfunction and predisposes defunct mitochondria to elimination via mitophagy. Restoration of mitochondrial iron supply reverses these defects.
Mitochondrial clearance is unique to erythrocytes in hematopoietic cell differentiation. Removal of mitochondria also marks the transition of reticulocytes to mature erythrocytes (27). Retention of mitochondria leads to excess cell death. Therefore, removal of mitochondria is beneficial to mature erythrocytes. During the early stages of differentiation, mitochondria are important for the synthesis of heme. Premature loss of mitochondria has implications for heme deficiency. We found that premature loss of mitochondria also adversely affects differentiation. As stated earlier, siderophore depletion results in mitochondrial iron deficiency and consequently contributes to mitochondrial dysfunction. These defective mitochondria trigger a cascade of events culminating in mitophagy.
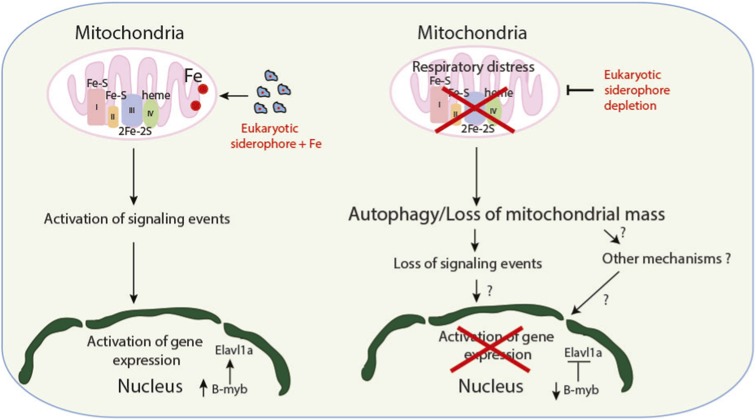
We also found that loss of mitochondria influenced a transcriptional program featuring several down-regulated genes. The majority of these genes are targets of the transcription factor, B-myb. MYB family comprises A-myb, B-myb, C-myb, and V-myb transcription factors (30). Among all these members, only B-myb and C-myb are implicated in hematopoiesis (27, 31, 32). Global genetic ablation of B-myb results in embryonic lethality; however, conditional deletion results in loss of the hematopoietic stem cell pool and consequent pancytopenia (28). Several targets of B-myb are down-regulated in bdh2-inactivated cells, including the gene encoding ELAV-like RNA-binding protein 1a (Elavl1a). Elavl1a is an RNA-binding protein and a member of the Elav family, whose members are ubiquitously expressed and are implicated in disparate biological processes (33). Elavl1 regulates gata1 expression posttranscriptionally and is very important for zebrafish erythropoiesis (28). Selective down-regulation of Elavl1a in bdh2-inactivated zebrafish erythrocytes points to a mechanism for the observed erythrocyte maturation defect in bdh2-inactivated zebrafish embryos (Fig. S9). Reestablishment of bdh2 results in restoration of Elavl1a expression and increases erythrocyte maturation. Our results also indicate that Elavl1a is a downstream regulator of B-myb. In our previous study, we showed that heme production is deficient in bdh2-inactivated cells, yeast, and zebrafish embryos (18). Thus, these results establish precedence that premature mitochondrial loss in bdh2 morphants and observed changes in gene expression. Retention of mitochondria by eliminating atg7 seems to nullify altered gene expression as a consequence of bdh2 inactivation. The determination of the significance of these differentially regulated genes opens new vistas for future studies.
Fig. S9.
Proposed model.
Mitochondrial retrograde signaling allows communication between mitochondria and the nucleus (13), and our results suggest a link between retrograde signaling and erythrocyte development. In this regard, ROS is a known mediator of retrograde signaling, and we have previously shown that RNAi-mediated knockdown of Bdh2 in mammalian cells leads to increased ROS (18). Although we have not directly demonstrated increased ROS levels in bdh2 morphants, based on our results in mammalian cells (18), this possibility seems likely. It is also possible that heme deficiency promotes accelerated clearance of mitochondria, which contributes to delayed erythrocyte development. Elucidating the detailed mechanism by which mitochondria-dependent signaling regulates nuclear gene expression will be the subject of our future studies.
Materials and Methods
Zebrafish Stock Care and Maintenance of Embryo Cultures.
WT D. rerio (zebrafish) were bred and raised following the procedures approved by the Case Western Reserve University Institutional Animal Care and Use Committee. The embryos were collected from natural spawnings, cultured, and staged as described in ref. 18.
Embryonic Blood Collection and Morphometry.
Embryonic zebrafish erythrocytes at indicated times after fertilization were collected by transecting tails (schema in Fig. 1D) of 10–12 embryos in 500 μL of HBSS and placed in DMEM supplemented with 4% (vol/vol) FBS until further use. Cytospin slides were prepared and stained with May–Grunwald/Giemsa stain and Heinz body staining as previously described (18). Nuclear and cytoplasmic areas of 50–60 randomly selected erythrocytes were measured by using AxioVision AC software, and the N:C area ratio was calculated. Embryonic erythrocytes were also stained with hemoglobin specific O-dianisidine staining as described previously (18).
Measurement of Oxygen Consumption in Isolated Erythrocytes.
Isolated erythrocytes were collected into DMEM containing 1% FBS and stored at room temperature. Oxygen consumption was measured with an Oxygraph-2K system (Oroboros) as described previously (34). A 2-mL cell suspension was added to the Oxygraph-2K chamber, and basal oxygen consumption as well as oxygen consumption after addition of indicated substrates or inhibitors was measured. Final concentrations of substrates and inhibitors were as described previously (34).
Statistical Analysis.
Single images are representative of at least 50 embryos or the indicated number of embryos. Quantitative data were obtained from at least three independent experiments. Descriptive statistics are means ± SD of data. SAS software was used for statistical analyses. A P value less than 0.05 was considered significant.
SI Materials and Methods
Microinjections.
Fertilized one- or two-cell embryos were microinjected with MOs (1–2 nL of 130 μmol/L in water; Gene Tools) at previously established concentrations (18). Fertilized one- or two-cell embryos were microinjected with MOs (1–2 nL of 130 μmol/L in water; Gene Tools). Rescue experiments were performed by coinjecting 1–2 nL of a synthetic capped mRNA (50 μg/mL in H2O) synthesized from a full-length mouse bdh2 cDNA cloned into pCS2+MT vector as described previously (18). Microinjections were traced where appropriate by mixing at a 1:1 ratio with phenol red (Sigma). We delivered different nucleic acid reagents by separate microinjections to avoid ex vivo mixing. Rescue experiments were also performed by injecting 2,5-DHBA, benzoic acid, or DFO, at 1–10 fM per embryo into bdh2 morphants. All chemicals were solubilized in water, filter-sterilized, and stored at room temperature or −80 °C.
EM.
Circulating blood cells were isolated in medium, washed once with PBS solution, and fixed with PBS solution containing glutaraldehyde and paraformaldehyde overnight at 4 °C, followed by osmium tetroxide. Cells were dehydrated in ethanol and embedded in Epon 812 and sections were analyzed using a JEOL 1200 Ex electron microscope.
TUNEL Assay.
Evidence of cell death was demonstrated by fluorescent in situ TUNEL. The TUNEL method was used to detect nuclear DNA fragmentation in control or bdh2 morphants. The in situ cell detection kit, Fluorescein (Green or Red; Roche), was used as specified by the manufacturer. Whole embryos were stained with in situ cell detection kit Green. Isolated erythrocytes were cytospun onto glass slides and fixed with freshly prepared 2% paraformaldehyde (Sigma) solution in PBS solution at room temperature for 1 h. Slides were rinsed twice with PBS solution and incubated in fresh permeabilization solution (0.1% Triton X-100 in 0.1% sodium citrate) for 2 min on ice. Slides were rinsed twice with PBS solution to remove Triton X-100. TUNEL reaction mixture was obtained by mixing terminal deoxynucleotidyltransferase with nucleotide mixture per the manufacturer’s instructions. Slides were incubated with 50 μL of TUNEL reaction mixture in a humidified chamber at 37 °C for 1 h in the dark. After rinsing with PBS solution, slides were counterstained with 0.1 μg/mL of DAPI and mounted for microscopy. TUNEL- and DAPI-positive cells were viewed by using a fluorescent microscope.
Imaging.
Low-power images were collected by using a Nikon SMZ1500 or Leica MZFLIII fluorescence stereomicroscope equipped with a SPOT RT slider color digital camera. High-power images were collected with a Leica DMIRB microscope with a SPOT RT slider color digital camera. Images were imported into Adobe Illustrator CS5 for orientation and figure preparation. Circulating erythrocytes were collected and stained with MTR or costained with MTR and LysoTracker green and examined with a Zeiss LSM 510 META microscope.
Flow Cytometry.
Circulating blood cells were isolated and stained with 200 nM MTR (Invitrogen) or MTG (Invitrogen) in HBSS containing 1% FBS and 0.5% glucose at 30 min at room temperature followed by two washes with HBSS containing 1% FBS. MTR or MTG fluorescence was collected by using a BD LSR II flow cytometry analyzer (BD Biosciences).
Immunofluorescence.
Erythrocytes from WT embryos or embryos injected with control or bdh2 MOs were isolated and stained with anti-OXPHOS complex IV subunit 1 monoclonal antibody (Invitrogen), and fluorescence was detected with an appropriate secondary antibody coupled to FITC (Jackson Immuno Research Labs). Erythrocytes from control or bdh2 morphants were also stained with anti-Ter119 or anti-TfR1 antibodies (eBioscience).
RNA Extraction and Microarray Analyses.
RNA from control or bdh2 morphants was isolated by using the RNeasy Mini kit (Qiagen). Expression levels of indicated genes was assayed by semiquantitative RT-PCR and normalized to actin. For microarray analysis, 100 ng of RNA was amplified and biotin-labeled by using the Ovation Biotin system (Nugen) following the manufacturer’s recommendations. The labeled probes were then hybridized to Affymetrix zebrafish GeneChip genome arrays.
Transcriptome Analysis.
Total RNA from erythrocytes isolated from embryos injected with control or indicated gene-specific MOs was used to identify differentially regulated genes. Contaminating chromosomal DNA was removed by DNase (Qiagen) treatment. Purified total RNA was used to prepare fragmented and biotin-dUTP–labeled cRNA according to Affymetrix target preparation protocols available online (www.affymetrix.com/support/technical/manuals.affx). First, cDNA was synthesized from ∼10 μg of total RNA in first-strand buffer containing 25 ng/mL engineered random primers containing T7 sequence (Ambion), 10 mM DTT, 0.5 mM dNTPs (Invitrogen), and 200 U/μL SuperScript III RT (Invitrogen). The resulting first-strand cDNA was converted to ds cDNA in a second-strand cDNA synthesis reaction. Ten microliters of first-strand reaction was incubated with Escherichia coli DNA polymerase (10 U/μL), E. coli RNaseH (2 U/μL), and 10 mM dNTPs in second-strand buffer (Invitrogen). Labeled antisense cRNA was synthesized from dsDNA by using T7 RNA polymerase (Ambion) with biotin-dUTP (Sigma). The biotinylated cRNA was fragmented and subjected to microarray analysis by using Affymetrix zebrafish GeneChip genome arrays containing ∼15,617 transcripts. Hybridization, washing, and scanning of gene chips was performed at Case Comprehensive Cancer Center Microarray core facility (gegf.net). Specific protocols for Affymetrix hybridization and scanning protocols are available at www.affymetrix.com/support/technical/manuals.affx.
Each experiment was repeated in triplicate. The .CEL files were used as starting points for all analyses. The data were analyzed by using Affymetrix expression console. The Robust Multi-array Average method was used to obtain normalized expression estimates. Differences between samples groups are expressed as log2-ratio. The statistical significance of differential gene expression between control and bdh2 morphants was calculated by Student’s t test. The leading edge subset of genes was determined by the Gene Set Enrichment Analysis criteria “core enrichment” per the guidelines available at (software.broadinstitute.org/gsea/index.jsp).
Acknowledgments
We thank Fang Ye and Charles Hoppel for help with oxymetry; Alan Tartakoff and Robert B. Petersen for editorial assistance; Hisashi Fujioka for EM analysis; and Mike Sramkowski for flow cytometry. This work was supported by National Institutes of Health Grants K01CA113838 and R01DK081395 (to L.D.) and American Cancer Society Grant RSG1328901TBE (to L.D.). L.D and D.W. are supported by Case Western Reserve University startup funds. L.D. is a recipient of career developmental awards from March of Dimes and American Society of Hematology.
Footnotes
The authors declare no conflict of interest.
This article contains supporting information online at www.pnas.org/lookup/suppl/doi:10.1073/pnas.1600077113/-/DCSupplemental.
References
- 1.Carradice D, Lieschke GJ. Zebrafish in hematology: Sushi or science? Blood. 2008;111(7):3331–3342. doi: 10.1182/blood-2007-10-052761. [DOI] [PMC free article] [PubMed] [Google Scholar]
- 2.Paik EJ, Zon LI. Hematopoietic development in the zebrafish. Int J Dev Biol. 2010;54(6-7):1127–1137. doi: 10.1387/ijdb.093042ep. [DOI] [PubMed] [Google Scholar]
- 3.Sood R, Liu P. Novel insights into the genetic controls of primitive and definitive hematopoiesis from zebrafish models. Adv Hematol. 2012;2012:830703. doi: 10.1155/2012/830703. [DOI] [PMC free article] [PubMed] [Google Scholar]
- 4.Davidson AJ, Zon LI. The ‘definitive’ (and ‘primitive’) guide to zebrafish hematopoiesis. Oncogene. 2004;23(43):7233–7246. doi: 10.1038/sj.onc.1207943. [DOI] [PubMed] [Google Scholar]
- 5.Huang H-T, Zon LI. Regulation of stem cells in the zebra fish hematopoietic system. Cold Spring Harb Symp Quant Biol. 2008;73:111–118. doi: 10.1101/sqb.2008.73.029. [DOI] [PubMed] [Google Scholar]
- 6.Hattangadi SM, Wong P, Zhang L, Flygare J, Lodish HF. From stem cell to red cell: Regulation of erythropoiesis at multiple levels by multiple proteins, RNAs, and chromatin modifications. Blood. 2011;118(24):6258–6268. doi: 10.1182/blood-2011-07-356006. [DOI] [PMC free article] [PubMed] [Google Scholar]
- 7.Hu J, et al. Isolation and functional characterization of human erythroblasts at distinct stages: Implications for understanding of normal and disordered erythropoiesis in vivo. Blood. 2013;121(16):3246–3253. doi: 10.1182/blood-2013-01-476390. [DOI] [PMC free article] [PubMed] [Google Scholar]
- 8.Koury MJ, Koury ST, Kopsombut P, Bondurant MC. In vitro maturation of nascent reticulocytes to erythrocytes. Blood. 2005;105(5):2168–2174. doi: 10.1182/blood-2004-02-0616. [DOI] [PubMed] [Google Scholar]
- 9.Kim I, Rodriguez-Enriquez S, Lemasters JJ. Selective degradation of mitochondria by mitophagy. Arch Biochem Biophys. 2007;462(2):245–253. doi: 10.1016/j.abb.2007.03.034. [DOI] [PMC free article] [PubMed] [Google Scholar]
- 10.Betin VMS, Singleton BK, Parsons SF, Anstee DJ, Lane JD. Autophagy facilitates organelle clearance during differentiation of human erythroblasts: Evidence for a role for ATG4 paralogs during autophagosome maturation. Autophagy. 2013;9(6):881–893. doi: 10.4161/auto.24172. [DOI] [PMC free article] [PubMed] [Google Scholar]
- 11.Wallace DC, Fan W, Procaccio V. Mitochondrial energetics and therapeutics. Annu Rev Pathol. 2010;5:297–348. doi: 10.1146/annurev.pathol.4.110807.092314. [DOI] [PMC free article] [PubMed] [Google Scholar]
- 12.Liu Z, Butow RA. Mitochondrial retrograde signaling. Annu Rev Genet. 2006;40:159–185. doi: 10.1146/annurev.genet.40.110405.090613. [DOI] [PubMed] [Google Scholar]
- 13.Whelan SP, Zuckerbraun BS. Mitochondrial signaling: Forwards, backwards, and in between. Oxid Med Cell Longev. 2013;2013:351613. doi: 10.1155/2013/351613. [DOI] [PMC free article] [PubMed] [Google Scholar]
- 14.Pantopoulos K, Porwal SK, Tartakoff A, Devireddy L. Mechanisms of mammalian iron homeostasis. Biochemistry. 2012;51(29):5705–5724. doi: 10.1021/bi300752r. [DOI] [PMC free article] [PubMed] [Google Scholar]
- 15.Wang J, Pantopoulos K. Regulation of cellular iron metabolism. Biochem J. 2011;434(3):365–381. doi: 10.1042/BJ20101825. [DOI] [PMC free article] [PubMed] [Google Scholar]
- 16.Kakhlon O, Cabantchik ZI. The labile iron pool: Characterization, measurement, and participation in cellular processes(1) Free Radic Biol Med. 2002;33(8):1037–1046. doi: 10.1016/s0891-5849(02)01006-7. [DOI] [PubMed] [Google Scholar]
- 17.Fernandez-Pol JA. Isolation and characterization of a siderophore-like growth factor from mutants of SV40-transformed cells adapted to picolinic acid. Cell. 1978;14(3):489–499. doi: 10.1016/0092-8674(78)90235-0. [DOI] [PubMed] [Google Scholar]
- 18.Devireddy LR, Hart DO, Goetz DH, Green MR. A mammalian siderophore synthesized by an enzyme with a bacterial homolog involved in enterobactin production. Cell. 2010;141(6):1006–1017. doi: 10.1016/j.cell.2010.04.040. [DOI] [PMC free article] [PubMed] [Google Scholar]
- 19.Richardson DR, et al. Mitochondrial iron trafficking and the integration of iron metabolism between the mitochondrion and cytosol. Proc Natl Acad Sci USA. 2010;107(24):10775–10782. doi: 10.1073/pnas.0912925107. [DOI] [PMC free article] [PubMed] [Google Scholar]
- 20.Liu Z, Ciocea A, Devireddy L. Endogenous siderophore 2,5-dihydroxybenzoic acid deficiency promotes anemia and splenic iron overload in mice. Mol Cell Biol. 2014;34(13):2533–2546. doi: 10.1128/MCB.00231-14. [DOI] [PMC free article] [PubMed] [Google Scholar]
- 21.Qian F, et al. Distinct functions for different scl isoforms in zebrafish primitive and definitive hematopoiesis. PLoS Biol. 2007;5(5):e132. doi: 10.1371/journal.pbio.0050132. [DOI] [PMC free article] [PubMed] [Google Scholar]
- 22.Pase L, et al. miR-451 regulates zebrafisherythroid maturation in vivo via its target gata2. Blood. 2009;113(8):1794–1804. doi: 10.1182/blood-2008-05-155812. [DOI] [PMC free article] [PubMed] [Google Scholar]
- 23.Pan BT, Johnstone RM. Fate of the transferrin receptor during maturation of sheep reticulocytes in vitro: Selective externalization of the receptor. Cell. 1983;33(3):967–978. doi: 10.1016/0092-8674(83)90040-5. [DOI] [PubMed] [Google Scholar]
- 24.Kina T, et al. The monoclonal antibody TER-119 recognizes a molecule associated with glycophorin A and specifically marks the late stages of murine erythroid lineage. Br J Haematol. 2000;109(2):280–287. doi: 10.1046/j.1365-2141.2000.02037.x. [DOI] [PubMed] [Google Scholar]
- 25.Youle RJ, Narendra DP. Mechanisms of mitophagy. Nat Rev Mol Cell Biol. 2011;12(1):9–14. doi: 10.1038/nrm3028. [DOI] [PMC free article] [PubMed] [Google Scholar]
- 26.Zhang J, et al. Mitochondrial clearance is regulated by Atg7-dependent and -independent mechanisms during reticulocyte maturation. Blood. 2009;114(1):157–164. doi: 10.1182/blood-2008-04-151639. [DOI] [PMC free article] [PubMed] [Google Scholar]
- 27.Baker SJ, et al. B-myb is an essential regulator of hematopoietic stem cell and myeloid progenitor cell development. Proc Natl Acad Sci USA. 2014;111(8):3122–3127. doi: 10.1073/pnas.1315464111. [DOI] [PMC free article] [PubMed] [Google Scholar]
- 28.Li X, et al. Elavl1a regulates zebrafish erythropoiesis via posttranscriptional control of gata1. Blood. 2014;123(9):1384–1392. doi: 10.1182/blood-2013-09-526962. [DOI] [PMC free article] [PubMed] [Google Scholar]
- 29.Liu Z, et al. Regulation of mammalian siderophore 2,5-DHBA in the innate immune response to infection. J Exp Med. 2014;211(6):1197–1213. doi: 10.1084/jem.20132629. [DOI] [PMC free article] [PubMed] [Google Scholar]
- 30.Oh I-H, Reddy EP. The myb gene family in cell growth, differentiation and apoptosis. Oncogene. 1999;18(19):3017–3033. doi: 10.1038/sj.onc.1202839. [DOI] [PubMed] [Google Scholar]
- 31.Mucenski ML, et al. A functional c-myb gene is required for normal murine fetal hepatic hematopoiesis. Cell. 1991;65(4):677–689. doi: 10.1016/0092-8674(91)90099-k. [DOI] [PubMed] [Google Scholar]
- 32.Vegiopoulos A, García P, Emambokus N, Frampton J. Coordination of erythropoiesis by the transcription factor c-Myb. Blood. 2006;107(12):4703–4710. doi: 10.1182/blood-2005-07-2968. [DOI] [PMC free article] [PubMed] [Google Scholar]
- 33.Brennan CM, Steitz JA. HuR and mRNA stability. Cell Mol Life Sci. 2001;58(2):266–277. doi: 10.1007/PL00000854. [DOI] [PMC free article] [PubMed] [Google Scholar]
- 34.Ye F, Hoppel CL. Measuring oxidative phosphorylation in human skin fibroblasts. Anal Biochem. 2013;437(1):52–58. doi: 10.1016/j.ab.2013.02.010. [DOI] [PubMed] [Google Scholar]


