Significance
Development of predictive models of antibiotic resistance is challenging due to a lack of understanding of the relationship between molecular and fitness effects of mutations (the genotype–phenotype gap). Here we close the genotype–phenotype gap for an essential enzyme, dihydrofolate reductase (DHFR), which is an important target of the common antibiotic trimethoprim. We show that IC50 of trimethoprim resistance of Escherichia coli can be predicted, with high accuracy, from a unique combination of molecular properties of stepwise-resistant DHFR variants. These results show that the challenge to predict de novo evolutionary dynamics of antibiotic resistance lies in the need for accurate prediction of the effects of mutations on the molecular properties of target enzymes.
Keywords: fitness landscapes, DHFR, drug resistance, protein stability, molten globule
Abstract
Fitness landscapes of drug resistance constitute powerful tools to elucidate mutational pathways of antibiotic escape. Here, we developed a predictive biophysics-based fitness landscape of trimethoprim (TMP) resistance for Escherichia coli dihydrofolate reductase (DHFR). We investigated the activity, binding, folding stability, and intracellular abundance for a complete set of combinatorial DHFR mutants made out of three key resistance mutations and extended this analysis to DHFR originated from Chlamydia muridarum and Listeria grayi. We found that the acquisition of TMP resistance via decreased drug affinity is limited by a trade-off in catalytic efficiency. Protein stability is concurrently affected by the resistant mutants, which precludes a precise description of fitness from a single molecular trait. Application of the kinetic flux theory provided an accurate model to predict resistance phenotypes (IC50) quantitatively from a unique combination of the in vitro protein molecular properties. Further, we found that a controlled modulation of the GroEL/ES chaperonins and Lon protease levels affects the intracellular steady-state concentration of DHFR in a mutation-specific manner, whereas IC50 is changed proportionally, as indeed predicted by the model. This unveils a molecular rationale for the pleiotropic role of the protein quality control machinery on the evolution of antibiotic resistance, which, as we illustrate here, may drastically confound the evolutionary outcome. These results provide a comprehensive quantitative genotype–phenotype map for the essential enzyme that serves as an important target of antibiotic and anticancer therapies.
Predictive models of antibiotic resistance are key to developing novel antibacterial treatments (1–6). Besides its practical importance, antibiotic escape presents a tractable general model of adaptive evolutionary dynamics that can provide insights into fundamental questions in evolution, such as the reproducibility and predictability of evolutionary trajectories (4, 7, 8) as well as the importance of epistasis and pleiotropy (5, 7, 9, 10).
Experimental evolution studies of evolution of antibiotic resistance showed that in many cases resistance-conferring mutations arose both in target and off-pathway genes (5, 11). However, mutations conferring resistance against trimethoprim (TMP) were largely limited to the target gene, namely the ORF and upstream region of folA, the gene encoding dihydrofolate reductase (DHFR) (1, 5, 11). DHFR is an essential core metabolic enzyme that converts dihydrofolate to tetrahydrofolate—a main source of carbon atoms in several key pathways. The rare occurrence of off-target adaptive mutations makes DHFR an attractive model to study the fitness landscape of antibiotic resistance. In a recent study (2) strains carrying various combinations of TMP resistance-conferring mutations in folA were incorporated onto the Escherichia coli chromosome (12, 13) and their fitness (growth rate) was determined, providing the fitness landscape for the chosen set of variants. The analysis in ref. 2 demonstrated the complexity of the fitness landscape of TMP resistance featuring strong epistasis, although the underlying molecular mechanisms giving rise to the epistatic interactions between DHFR mutations remained unknown. Further, the genotype–phenotype link was determined only for a selected set of genetic variants and only under conditions (temperature and concentration of antibiotic) at which fitness was determined. It is an ongoing challenge to predict fitness landscape for a broad set of conditions and genetic variations that might arise in the process of evolutionary dynamics of adaptation in vivo and in the laboratory. To that end we need to close the genotype–phenotype gap for the target protein by establishing the fundamental physical–chemical link between the molecular effects of mutations and their fitness effects.
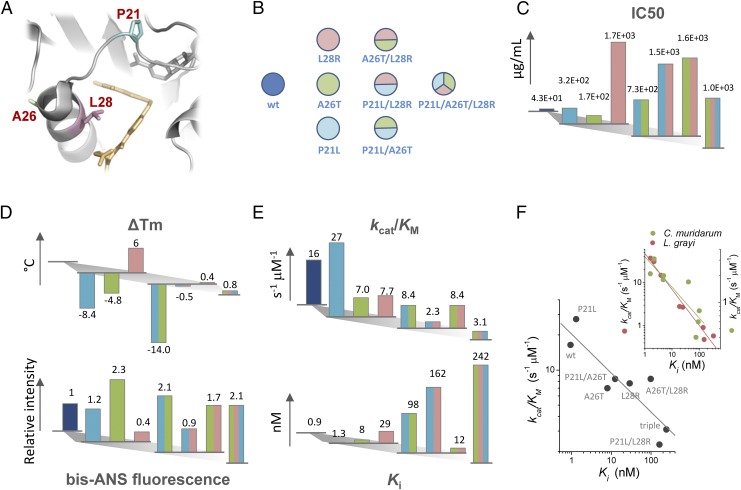
Here we address these challenges using DHFR as a model system. Among mutations identified in the evolutionary experiment under sustained selection toward TMP resistance (1), P21L, A26T, L28R, and their combinations constitute an interesting set that recurrently appeared in two out of five independent evolution experiments, and their order of fixation in both cases was similar. These mutated residues cluster within a short region of eight residues in the DHFR protein that comprises a flexible Met-20 loop (residues 9–24) and an α-helix (residues 25–35) that establishes contacts with bound dihydrofolate substrate (Fig. 1A).
Fig. 1.
DHFR mutations associated with TMP resistance and mapping of phenotypic and molecular effects in a combinatorially complete set of mutations. (A) Resistance-conferring mutations in DHFR are found close to binding pocket of dihydrofolate (in yellow). (B) Color-code scheme of all possible combination made out of the three mutations studied in this work. (C) IC50 values determined for E. coli transformed with pFLAG plasmid harboring different DHFR mutants. (D) Stability data measured for different DHFR mutants. (Top) ΔTm values were determined from thermal denaturation experiments monitored by the change in tryptophan fluorescence upon unfolding. (Bottom) bis-ANS fluorescence upon binding to different DHFR mutants measured after incubation at 37 °C for 5 min. (E) Catalytic parameters determined for all DHFR mutants. (Top) Catalytic efficiency measured at 25 °C from full progress reaction curves. (Bottom) TMP inhibition constants (Ki) determined at 25 °C. (F) Catalytic efficiency trades-off with increase in Ki. (Inset) A similar trade-off observed for orthologous DHFR mutants from L. grayi and C. muridarum.
We purified all possible combinations of these three key DHFR mutations that confer TMP resistance (depicted in Fig. 1B) and determined their biophysical properties (activity, stability, and binding affinity to TMP). We transformed E. coli with pFLAG plasmids expressing WT and mutant E. coli DHFR gene constructs and measured the intracellular DHFR abundance and determined fitness (growth rates) of each transformed variant in a broad range of concentrations of TMP. We also extended the mutational analysis to DHFR originated in Chlamydia muridarum and Listeria grayi by creating the corresponding set of mutations in the matching positions of the orthologous sequences.
We found that TMP resistance mutations affect multiple molecular properties of DHFR so that no single molecular trait is predictive of fitness. However, flux dynamics theory (14, 15) predicts, and experiments demonstrate, that fitness and IC50 for TMP can be accurately predicted when the combined effect of mutations that simultaneously change the abundance, activity, and TMP binding affinity of mutant DHFR are taken into account. Further, using the earlier established relationship (13) between DHFR abundance (cellular property) and population of the molten globule state (molecular property of DHFR), we show that the fitness landscape of DHFR mutations can be derived from the molecular properties of DHFR alone. This multiscale analysis provides an example of a predictive quantitative biophysical fitness landscape for an essential enzyme.
Results
Fitness Landscape of TMP Resistance.
Growth measurements were done in the absence of inducer (isopropyl β-d-1-thiogalactopyranoside, IPTG) because leaky expression from plasmid was sufficient to confer high levels of TMP resistance (∼100-fold over nontransformed cells), and yet the resistance was relatively modest, so inhibition of growth could be observed. To quantify growth at each TMP concentration we integrated the area under the growth curve (optical density vs. time) as described in ref. 2 and for each variant determined the level of TMP resistance by measuring IC50 (SI Methods). Expectedly, all mutations confer increased resistance to TMP over WT DHFR (Fig. 1C and Dataset S1), consistent with earlier results where the same mutations were introduced into the E. coli chromosome (2). Among single mutants, the L28R variant exhibits by far the highest resistance. Introduction of another mutation on the L28R background, either P21L or A26T, does not change IC50 significantly. On the contrary, the resistance of the double mutant P21L/A26T is best interpreted as arising from an additive effect of the combined contributions of each mutation. Although the triple mutant P21L/A26T/L28R emerged in laboratory evolution as the winning allele at highest concentration of TMP (1), it is the most drug-sensitive among all L28R-containing variants.
To provide a mechanistic insight into the phenotypic differences between different DHFR variants, all protein variants were purified to homogeneity and characterized in vitro for their stability and catalytic properties.
Stability of DHFR Mutants.
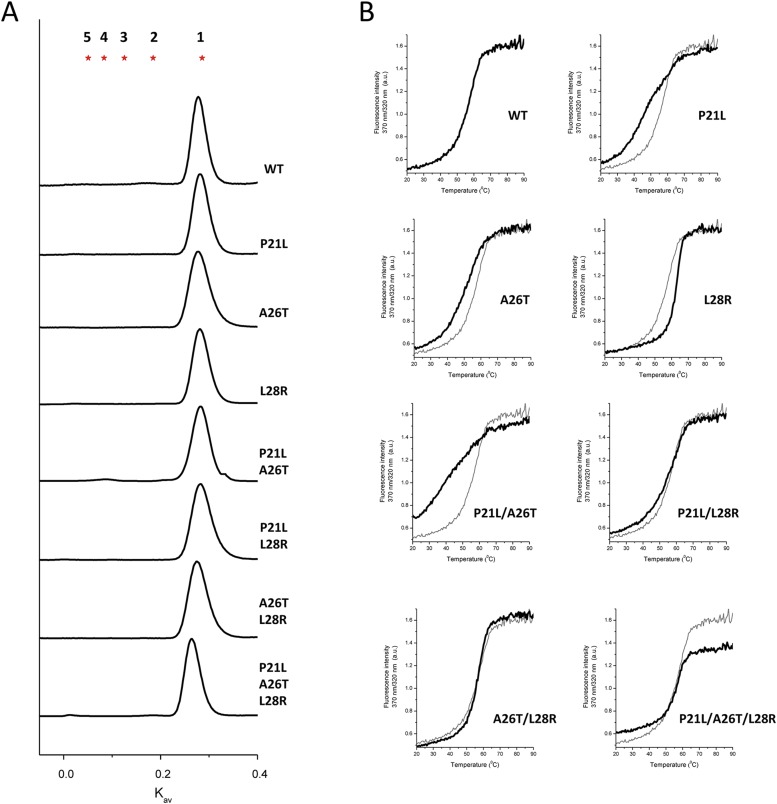
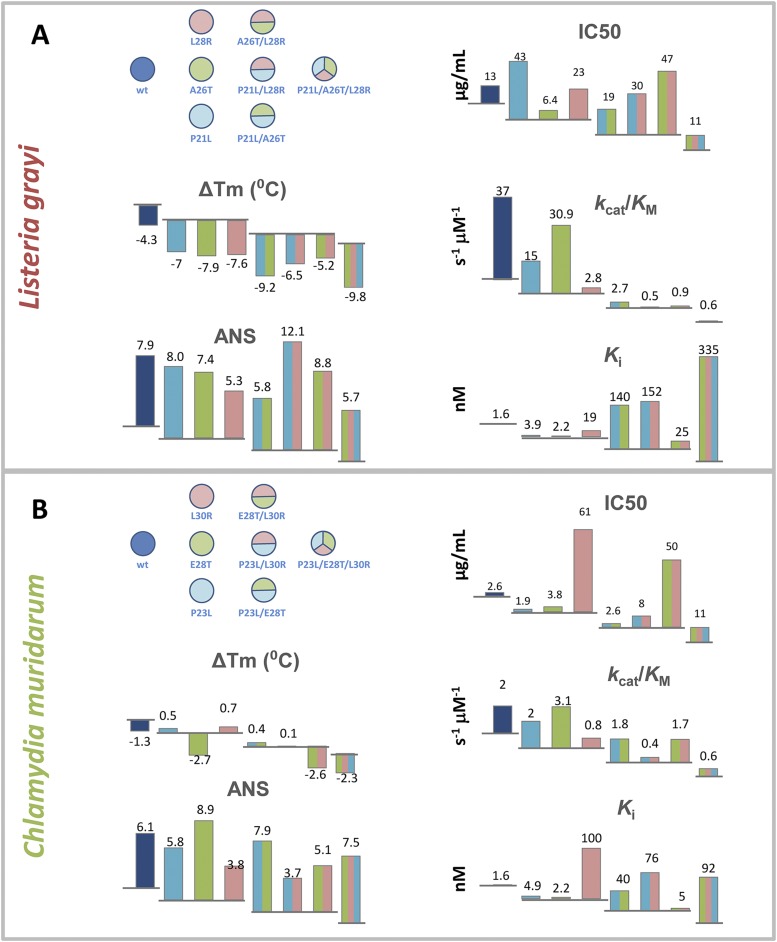
All purified DHFR mutants were determined to be monomers by size-exclusion chromatography, with no evidence for a significant amount of higher oligomeric states (Fig. S1). Thermal denaturation experiments, which allow assessing differences in protein stability, were performed for each protein variant (Fig. S1 and Methods). Mutational changes in protein folding stability characterized by the difference in the midpoint denaturation transition temperature with respect to WT (ΔTm) are shown in Fig. 1D, Top. It is clear that P21L and A26T mutations are destabilizing, in contrast to the stabilizing mutation L28R, which shows an increase in Tm of 6 °C above WT DHFR. The significant lower stability observed for the double mutant P21L/A26T (−14 °C) is probably the result of the additive contribution of each destabilizing mutation. Interestingly, the L28R mutation cancels out the destabilization brought by P21L and A26T, restoring the Tm of the double and triple mutants to WT values. In addition to thermal stability, the propensity of DHFR mutants to form molten-globule intermediates was measured using the fluorescent dye bis-ANS as a reporter (13, 16) (Fig. 1D, Bottom). Increased fluorescence indicates an increased exposure of protein hydrophobic patches to which the dye binds, which correlates with molten-globule content (17). High bis-ANS fluorescence at 37 °C is observed in all DHFR variants that have the A26T mutation, suggesting a particular effect of this mutation on the increase of the subpopulation of molten-globule–like conformations. As with thermal stability, the single L28R mutant also shows improved compactness, inferred from its low bis-ANS binding properties; however, in double and triple mutants, L28R does not compensate the deleterious effects caused by A26T.
Fig. S1.
(A) Chromatogram of E. coli DHFR mutants separated on a size-exclusion chromatography column. Red starts indicate expected partition coefficient (Kav) of multiples of DHFR theoretical molecular mass (18 kDa). (B) Thermal denaturation of E. coli DHFR mutants followed by intrinsic tryptophan fluorescence. The WT denaturation curve is represented in gray for comparison.
Escaping Drug Inhibition Involves Catalytic Efficiency Trade-Off.
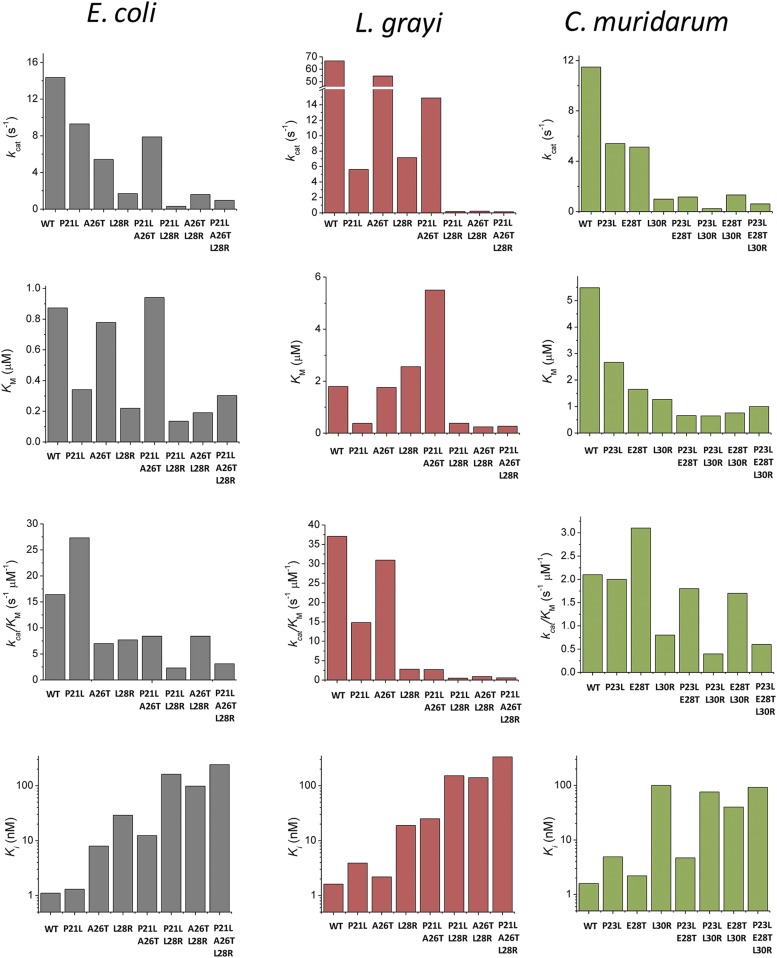
Owing to the proximity of all three mutated residues to the active site, it is expected that mutations will significantly affect the catalytic activity of the protein. The catalytic activity (kcat/Km) was determined from the analysis of full-progress reaction curves, as described previously (18); kcat/Km has the physical meaning of a second-order rate constant for the reaction between DHFR and dihydrofolate (under nonsaturating concentrations of dihydrofolate and saturating concentration of the cofactor NADPH). Fig. 1E, Top shows a progressive decrease in kcat/Km as more mutations are successively added to the protein. This drop in efficiency is caused mainly by the drop in the reaction turnover (kcat), because Km for dihydrofolate also decreases (Fig. S2). To investigate whether binding of TMP to the active site of DHFR is affected by mutations, we measured the kinetic inhibition constant (Ki) for each variant. This parameter was determined by measuring the drop in DHFR catalytic activity at increasing concentrations of TMP, using fixed dihydrofolate concentrations (see details in SI Methods). In contrast to what was observed for catalytic efficiency, there is a dramatic increase in Ki as mutations accumulate, reaching a maximum at the triple mutant. In fact, there is a noticeable anticorrelation between catalytic efficiency and Ki, indicating a clear trade-off between catalytic efficiency and increased drug resistance (Fig. 1F).
Fig. S2.
Comparison of the catalytic parameters determined for DHFR mutants from E. coli, L. grayi, and C. muridarum.
Fitness Landscapes of Orthologous Transformations.
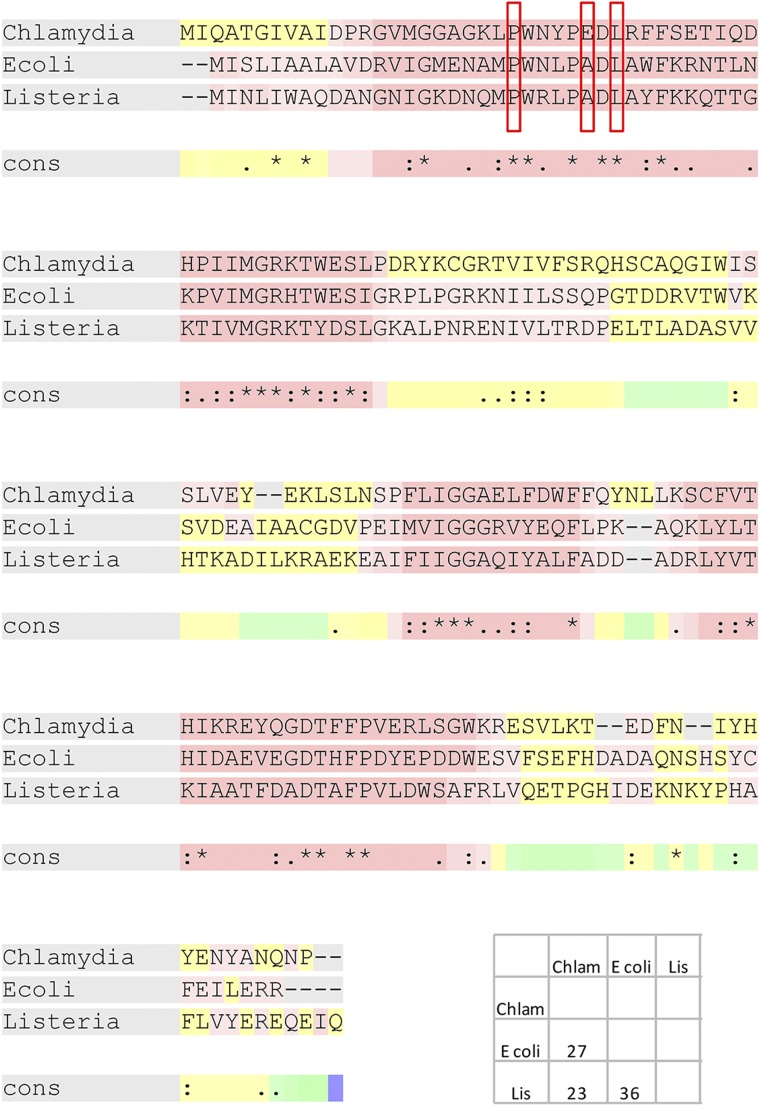
To get a broader view of the biophysical nature of the fitness landscape of antibiotic resistance we also transformed E. coli with pFLAG plasmids expressing DHFR proteins from two mesophilic bacteria, C. muridarum and L. grayi, sharing 26% and 36% sequence identity with E. coli DHFR, respectively, and carrying all combinations of the three key mutations in the loci corresponding to the three escape mutations in E. coli DHFR that we study here (see sequence alignment in Fig. S3). Similarly to E. coli DHFR, we purified all variants of the mutant orthologs from C. muridarum and L. grayi, characterized their biophysical properties, and compared them with E. coli DHFR mutants (Figs. S2 and S4). We observed a similar trade-off between catalytic activity and TMP binding (Fig. 1F, Inset). The following quantitative analysis of the biophysical fitness landscape includes all strains, that is, transformed with E. coli variants and variants of orthologous DHFR from C. muridarum and L. grayi. Using DHFRs from two additional sources allowed us to significantly extend the dynamic range of biophysical parameters to provide a comprehensive biophysical mapping of the fitness landscape.
Fig. S3.
Sequence alignment of DHFR from E. coli, L. grayi, and C. muridarum. Sequence identity (percent) matrix is shown.
Fig. S4.
Effect of mutations associated with TMP resistance in E. coli on kinetic and biophysical properties of DHFRs from (A) C. muridarum and (B) L. grayi.
Intracellular Protein Abundances Are Inversely Correlated with bis-ANS Binding.
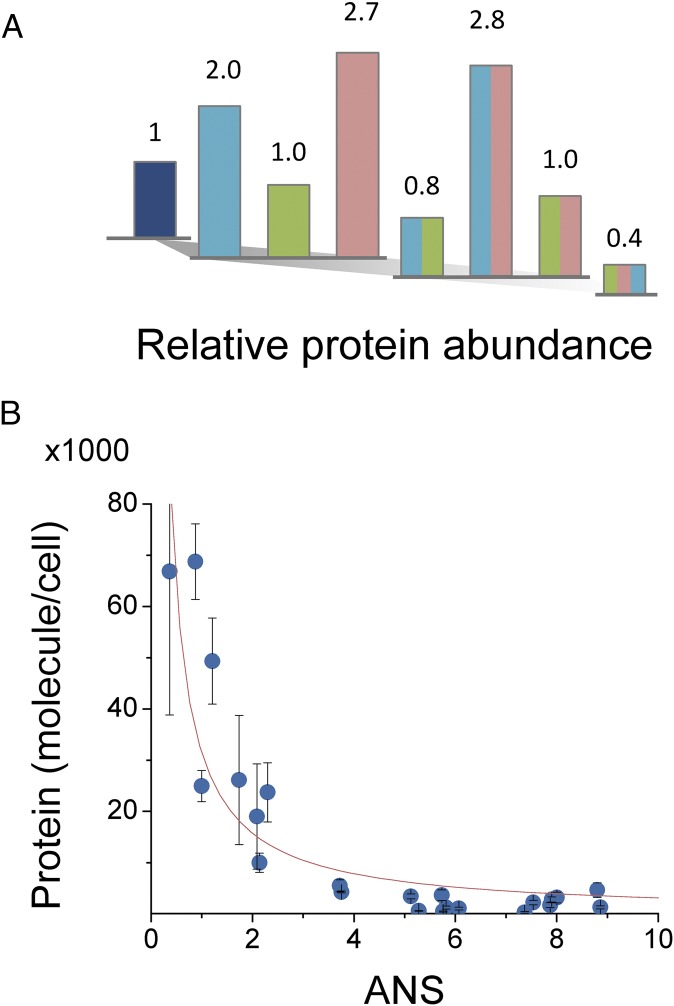
The effect of mutations on the total amount of intracellular functional protein (13) can have a significant impact on its evolutionary fate; the benefit of a mutation in conferring high drug resistance to a protein can be completely negated if such a mutation dramatically decreases protein abundance in the cell. Therefore, we developed a fluorescence-based method to quantify intracellular DHFR levels by measuring the total enzymatic activity in cell lysates (see details in SI Methods). This assay detects only the fraction of protein that is functional and therefore is biologically more relevant than standard approaches based on Western blotting. This approach was used to determine the concentration of chromosomally expressed DHFR from the parent MG1655 strain, which yielded ∼90 copies per cell in accord with the earlier estimate (19), whereas the noninduced overexpression from pFLAG plasmid produced 300-fold greater number of copies of protein (∼24,000 molecules per cell for WT DHFR). Fig. 2A shows the intracellular abundances of E. coli DHFR variants expressed from the plasmid under growth conditions identical to those used in the IC50 measurements. These values (which were normalized to plasmid-expressed E. coli WT DHFR abundance) vary from 0.4- (triple mutant) to 2.8-fold (P21L/L28R double mutant). Similar measurements performed for the orthologous DHFR from C. muridarum and L. grayi indicate that these variants are expressed at much lower levels (Fig. S5 and Dataset S2). Indeed, we observe a strong inverse correlation between abundance and fraction of molten-globule intermediate state assessed by bis-ANS binding (Fig. 2B); no significant correlation is observed between abundance and ΔTm (Fig. S5). In a cellular environment, the DHFR steady-state concentration is governed by the competing action of chaperonins GroEL/ES and protease Lon, which bind molten-globule intermediates of DHFR. Therefore, mutations that change the folding equilibrium toward the formation of molten-globule state shift the protein turnover balance toward degradation, affecting its total abundance. Specifically, the abundance of a DHFR mutant variant in an active cellular milieu is inversely proportional to its in vitro ANS fluorescence, which serves as a readout for fraction of proteins in molten-globule state. This relation was previously predicted (and experimentally verified) in the model of active cytoplasm proposed in our laboratory (13).
Fig. 2.
Mutations associated with TMP resistance affect the intracellular abundance of DHFR. (A) Intracellular abundance of E. coli DHFR mutants expressed from pFLAG plasmid in the absence of inducer (color scheme as in Fig. 1B). Abundance was determined from total catalytic activity measurements in cell lysates prepared from cultures of different mutants grown at 37 °C in M9 minimal media. Values are normalized to WT DHFR expressed from plasmid at the same conditions. (B) Protein abundance is inversely correlated with propensity to form molten-globule intermediates, as assessed by bis-ANS fluorescence. The represented data (mean ± SEM) were obtained from abundance measurements of E. coli DHFR mutants and orthologous DHFRs from L. grayi and C. muridarum including the cognate TMP-resistance mutations. The fit that is shown was obtained using the equation y = A/(γ·ANS), where A = 4.7 × 10⁵ molecules/cell and γ = 1.5.
Fig. S5.
(A) Relative protein abundances determined for DHFR mutants from E. coli, L. grayi, and C. muridarum. Values were normalized to pFLAG-expressed WT E. coli DHFR abundance. (B) Protein abundances do not correlate with ΔTm.
Establishing a Quantitative Genotype-to-Phenotype Relationship for DHFR in E. coli.
The results presented so far illustrate both the broad impact of mutations on multiple molecular traits (catalytic efficiency, Ki, and protein stability). This renders the fitness landscape in terms of molecular properties highly multidimensional, making its description from molecular parameters quite challenging. To overcome this, we sought to develop a simple model that allows a quantitative prediction of the impact of a given physical property at the phenotype level. We have recently studied diverse orthologous replacements of bacterial DHFR in E. coli and demonstrated that fitness, as assessed by cell growth, depends on the flux through DHFR (20) and can be described using the following equation derived in ref. 14:
| [1] |
where Vdhfr is the rate at which dihydrofolate is converted to tetrahydrofolate, B is a constant related to the effect of all other proteins in the enzymatic chain (14, 15), and a denotes maximal fitness at highest flux. Taking into account the competitive mechanism of inhibition by TMP, and considering that DHFR can be treated as a one-substrate enzyme [due to saturating concentrations of intracellular NADPH (21)], Vdhfr can be expressed by a general Michaelis–Menten-like curve:
| [2] |
where [DHFR] and [FH2] are the intracellular concentrations of DHFR and dihydrofolate, respectively, and [TMP]medium is the concentration of TMP in the growth medium. The parameter α is the ratio between the intracellular TMP concentration and that in the growth medium; below we explain how this parameter is determined. Our basic assumptions in this model are that (i) the enzymatic reaction occurs at conditions far from substrate saturation and (ii) the intracellular concentration of dihydrofolate (FH2) is constant so that the reaction becomes pseudo–first-order with respect to DHFR intracellular concentration:
| [3] |
where
To simplify the analysis, we define a normalized reaction rate, Vnorm, by dividing the left side of Eq. 3 by [FH2] and by the catalytic efficiency (kcat/Km) of WT E. coli DHFR:
| [4] |
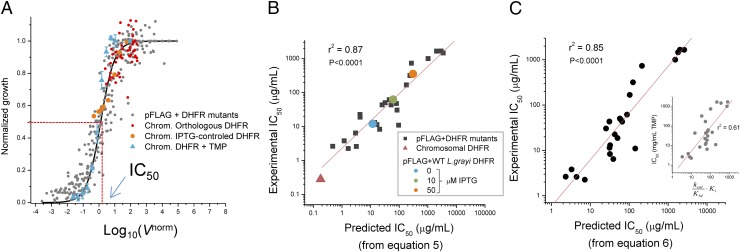
where [kcat/Km]mut, [DHFR]mut, and Kimut are the catalytic efficiency, intracellular concentration, and inhibition constant of a particular DHFR mutant. Because all variables are known from in vitro protein characterization and cellular abundance measurements, Vnorm can be directly estimated for every mutant at any given TMP concentration at which a growth measurement is performed. This allows us to explore the genotype–phenotype link between the DHFR normalized reaction rate and fitness. Such dependence is depicted in Fig. 3A, which shows the data for a total of 24 DHFR variants (including E. coli, L. grayi, and C. muridarum) obtained at 12 different TMP concentrations (Dataset S3). It should be noted that the decrease in DHFR activity due to TMP inhibition increases the control coefficient of the DHFR-catalyzed reaction toward 1.0 so that the flux of the entire pathway becomes largely dependent on that reaction and growth drops proportionally.
Fig. 3.
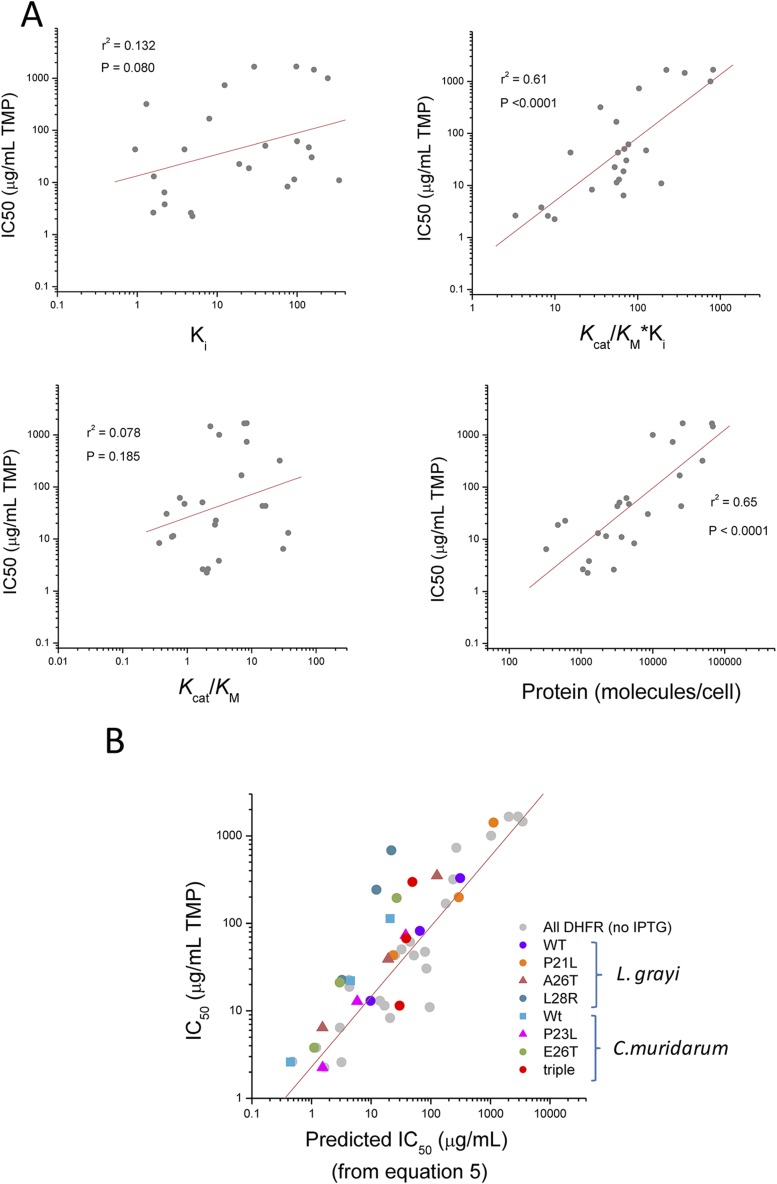
Prediction of IC50 from molecular parameters. (A) Normalized rate of DHFR reaction(Vnorm) determines fitness in E. coli. Growth measurements were performed at 37 °C in M9 minimal media and under varying concentrations of TMP. The Vnorm values were computed at any given TMP concentration using Eq. 4, in which α was set to 0.1, and with input from experimentally determined molecular quantities (protein abundance and catalytic constants) for each DHFR mutant. The results shown include data from TMP inhibition determined for all E. coli, L. grayi, and C. muridarum DHFR mutants expressed from pFLAG plasmid (gray) and nontransformed E. coli MG1655 strain expressing solely its endogenous chromosomal DHFR (blue). The solid line represents the best fit of the data using Eq. 1 with a = 1, and from which B was determined from nonlinear regression (1.3 ± 0.1 SE). Also shown for comparison are the fitness data obtained in previous works where orthologous DHFRs have been incorporated in E. coli chromosome (20) and where chromosomal DHFR was under IPTG-controlled expression (13) (red and orange points, respectively). (B) Comparison of experimental vs. predicted IC50 for TMP in strains expressing DHFR mutants from pFLAG. Predicted IC50 were calculated from Eq. 5 using estimates of cellular DHFR abundance and catalytic parameters. Increasing the pFLAG-based expression of a particular mutant DHFR by means of adding IPTG results in corresponding increase in IC50 as predicted from Eq. 5. Data obtained for parent strain MG1655 E. coli expressing only its chromosomal DHFR are shown. (C) Prediction of fitness from protein biophysics. IC50 was predicted using Eq. 6, in which the protein abundance term in Eq. 5 was replaced by 1/ANS from the reciprocal relationship shown in Fig. 2. (Inset) The decrease in the correlation coefficient if the protein abundance term, or its predictor (1/ANS), is omitted in the equation.
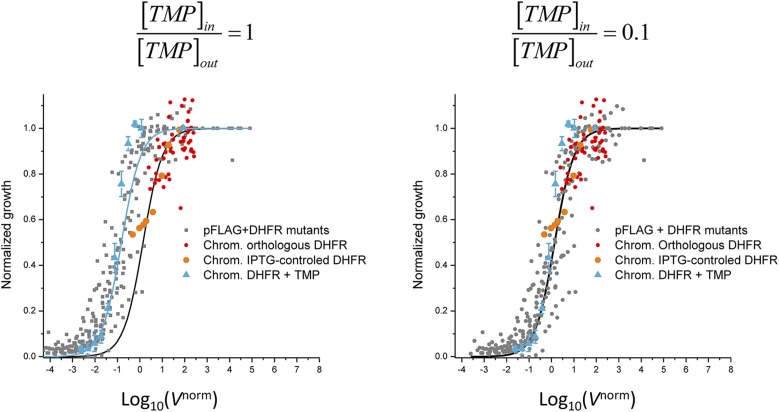
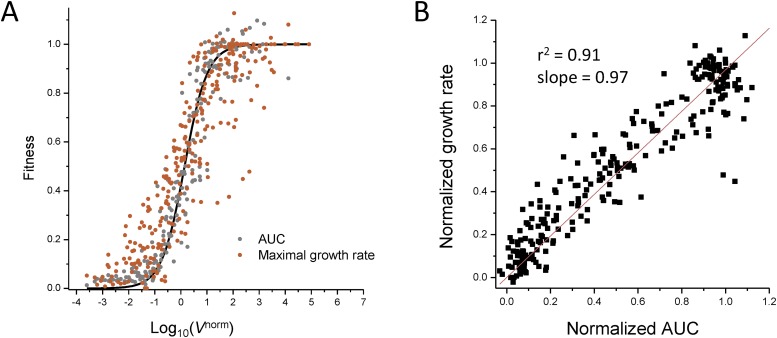
We determined the TMP penetration ratio parameter by fitting the present measurements of fitness in the presence of TMP shown in Fig. 3A to the fitness data from previous studies obtained by variation of DHFR properties without TMP [down-regulation of DHFR expression using IPTG-controllable promoter (13) and chromosomal orthologous replacements of DHFR (20)]. The best superposition of data is achieved at , which is very close to the earlier direct measurements of fraction of TMP penetrating into bacterial cytoplasm (22) (see Supporting Information and Fig. S6 for details). There is a remarkable superimposition of all data, in particular around the steep drop in fitness. Similar, albeit a bit noisier, results are obtained if fitness is defined as the maximal growth rate instead of using the integral of the growth curve (Fig. S7). A set of points obtained for untransformed parent E. coli strain MG1655, expressing solely its WT chromosomal DHFR, grown at different TMP concentrations shows a good superimposition as well [with slight deviation at higher fitness probably due to activation of the DHFR promoter through a feedback loop (23, 24)]. Also included for comparison are the data points obtained in previous studies using chromosomal orthologous DHFR replacements (20) and an IPTG-inducible promoter-controlled chromosomal DHFR expression system (13). Fitting the data points with Eq. 1 resulted in an excellent quantitative prediction of fitness, in agreement with recent work (20). The parameter B resulting from the nonlinear fit of Eq. 1 to all data points was found to be B = 1.3 ± 0.1, whereas the average of B values determined from independent fits of the growth data obtained for each individual mutant DHFR strain at different concentrations of TMP was 1.7 ± 0.4 (mean ± SE). The flux model therefore allows quantitative prediction of drug resistance and fitness (expressed as IC50) from molecular parameters of DHFR. The observed relationship in Fig. 3A holds in a broad range of parameters, especially with the absolute intracellular DHFR concentration ranging from ∼90 copies per cell (MG1655 strain, chromosomal expression) to ∼70,000 copies per cell (E. coli double mutant P21L/L28R, pFLAG expression), the catalytic efficiency (kcat/Km) values ranging from 0.1 to 37 µM−1⋅s−1, and the inhibition constant Ki ranging from 1 to 330 nM (see Table S1 for the full list).
Fig. S6.
Dependence of normalized growth with Vnorm calculated from Eq. 4 using α = 1 (Left) and 0.1 (Right).
Fig. S7.
Fitness definition does not change the shape of the curve in Fig. 3A. (A) Replot of Fig. 3A using the maximal growth rate as a proxy for fitness instead of the area under the growth curve (AUC). (B) Comparison of fitness data defined by both the area under the curve and maximal growth rates.
Table S1.
In vitro properties determined for DHFR mutants
| DHFR variant | kcat, s−1 | Km, μM | kcat/Km, s−1⋅μM−1 | Ki, nM | Bis-ANS | Tm, °C | ΔTm, °C |
| E. coli | |||||||
| WT | 14 | 0.87 | 16.4 | 0.94 | 1.0 | 57.7 | 0 |
| P21L | 9.3 | 0.34 | 27.3 | 1.3 | 1.2 | 49.3 | −8.4 |
| A26T | 5.4 | 0.78 | 6.97 | 8.0 | 2.3 | 52.9 | −4.8 |
| L28R | 1.7 | 0.22 | 7.70 | 29 | 0.4 | 63.7 | 6 |
| P21L/A26T | 7.9 | 0.94 | 8.38 | 12 | 2.1 | 43.7 | −14 |
| P21L/L28R | 0.31 | 0.14 | 2.29 | 162 | 0.9 | 57.2 | −0.5 |
| A26T/L28R | 1.6 | 0.19 | 8.39 | 98 | 1.7 | 58.1 | 0.4 |
| P21L/A26T/L28R | 1.0 | 0.30 | 3.14 | 242 | 2.1 | 58.5 | 0.8 |
| L. grayi | |||||||
| WT | 67 | 1.80 | 37.1 | 1.6 | 7.9 | 53.4 | −4.3 |
| P21L | 5.6 | 0.38 | 14.8 | 3.9 | 8.0 | 50.7 | −7 |
| A26T | 55 | 1.76 | 30.9 | 2.2 | 7.4 | 49.8 | −7.9 |
| L28R | 7.2 | 2.56 | 2.80 | 19 | 5.3 | 50.1 | −7.6 |
| P21L/A26T | 15 | 5.50 | 2.70 | 25 | 5.8 | 48.5 | −9.2 |
| P21L/L28R | 0.2 | 0.4 | 0.48 | 152 | 12.1 | 51.2 | −6.5 |
| A26T/L28R | 0.2 | 0.2 | 0.91 | 140.0 | 8.8 | 52.5 | −5.2 |
| P21L/A26T/L28R | 0.15 | 0.27 | 0.58 | 335 | 5.7 | 47.9 | −9.8 |
| C. muridarum | |||||||
| WT | 11 | 5.48 | 2.10 | 1.6 | 6.1 | 56.4 | −1.3 |
| P23L | 5.4 | 2.67 | 2.02 | 4.9 | 5.8 | 58.2 | 0.5 |
| E28T | 5.1 | 1.65 | 3.11 | 2.2 | 8.9 | 55 | −2.7 |
| L30R | 1.0 | 1.27 | 0.77 | 100 | 3.8 | 58.4 | 0.7 |
| P23L/E28T | 1.2 | 0.66 | 1.75 | 4.7 | 7.9 | 58.1 | 0.4 |
| P23L/L30R | 0.24 | 0.65 | 0.37 | 76 | 3.7 | 57.6 | −0.1 |
| E28T/L30R | 1.3 | 0.76 | 1.73 | 40 | 5.1 | 55.1 | −2.6 |
| P23L/E28T/L30R | 0.61 | 1.00 | 0.61 | 92 | 7.5 | 55.4 | −2.3 |
Predicting IC50 from DHFR Biophysics.
It is clear from Eq. 1 that fitness is halved when Vnorm is equal to the constant B. Therefore, the left-hand side of Eq. 4 can be set equal to B when the TMP concentration corresponds to IC50. From the resulting equation it is possible to directly compute TMP IC50 for a given DHFR mutant:
| [5] |
Fig. 3B shows a clear linear relationship between measured IC50 and the prediction from Eq. 5 (slope = 0.80, r2 = 0.87, P < 0.001). Such high correlation is achieved when all three factors—abundance, catalytic activity, and TMP binding affinity—are taken into account. The predictive power is greatly diminished if any of the variables in Eq. 5 is dropped (Fig. S8). For example, binding affinity Ki or catalytic activity kcat/Km alone are poor predictors of antibiotic resistance IC50 (r2 = 0.13 and 0.08, respectively). Statistically significant yet weaker predictions of IC50 can be obtained using solely the product kcat/Km × Ki (r2 = 0.61, P < 0.001) or protein abundance alone (r2 = 0.625, P < 0.001), yet only the full combination of all three biophysical parameters as given by Eq. 5 can provide highly accurate predictions. This result demonstrates that the model chosen to predict fitness is quite robust, even though it was based on several simplifying assumptions. One important prediction from Eq. 5 is that the IC50 of any given mutant should vary proportionally to intracellular concentration of DHFR when other molecular parameters remain unchanged. This prediction was tested by increasing the DHFR expression from the plasmid using different amounts of inducer IPTG and is highlighted in Fig. 3B for WT L. grayi. Similar experiments were performed with a set of mutants from L. grayi and C. muridarum (Fig. S8), but not for E. coli DHFR WT and mutants because overexpression of E. coli DHFR is toxic to E. coli (25).
Fig. S8.
(A) Prediction of IC50 from isolated molecular traits. (B) Change in IC50 upon induction of protein expression with increasing amounts of IPTG. Each color set represents three different IPTG concentrations (control and 10 and 50 μM).
Our analysis based on Eq. 5 indicates that both molecular (kcat/Km and Ki) and cellular (protein abundance) properties of DHFR need to be established for accurate prediction of IC50. However, the relationship existing between a particular molecular trait of DHFR, namely its in vitro ANS fluorescence and intracellular abundance, as established in ref. 13 and confirmed here (Fig. 2B), allows prediction of IC50 solely from the molecular properties of DHFR by replacing the term [DHFR] in Eq. 5 by 1/ANS:
| [6] |
where A and γ are parameters derived from the fit shown in Fig. 2B. Indeed Fig. 3C shows that this approximation results in a fairly good prediction of IC50 (slope = 1.0, r2 = 0.86, P < 0.001). This result shows that fitness in the presence of antibiotic can be predicted exclusively from biophysical parameters of arising DHFR mutants, given that growth conditions (e.g., concentration of the inducer) remain the same.
Epistasis.
We can evaluate the degree of epistasis in the effect of mutations on all measured molecular, cellular, and fitness traits. We use the definition of epistasis introduced in ref. 10 as
| [7] |
where are values of a trait for WT, mutant A, mutant B, and double mutant AB alleles, respectively. Here we consider epistasis in the effect of mutation on all molecular traits, abundance (cellular trait), and fitness represented by IC50 values for each mutant. The results presented in Table 1 for E. coli mutants show predominantly negative epistasis with some notable exceptions such as kcat/Km for L28R/A26T and Ki for L28R/P21L, which probably reflects the fact that L28R is a stabilizing mutation. All mutations show negative epistasis in IC50, due to the trade-offs that reflect pleiotropic effects of mutations on molecular traits of DHFR.
Table 1.
Prevalence of negative epistasis in the effect of mutations on molecular and fitness traits of E. coli DHFR
 |
The threshold of neutrality is defined as 0.1.
Protein Quality Control Affects the Fitness Landscape.
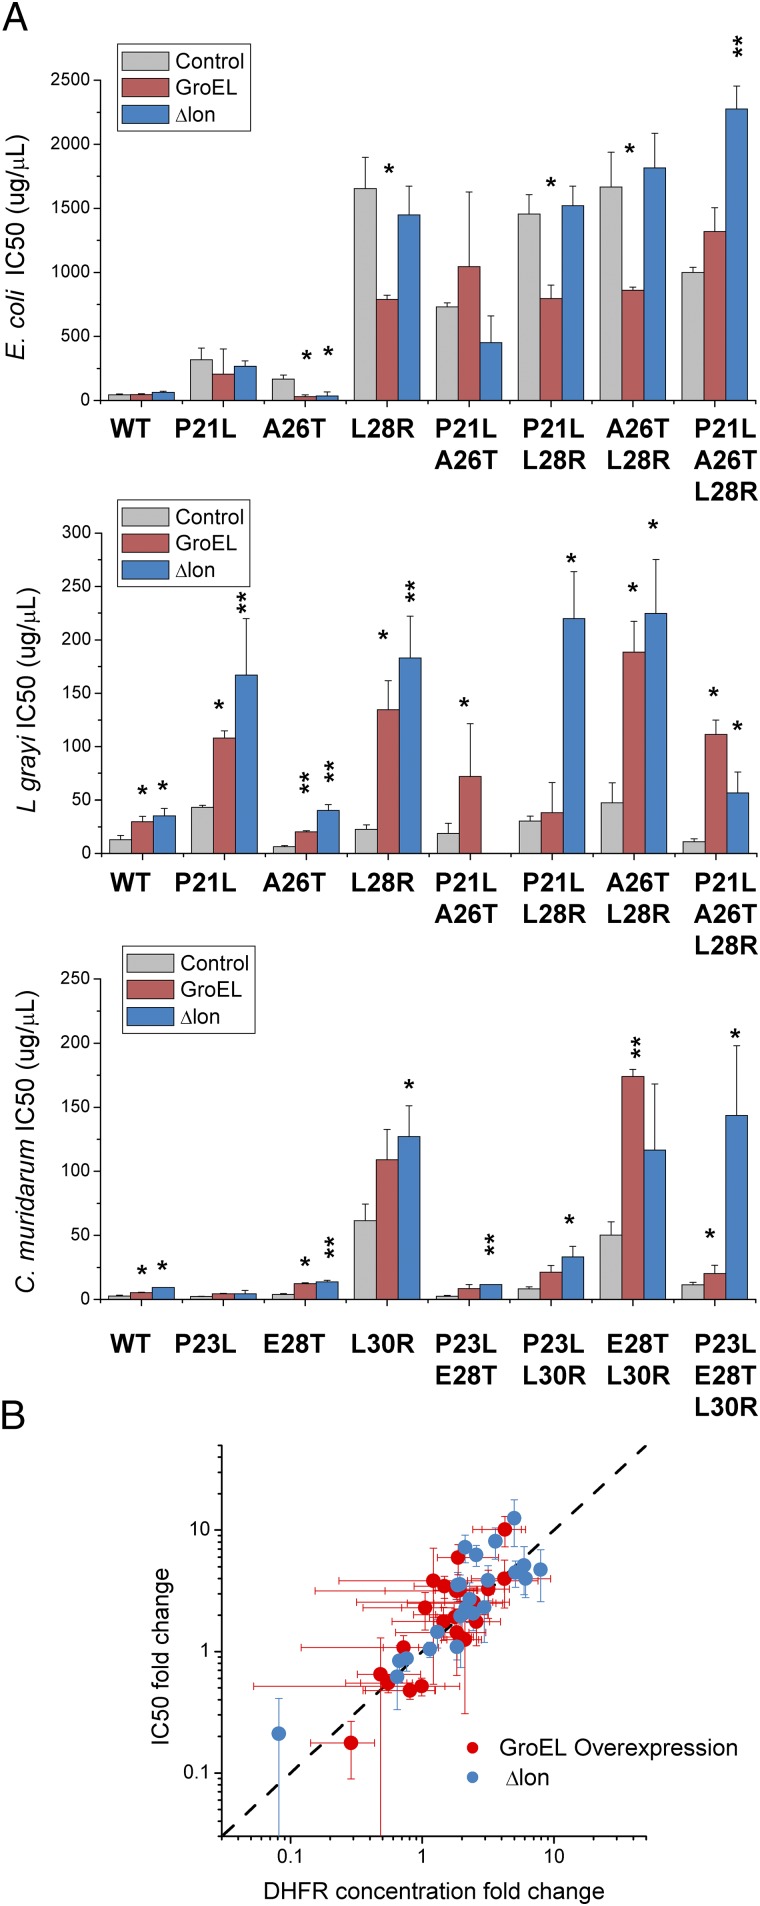
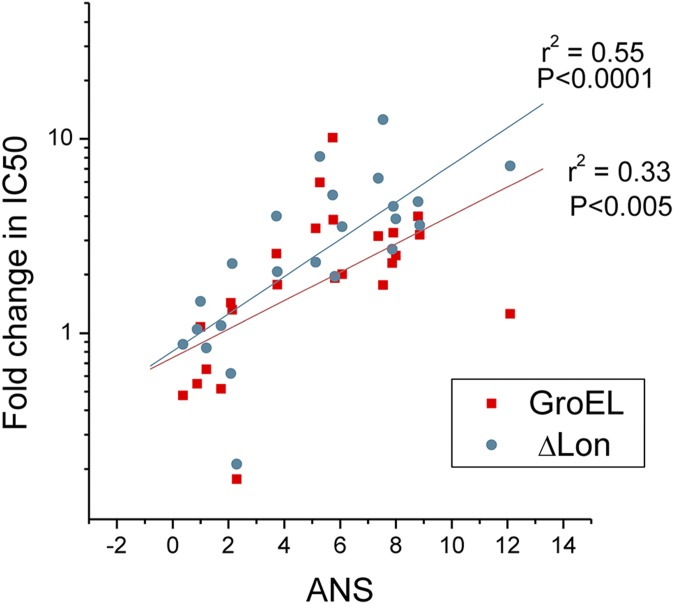
In the earlier work (13) we established the role of protein quality control (PQC) machinery, in particular GroEL chaperonins and Lon protease, in rescuing fitness of E. coli DHFR deleterious mutants and orthologous DHFR replacements from different bacteria. We asked how PQC would act on TMP-resistant mutants and thus affect their fitness under antibiotic selection pressure. To that end, we measured IC50 and protein abundances for all E.coli and orthologous DHFR mutants on the background of GroEL overexpression (GroEL+; see details in SI Methods and ref. 13) or Lon knockout (Δlon). Fig. 4A shows the different effects of GroEL+ and Δlon on IC50 determined for DHFR mutants from E. coli, L. grayi, and C. muridarum. With some exceptions, GroEL+ and Δlon have a neutral or even deleterious effect on E. coli DHFR mutants. Notably, the E. coli DHFR triple mutant benefits most from GroEL+ background and especially Δlon, the latter resulting in a doubling of its IC50. Apparently, the fitness landscape on the Δlon background is different from the one shown in Fig. 1C, because the triple mutant seems to be most fit at high concentration of TMP. The effects of GroEL+ and Δlon on DHFR from L. grayi and C. muridarum are more pronounced, especially for double and triple mutants, increasing in some cases IC50 by one order of magnitude. Remarkably, the magnitude of the effects observed for GroEL+ and Δlon correlate quite well with bis-ANS properties of the DHFR mutants (Fig. S9), in agreement with previous results showing that both components of PQC affect DHFR molten-globule–like intermediates (13).
Fig. 4.
Resistance to TMP is influenced by components of the PQC system. (A) Impact of GroEL overexpression and Lon protease deletion on IC50 (mean ± SEM) determined for E. coli and orthologous DHFR mutants from L. grayi and C. muridarum. *P < 0.05, **P < 0.005. (B) Effect of GroEL overexpression and Lon deletion affect IC50 mostly through their effect on protein abundance. Protein abundances were determined for various E. coli, L. grayi, and C. muridarum DHFR mutants under GroEL overexpression or Lon deletion. The dotted line shows a theoretical linear dependence with slope = 1.
Fig. S9.
Magnitude of the effect of GroEL and ΔLon on IC50 correlates with ANS properties of DHFR variants.
Fig. 4B shows that changes in IC50 caused by GroEL overexpression or Lon deletion can be directly attributed to their impact on protein abundance, as expected from Eq. 5.
Altogether, these results show how the fitness landscape can drastically change by the action of PQC through its effect on the steady-state concentration of protein. Again, the importance of protein biophysical properties is highlighted, in particular ANS binding, because these properties determine, at least in part, how specific DHFR mutants may be rescued/degraded by cellular chaperones and proteases.
Deconvolution of Fitness into Microlandscapes Shows Strong Epistasis.
Analysis of the fitness landscape of a complete combinatorial set of mutations, as in this work, is particularly helpful in determining which trajectories are accessible in evolutionary dynamics. This can be regarded as a macroscopic integrated map, which is built upon multiple microscopic landscapes, one for each molecular trait. From this perspective, Eq. 5 is particularly useful because it allows dissection of fitness into microlandscapes, as shown in Fig. 5, where the contribution of each property into fitness effect is mapped for every mutation in a quantitative way. Such analysis helps to highlight which molecular features mostly affect IC50, improving our understanding of what molecular factors shape evolution at different stages of selection. For instance, it becomes obvious that changes in the ability to escape drug (Ki) are the key determinants of the drug resistance, especially at later stages of evolution (double and triple mutants), because variations in protein abundance are comparably smaller (Fig. 5 B and C). Nevertheless, because the effective catalysis parameter (kcat/Km × Ki) is not very high in single mutants (except L28R), compared with double and triple mutants, one can expect that other competing mutations occurring genomewide that might result in a significant increase in DHFR abundance could give a selective advantage over single mutations in the active site of DHFR. Interestingly, in the evolutionary experiment against TMP, mutations in the DHFR promoter region were frequently fixed first, resulting in a >10-fold increase in IC50 (1). In particular, the mutation –35C→T in the DHFR promoter has been shown to be associated with increased production of folA gene product (26). However, mutants with the highest kcat/Km × Ki such as A26T/L28R and the triple mutant should benefit more than P21L/L28R or P21L/A26T from any increase in protein abundance that may be caused by a pleiotropic effect of mutations occurring outside of folA locus. Inactivation or down-regulation of Lon protease, which effect is shown in Fig. 4, may constitute one such mechanism, and, in fact, has been observed recently during the evolution of strains with orthologous replacements of DHFR (20) and in the evolution of antibiotic resistance (5, 27).
Fig. 5.
Quantitative dissection of fitness into multiple microscopic landscapes of different molecular traits. (A) Relative resistance to TMP computed by the product [DHFR] × kcat/Km × Ki. (B) Relative contribution of protein abundance and catalysis to overall fitness. (C) Catalysis term is decomposed into catalytic efficiency and Ki.
SI Methods
Growth Measurements and IC50 Determination.
Overnight cultures were prepared by inoculating, from agar plate colonies, 96-well plates containing M9 minimal medium in four or five replicates. After ∼18 h growth at 37 °C the cells were normalized to an OD = 0.1 by addition of fresh medium using an automated liquid handling Freedom Evo (Tecan). Normalized cultures (200 µL) were used to inoculate 48-well plates containing 800 µL of fresh medium. At this point, whenever appropriate, induction of DHFR expression above basal leakage was initiated by the addition of IPTG (10–100 µM), whereas 0.2% arabinose was added to the cultures of cells harboring GroEL overexpression plasmid. After growth for additional 5–6 h, part of the culture replicates were taken for intracellular DHFR abundance determination (discussed below) and the remaining were again normalized to an OD = 0.1. The cultures were used to inoculate in triplicate 96-well plates (1/5 dilution) containing 12 different concentrations of TMP (0–2,500 µg/mL); final culture volume in each well was 200 μL. Multiple plates were incubated in a multiplate shaker (Liconic Instruments), and absorbance measurements at 600 nm were taken every 30 min during 15 h. Growth was quantified by integration of the area under the growth curve (OD vs. time) between 0 and 15 h, as described in ref. 2. Growth integrals determined for a given mutant are normalized in respect to the growth measured for that mutant in the absence of TMP. Normalized growth data were plotted against TMP concentration and IC50 values were determined from the fit of a logistic equation to the data points. Reported IC50 are averaged from at least three replicates, and SEs are indicated.
Measurements of Intracellular Protein Abundance.
Cultures processed in parallel with those used for growth measurements were transferred to 96-deep-well plates (900 µL each) after recording the OD (typically between 0.15–0.3). Cells were pelleted by centrifugation and frozen at −20 °C. Upon thawing, cells were ressuspended in 100 μL of 50 mM MES buffer, pH 7.0, supplemented with 1× Pop Culture reagent (Merck Millipore) and 1× complete protease inhibitor mixture (Roche) and lysed during 20 min with gentle stirring. The lysate was cleared by centrifugation and 40 µL of soluble fraction was taken from each well and transferred to 96-well white plates (round bottom) for total activity measurements. The lysate was preincubated with NADPH (5 μL added to each well, 100 μM final concentration), and the reaction was started with the addition of 5 µL dihydrofolate (50 μM final concentration). The plate was immediately placed in a Magellan plate reader (Tecan), and the decrease in fluorescence (excitation at 300 nm and emission at 400 nm) was measured over 20 min at 25 °C. The activities were measured by determining the slope at the initial linear portion of the reaction curve. A conversion factor determined from a calibration curve using known amounts of dihydrofolate, in the presence of NADPH and purified DHFR, was used to convert changes in fluorescence intensity into reaction velocities. Protein abundance was determined by dividing the total activity by kcat, which was then normalized by number of cells, taking into account the corresponding OD and considering that 1 mL of culture at an OD = 1 has ∼1 × 10⁹ cells. Protein abundance of chromosomal DHFR expressed in parent strain MG1655 was assayed using the same procedure as above but with some differences. The initial concentration of cells used in the assay was the double of that typically used in plasmid expression measurements. In addition, the slope measured in cell lysates was corrected by subtracting the slope of a control experiment performed in identical conditions but in which the DHFR reaction was inhibited by the presence of 0.1 μM TMP.
Determination of Inhibition Constants (Ki) for TMP.
Purified enzymes were incubated with NADPH (100 μM) at different concentrations of TMP in MTEN buffer, pH 7.0, at 25 °C, and the reaction was started by the addition of 30 μM dihydrofolate. Concentration of each DHFR variant was chosen so that the uninhibited reaction would take 3–4 min to deplete all dihydrofolate initially present. The initial reaction rates at each inhibitor concentration were measured using a 96-well plate reader (Biotek) by following NADPH oxidation at 340 nm. Initial rates were converted to fractional inhibition and plotted against TMP concentration. The inhibition constant was determined by fitting the following equation to the experimental data (36):
where v0 and vi are the reaction velocities determined in the absence and presence of inhibitor, respectively, and Km had been previously determined from the progress curve experiments. This approach relies on the assumption of a competitive mode of action of TMP inhibition in all DHFR variants.
Estimating the Ratio Between Intracellular and Extracellular Concentration of TMP.
The fraction of TMP that enters E. coli cells is not known exactly but it has been shown that permeability E. coli mutants have 10-fold lower IC50 (22), which indicates that only about 10% of the drug actually enters the cells. When the data shown in Fig. 3A were calculated from Eq. 4 considering that the intracellular concentration of TMP is the same as that of solution, the resulting curve was shifted in respect to the fitness data obtained in the absence of TMP. We reasoned that this difference would be justified by a smaller fraction of the drug entering the cells. Therefore, we use fitness data in the absence of TMP to calibrate the curve obtained via TMP inhibition, and setting the ratio intracellular vs. extracellular TMP concentration to 0.1 resulted in superimposition of data (Fig. S6). This seems to be a quite reasonable estimate that is in agreement with the results obtained using permeability mutant (22).
Discussion
The metaphor of fitness landscape is widely used to highlight certain aspects of the genotype–phenotype relationship. It is either postulated a priori (28) or presents a mapping of known genetic variants to fitness (2, 4). However, the most detailed form of a fitness landscape, where each possible genetic variant is mapped to fitness, would be prohibitively complex. An alternative way to provide a tractable and predictive fitness landscape would be to use an intermediate phenotype to map fitness onto molecular properties of the target enzyme (13, 20, 29, 30). This approach runs the risk that important biology could be lost upon projection of fitness onto a limited set of molecular properties. In this work we showed that mapping fitness to molecular properties of DHFR provides an accurate and predictive fitness landscape that establishes the quantitative genotype–phenotype relationship for DHFR. We showed that a unique combination of molecular parameters can serve as an accurate predictor of fitness from the biophysical properties of the enzyme alone. The resulting biophysical fitness landscape makes it possible to predict fitness across a broad range of concentrations of TMP.
We found that no single molecular trait determines the IC50 value of antibiotic resistance. Rather, mutations simultaneously affect several properties of DHFR and there is a trade-off between beneficial effects of mutations that weaken the binding to TMP at the expense of partial loss of catalytic activity, resulting in extensive, predominantly negative, epistasis (Table 1). Furthermore, the analysis presented in Fig. 5 suggests that the relative importance of fitness contributions of different molecular traits varies with conditions such as concentration of antibiotic; strong effect of a drug concentration on the relative fitness of alleles of Plasmodium vivax DHFR is a clear example (6). Importantly, relevant molecular properties of target proteins (stability, catalysis, and drug binding) can be determined in a broad range of conditions such as temperature and pH, allowing one to extend the trait-specific landscape predictions into a broader range of environments. The analysis for properties that are governed by biological processes, such as protein abundance, is more challenging because this requires a deeper understanding of complex cellular mechanisms. Activation of DHFR promoter is particularly important because it directly affects the intracellular abundance. The emergence of mutations in the promoter region during TMP adaptation clearly highlights its role in evolution (1); however, many aspects of transcription feedback for DHFR are still poorly understood. Such complexities do not affect the results of our work, because the expression of DHFR here is plasmid-based.
We also found that PQC plays an important role in sculpting the fitness landscape of antibiotic resistance, in some cases determining the genomic outcome of adaptation. For example, both our analysis and ref. 2 indicate that the triple mutant of E. coli DHFR has lower IC50 than several other mutants, yet it gets fixed at higher concentration of TMP in dynamic morbidostat experiments in ref. 1. The triple mutant becomes a clear winner on the Δlon background. It is, therefore, possible that Lon inactivation or, alternatively, a significant down-regulation of the intracellular Lon levels, may have preceded the fixation of the triple mutant. Indeed, inactivation of Lon via insertion of the mobile element IS186 was observed previously in adaptation to other antibiotics (5, 27) and in adaptation after orthologous replacement of DHFR (20). Furthermore, a dramatic drop in Lon abundance in response to chromosomal integration of destabilized DHFR mutants has been observed (24). Similarly, up-regulation of GroEL can serve as an adaptive mechanism to buffer the deleterious effects of mutations (31, 32), in our case by rescuing molten-globule intermediates. Conversely, we found that GroEL+ can also be deleterious for the mutants with increased stability (L28R in E. coli). The mechanism of such deleterious effect remains to be established. Again, a detailed characterization of how Lon, GroEL, and possibly other elements of PQC respond to different factors (e.g., TMP-induced stress) is fundamental to improve the accuracy of fitness landscapes prediction at conditions more similar to those found in several evolutionary experiments.
The Monod-type dependence of fitness on protein activity as presented in Eq. 1 was predicted by Kacser and Burns (14) and found experimentally in the analysis of fitness for the mutant forms of lac operon proteins β-permease and β-galactosidase (15). More recently we found that same relation holds for fitness in strains with orthologous DHFR replacements (20). Bolon and coworkers (33) found that a similar Monod “elasticity curve” well describes fitness effects of variation of Hsp90 expression in yeast. It is, therefore, likely that the Monod dependence in Eq. 1 is generally applicable to a broad range of fitness effects, and our analysis could be extended either to different organisms or to the adaptation against antibiotics that target other enzymes. In any case, it might be expected that under different experimental conditions a Monod-type fit of the curve shown in Fig. 3A would result in a different value of the fitted parameter B. This variable is a property of the system and pathway-specific and thus should be measured whenever the conditions are different.
The major advantage of biophysical mapping of a fitness landscape is that it can predict fitness not only across a broad range of conditions but also potentially can be used for predicting the fitness effects of de novo mutations. Recent advances in computational methods for predicting the effects of mutations on DHFR stability are definitively valuable (34); however, computational prediction of mutational changes in catalytic properties is still an important bottleneck in this direction. A multiscale approach that merges molecular analysis with biophysical fitness landscapes and population-level evolutionary dynamics would then provide a path to predict in silico and in vitro the outcomes of key adaptation events such as bacterial and viral escape from antibodies and antibiotics.
Methods
DHFR Gene Constructs.
All seven possible combinations of mutations at three sites (P21L, A26T, and L28R) of E.coli folA gene were introduced by Quick-Change Site-Directed Mutagenesis Kit (Stratagene) and cloned into the expression vector pFLAG (Sigma-Aldrich). Each mutagenized plasmid was sequenced to confirm the presence of expected mutations, and the absence of any other mutations. Similarly, we constructed all possible combinations of mutations in the genes coding for DHFR proteins from C. muridarum and L. grayi in the loci corresponding to the three resistant mutations in E. coli DHFR. These sites are P23L, E28T, and L30L for L. grayi and P21L, A26T, and L28R for C. muridarum.
Growth Measurements and IC50 Determination.
Cultures grown overnight at 37 °C in M9 minimal medium were normalized to an OD of 0.1 with fresh medium. When appropriate, GroEL overexpression and/or increase in DHFR concentrations were induced by adding arabinose and IPTG immediately after normalization. After additional growth during 5–6 h a new normalization to an OD = 0.1 was performed before inoculation of 96-well plates (1/5 dilution) containing M9 medium and 12 different concentrations of TMP (0–2,500 µg/mL). The plates were incubated at 37 °C with orbital shacking and absorbance measurements at 600 nm were taken every 30 min during 15 h. Growth was quantified by integration of the area under the growth curve (OD vs. time) between 0 and 15 h, as described in ref. 2. Growth integrals determined for a given mutant were normalized in respect to the corresponding growth of that mutant measured in the absence of TMP. IC50 values were determined from the fit of a logistic equation to plots of growth vs. TMP concentrations. Reported IC50 are averaged from at least three replicates and SEs are indicated.
Measurements of Intracellular Protein Abundance.
Cells from cultures grown at 37 °C were lysed with 1× Pop Culture reagent (Merck Millipore) in the presence of 1× complete protease inhibitor mixture (Roche). The lysate was cleared by centrifugation and the soluble fraction was transferred to 96-well white plates for total activity measurements. The lysate was preincubated with 100 μM NADPH and the reaction was started with the addition of 50 μM dihydrofolate. The decrease in fluorescence (excitation at 300 nm and emission at 400 nm) was measured over 20 min at 25 °C. Protein abundance was determined by dividing the total activity by kcat.
Protein Overexpression and Purification.
E. coli BL21 cells transformed with pFLAG + C-terminal His-tagged DHFR were grown in Terrific broth medium and protein overexpression was induced when OD = 1 with 100 μM IPTG during ∼18 h at 300 rpm and 20 °C. The recombinant proteins were purified from clarified cell lysates on Ni-NTA columns (Qiagen) followed by size-exclusion chromatography separation (Superdex 75 10/300 GL).
Steady-State Kinetic Measurements.
DHFR kinetic parameters were measured by progress-curve kinetics, essentially as described before (13). The reaction was carried out in MTEN buffer [50 mM 2-(N-morpholino)ethanesulfonic acid, 25 mM Tris(hydroxymethyl)aminomethane, 25 mM ethanolamine, and 100 mM sodium chloride, pH 7] at 25 °C and was monitored spectrophotometrically to follow the decrease in absorbance at 340 nm due to NADPH oxidation. The kinetics parameters (kcat and Km) were derived from progress-curves analysis using Global Kinetic Explorer (35) by simultaneous fitting of data obtained at two different dihydrofolate concentrations (2.5 and 10 μM).
Determination of Inhibition Constants (Ki) for TMP.
Inhibition constants were determined from kinetic competition experiments performed at fixed substrate concentration 100 μM NADPH and 30 μM dihydrofolate and varying inhibitor concentrations. Activity measurements were performed at 25 °C by following NADPH oxidation at 340 nm. Inhibition constants were calculated from plots of activity vs. inhibitor concentration by fitting a competitive-type inhibition equation (36).
Thermal Denaturation.
DHFR solutions (5 μM) were prepared in 50 mM phosphate buffer and 1 mM DTT at pH 7.0 in the presence of 100 μM NADPH. A temperature ramp of 1 °C/min was set between 25 and 90 °C, and the fluorescence intensity at 370 and 320 nm was recorded upon excitation at 280 nm. Thermal melting curves were analyzed by plotting the ratio of intensities 370/320 nm.
bis-ANS Fluorescence Measurements.
DHFR protein solutions (2 μM) in the presence of 12 μM of bis-ANS were prepared in 50 mM phosphate and 1 mM DTT at pH 7.0 and placed in a 1-cm path-length quartz cuvette. The samples were equilibrated for 5 min at 37 °C and the fluorescence emission spectra between 460 and 600 nm were recorded upon excitation at 395 nm. The emission band was integrated and the background of bis-ANS fluorescence in the absence of protein was subtracted. Intensity integrals were normalized to WT E. coli. DHFR.
Supplementary Material
Acknowledgments
We thank Roy Kishony for very helpful comments. This work was funded by National Institute of General Medical Sciences Grant GM068670 (to E.I.S.) and NIH Grant AI106734 (to D.L.H.).
Footnotes
The authors declare no conflict of interest.
This article contains supporting information online at www.pnas.org/lookup/suppl/doi:10.1073/pnas.1601441113/-/DCSupplemental.
References
- 1.Toprak E, et al. Evolutionary paths to antibiotic resistance under dynamically sustained drug selection. Nat Genet. 2012;44(1):101–105. doi: 10.1038/ng.1034. [DOI] [PMC free article] [PubMed] [Google Scholar]
- 2.Palmer AC, et al. Delayed commitment to evolutionary fate in antibiotic resistance fitness landscapes. Nat Commun. 2015;6:7385. doi: 10.1038/ncomms8385. [DOI] [PMC free article] [PubMed] [Google Scholar]
- 3.Lozovsky ER, et al. Stepwise acquisition of pyrimethamine resistance in the malaria parasite. Proc Natl Acad Sci USA. 2009;106(29):12025–12030. doi: 10.1073/pnas.0905922106. [DOI] [PMC free article] [PubMed] [Google Scholar]
- 4.Weinreich DM, Delaney NF, Depristo MA, Hartl DL. Darwinian evolution can follow only very few mutational paths to fitter proteins. Science. 2006;312(5770):111–114. doi: 10.1126/science.1123539. [DOI] [PubMed] [Google Scholar]
- 5.Oz T, et al. Strength of selection pressure is an important parameter contributing to the complexity of antibiotic resistance evolution. Mol Biol Evol. 2014;31(9):2387–2401. doi: 10.1093/molbev/msu191. [DOI] [PMC free article] [PubMed] [Google Scholar]
- 6.Jiang PP, Corbett-Detig RB, Hartl DL, Lozovsky ER. Accessible mutational trajectories for the evolution of pyrimethamine resistance in the malaria parasite Plasmodium vivax. J Mol Evol. 2013;77(3):81–91. doi: 10.1007/s00239-013-9582-z. [DOI] [PubMed] [Google Scholar]
- 7.Neher RA, Russell CA, Shraiman BI. Predicting evolution from the shape of genealogical trees. eLife. 2014;3:3. doi: 10.7554/eLife.03568. [DOI] [PMC free article] [PubMed] [Google Scholar]
- 8.Lobkovsky AE, Wolf YI, Koonin EV. Predictability of evolutionary trajectories in fitness landscapes. PLOS Comput Biol. 2011;7(12):e1002302. doi: 10.1371/journal.pcbi.1002302. [DOI] [PMC free article] [PubMed] [Google Scholar]
- 9.Costanzo M, et al. The genetic landscape of a cell. Science. 2010;327(5964):425–431. doi: 10.1126/science.1180823. [DOI] [PMC free article] [PubMed] [Google Scholar]
- 10.Ostman B, Hintze A, Adami C. Impact of epistasis and pleiotropy on evolutionary adaptation. Proc Biol Sci. 2012;279(1727):247–256. doi: 10.1098/rspb.2011.0870. [DOI] [PMC free article] [PubMed] [Google Scholar]
- 11.Lázár V, et al. Genome-wide analysis captures the determinants of the antibiotic cross-resistance interaction network. Nat Commun. 2014;5:4352. doi: 10.1038/ncomms5352. [DOI] [PMC free article] [PubMed] [Google Scholar]
- 12.Bershtein S, Mu W, Shakhnovich EI. Soluble oligomerization provides a beneficial fitness effect on destabilizing mutations. Proc Natl Acad Sci USA. 2012;109(13):4857–4862. doi: 10.1073/pnas.1118157109. [DOI] [PMC free article] [PubMed] [Google Scholar]
- 13.Bershtein S, Mu W, Serohijos AW, Zhou J, Shakhnovich EI. Protein quality control acts on folding intermediates to shape the effects of mutations on organismal fitness. Mol Cell. 2013;49(1):133–144. doi: 10.1016/j.molcel.2012.11.004. [DOI] [PMC free article] [PubMed] [Google Scholar]
- 14.Kacser H, Burns JA. The molecular basis of dominance. Genetics. 1981;97(3-4):639–666. doi: 10.1093/genetics/97.3-4.639. [DOI] [PMC free article] [PubMed] [Google Scholar]
- 15.Dykhuizen DE, Dean AM, Hartl DL. Metabolic flux and fitness. Genetics. 1987;115(1):25–31. doi: 10.1093/genetics/115.1.25. [DOI] [PMC free article] [PubMed] [Google Scholar]
- 16.Ptitsyn OB. Molten globule and protein folding. Adv Protein Chem. 1995;47:83–229. doi: 10.1016/s0065-3233(08)60546-x. [DOI] [PubMed] [Google Scholar]
- 17.Goldberg ME, et al. An early immunoreactive folding intermediate of the tryptophan synthease beta 2 subunit is a ‘molten globule’. FEBS Lett. 1990;263(1):51–56. doi: 10.1016/0014-5793(90)80703-l. [DOI] [PubMed] [Google Scholar]
- 18.Fierke CA, Johnson KA, Benkovic SJ. Construction and evaluation of the kinetic scheme associated with dihydrofolate reductase from Escherichia coli. Biochemistry. 1987;26(13):4085–4092. doi: 10.1021/bi00387a052. [DOI] [PubMed] [Google Scholar]
- 19.Taniguchi Y, et al. Quantifying E. coli proteome and transcriptome with single-molecule sensitivity in single cells. Science. 2010;329(5991):533–538. doi: 10.1126/science.1188308. [DOI] [PMC free article] [PubMed] [Google Scholar]
- 20.Bershtein S, et al. Protein homeostasis imposes a barrier on functional integration of horizontally transferred genes in bacteria. PLoS Genet. 2015;11(10):e1005612. doi: 10.1371/journal.pgen.1005612. [DOI] [PMC free article] [PubMed] [Google Scholar]
- 21.Bennett BD, et al. Absolute metabolite concentrations and implied enzyme active site occupancy in Escherichia coli. Nat Chem Biol. 2009;5(8):593–599. doi: 10.1038/nchembio.186. [DOI] [PMC free article] [PubMed] [Google Scholar]
- 22.Werner RG, Goeth H. Trimethoprim, failure to penetrate into Pseudomonas-aeruginosa cells. FEMS Microbiol Lett. 1984;23(2-3):201–204. [Google Scholar]
- 23.Bollenbach T, Quan S, Chait R, Kishony R. Nonoptimal microbial response to antibiotics underlies suppressive drug interactions. Cell. 2009;139(4):707–718. doi: 10.1016/j.cell.2009.10.025. [DOI] [PMC free article] [PubMed] [Google Scholar]
- 24.Bershtein S, Choi JM, Bhattacharyya S, Budnik B, Shakhnovich E. Systems-level response to point mutations in a core metabolic enzyme modulates genotype-phenotype relationship. Cell Reports. 2015;11(4):645–656. doi: 10.1016/j.celrep.2015.03.051. [DOI] [PMC free article] [PubMed] [Google Scholar]
- 25.Kitagawa M, et al. Complete set of ORF clones of Escherichia coli ASKA library (a complete set of E. coli K-12 ORF archive): Unique resources for biological research. DNA Res. 2005;12(5):291–299. doi: 10.1093/dnares/dsi012. [DOI] [PubMed] [Google Scholar]
- 26.Flensburg J, Sköld O. Massive overproduction of dihydrofolate reductase in bacteria as a response to the use of trimethoprim. Eur J Biochem. 1987;162(3):473–476. doi: 10.1111/j.1432-1033.1987.tb10664.x. [DOI] [PubMed] [Google Scholar]
- 27.Nicoloff H, Andersson DI. Lon protease inactivation, or translocation of the lon gene, potentiate bacterial evolution to antibiotic resistance. Mol Microbiol. 2013;90(6):1233–1248. doi: 10.1111/mmi.12429. [DOI] [PubMed] [Google Scholar]
- 28.de Visser JA, Krug J. Empirical fitness landscapes and the predictability of evolution. Nat Rev Genet. 2014;15(7):480–490. doi: 10.1038/nrg3744. [DOI] [PubMed] [Google Scholar]
- 29.Chou HH, Delaney NF, Draghi JA, Marx CJ. Mapping the fitness landscape of gene expression uncovers the cause of antagonism and sign epistasis between adaptive mutations. PLoS Genet. 2014;10(2):e1004149. doi: 10.1371/journal.pgen.1004149. [DOI] [PMC free article] [PubMed] [Google Scholar]
- 30.Jacquier H, et al. Capturing the mutational landscape of the beta-lactamase TEM-1. Proc Natl Acad Sci USA. 2013;110(32):13067–13072. doi: 10.1073/pnas.1215206110. [DOI] [PMC free article] [PubMed] [Google Scholar]
- 31.Tokuriki N, Tawfik DS. Chaperonin overexpression promotes genetic variation and enzyme evolution. Nature. 2009;459(7247):668–673. doi: 10.1038/nature08009. [DOI] [PubMed] [Google Scholar]
- 32.Queitsch C, Sangster TA, Lindquist S. Hsp90 as a capacitor of phenotypic variation. Nature. 2002;417(6889):618–624. doi: 10.1038/nature749. [DOI] [PubMed] [Google Scholar]
- 33.Jiang L, Mishra P, Hietpas RT, Zeldovich KB, Bolon DN. Latent effects of Hsp90 mutants revealed at reduced expression levels. PLoS Genet. 2013;9(6):e1003600. doi: 10.1371/journal.pgen.1003600. [DOI] [PMC free article] [PubMed] [Google Scholar]
- 34.Tian J, Woodard JC, Whitney A, Shakhnovich EI. Thermal stabilization of dihydrofolate reductase using monte carlo unfolding simulations and its functional consequences. PLOS Comput Biol. 2015;11(4):e1004207. doi: 10.1371/journal.pcbi.1004207. [DOI] [PMC free article] [PubMed] [Google Scholar]
- 35.Johnson KA, Simpson ZB, Blom T. FitSpace explorer: An algorithm to evaluate multidimensional parameter space in fitting kinetic data. Anal Biochem. 2009;387(1):30–41. doi: 10.1016/j.ab.2008.12.025. [DOI] [PubMed] [Google Scholar]
- 36.Krohn KA, Link JM. Interpreting enzyme and receptor kinetics: Keeping it simple, but not too simple. Nucl Med Biol. 2003;30(8):819–826. doi: 10.1016/s0969-8051(03)00132-x. [DOI] [PubMed] [Google Scholar]
Associated Data
This section collects any data citations, data availability statements, or supplementary materials included in this article.


